This document describes how you can use Log Analytics to estimate the billable volume of your log entries. You can write queries that report and aggregate your billable volume by different dimensions, like resource type or application name, and then chart and view the query results.
How to query for billable volume
The billable volume of a log entry, which is the size that is
reported to Cloud Billing, is available through the storage_bytes field.
In your queries, you can use the storage_bytes field in the same way
that you use any schema field whose data type is INTEGER.
For example, you can include it in SELECT clauses, in
CASE statements, and in common table expressions.
For more information about querying your
logs, see the following documents:
Because Cloud Billing uses the billable volume when determining your costs, you can write queries that help you understand the sources of your costs. For example, you can write queries that help you determine which applications are writing the most log entries. To learn how to relate billable volume to cost, see the Cloud Logging sections of the Google Cloud Observability pricing page.
The billable volume of a log entry isn't the size of the LogEntry
object that was sent to the Cloud Logging API. The billable volume includes
bytes that are required for serialization and metadata.
Before you begin
This section describes steps that you must complete before you can use Log Analytics.
Configure log buckets
Ensure that your log buckets have been upgraded to use Log Analytics:
-
In the Google Cloud console, go to the Logs Storage page:
If you use the search bar to find this page, then select the result whose subheading is Logging.
- For each log bucket that has a log view that you want to query, ensure that the Log Analytics available column displays Open. If Upgrade is shown, then click Upgrade and complete the dialog.
Configure IAM roles and permissions
This section describes the IAM roles or permissions that are required to use Log Analytics:
-
To get the permissions that you need to use Log Analytics and query log views, ask your administrator to grant you the following IAM roles on your project:
-
To query the
_Requiredand_Defaultlog buckets: Logs Viewer (roles/logging.viewer) -
To query all log views in a project:
Logs View Accessor (
roles/logging.viewAccessor)
You can restrict a principal to a specific log view either by adding an IAM condition to the Logs View Accessor role grant made at the project level, or by adding an IAM binding to the policy file of the log view. For more information, see Control access to a log view.
These are the same permissions that you need to view log entries on the Logs Explorer page. For information about additional roles that you need to query views on user-defined buckets or to query the
_AllLogsview of the_Defaultlog bucket, see Cloud Logging roles. -
To query the
-
To get the permissions that you need to query analytics views, ask your administrator to grant you the Observability Analytics User (
roles/observability.analyticsUser) IAM role on your project.
Sample queries
This section provides example queries that analyze data from a single log view.
If you store data in multiple log views and if you want to compute aggregate
values for data stored in those views, then you need to use the UNION
statement.
You can query your log entry by using the Log Analytics page or anywhere you can query BigQuery datasets, which includes the BigQuery Studio and Looker Studio pages, and the bq command-line tool.
To use the sample queries, do the following:
Log Analytics page: Replace VIEW with the name of the log view. The format is
project_ID.region.bucket_ID.view_ID.BigQuery datasets: Replace VIEW with the path to the table in the linked dataset.
Query for log volume by app
To compute the total bytes per day, per app, for your log entries that were written against a Google Kubernetes Engine resource and that have a JSON payload, use the following query:
SELECT
  timestamp_trunc(timestamp,DAY) as day,
  JSON_VALUE(labels["k8s-pod/app"]) as app_id,
  SUM(storage_bytes) as total_bytes
FROM
  `VIEW`
WHERE
  json_payload IS NOT NULL
  AND resource.type="k8s_container"
GROUP BY ALL
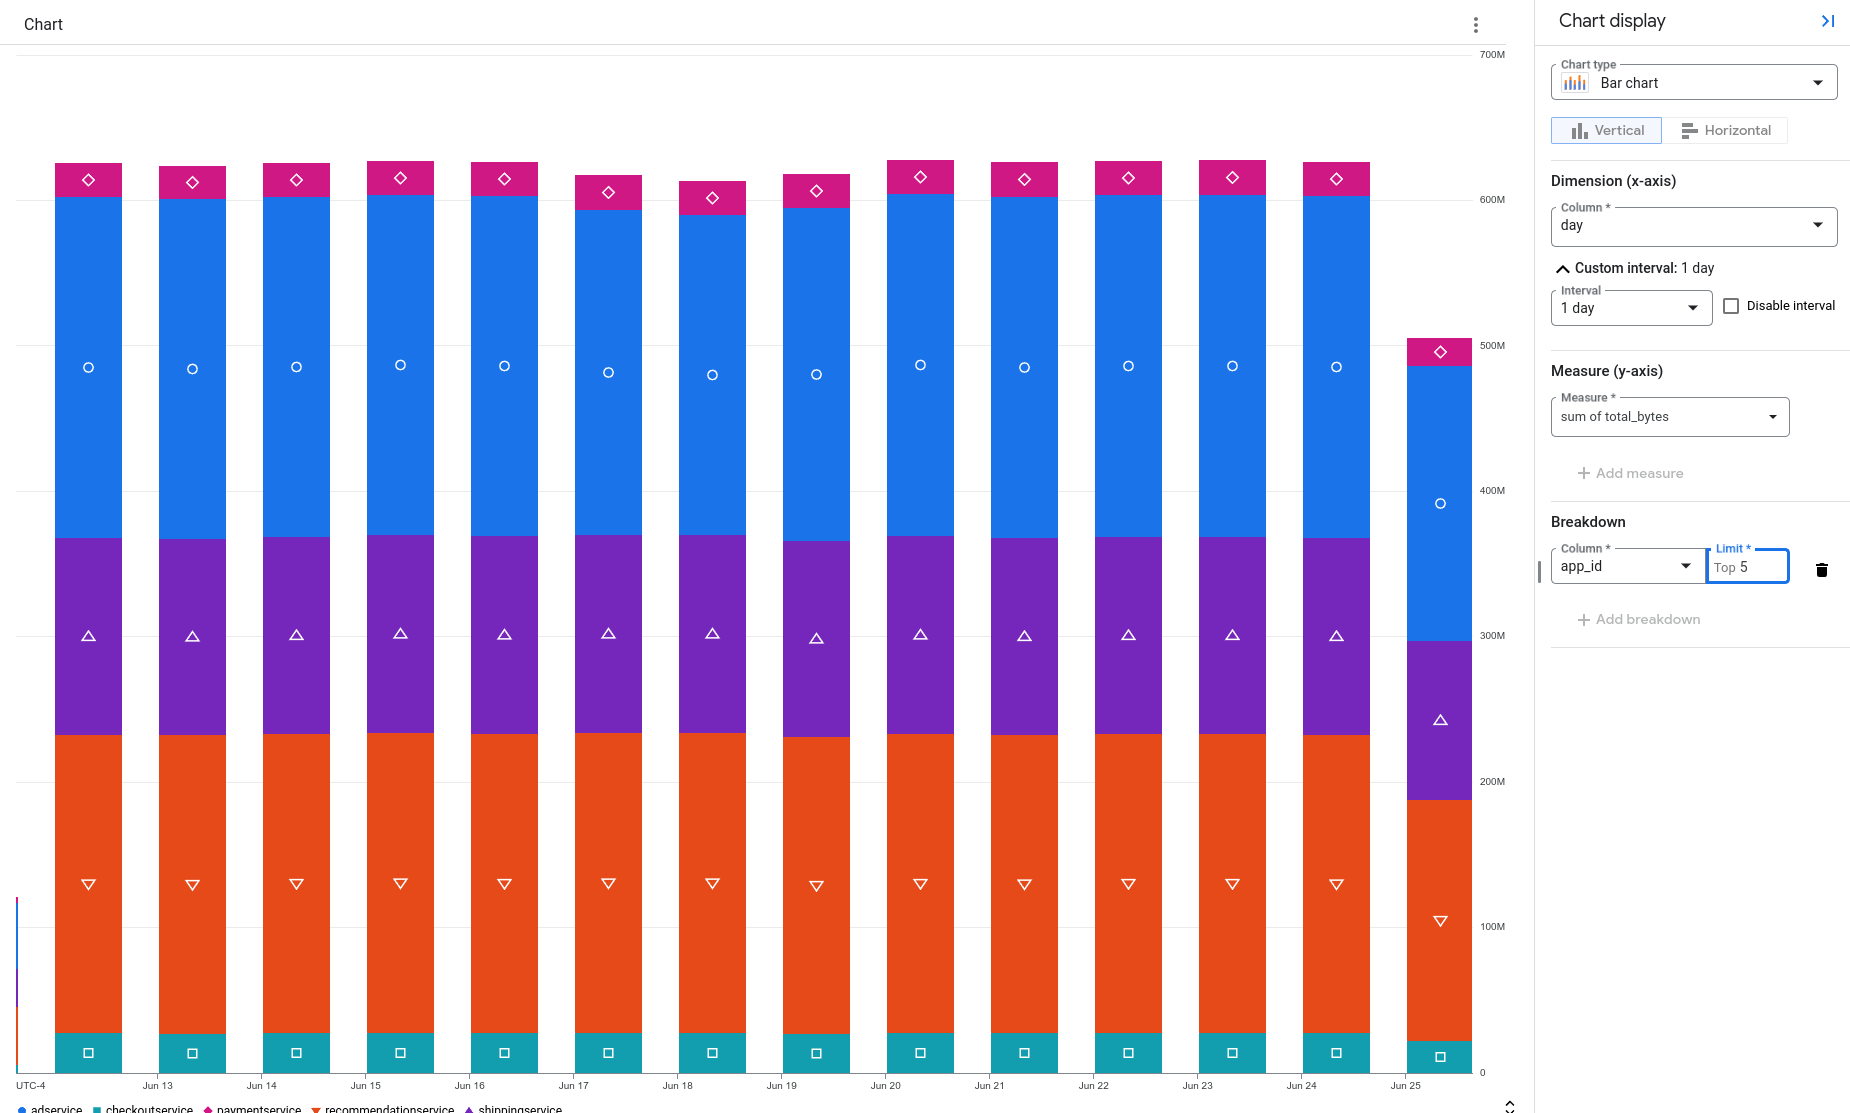
To visualize the data, you can create a chart.
In the following example,
the data is displayed as a stacked bar chart. Each bar on the chart displays the
total number of bytes stored, organized by app.
In this example, the frontend app is generating the most log data:
Query for log volume by log name
To list the number of stored bytes and the log name for each log entry that has a JSON payload and that was written against a Google Kubernetes Engine resource, use the following query;
SELECT
  log_id AS log_name,
  storage_bytes
FROM
  `VIEW`
WHERE
  json_payload IS NOT NULL
  AND resource.type="k8s_container"
The previous query doesn't aggregate the results, instead there is one row for each log entry, and that row contains a log name and the number of stored bytes. If you chart this data, then you can visualize the portion of your log data as written to different logs:
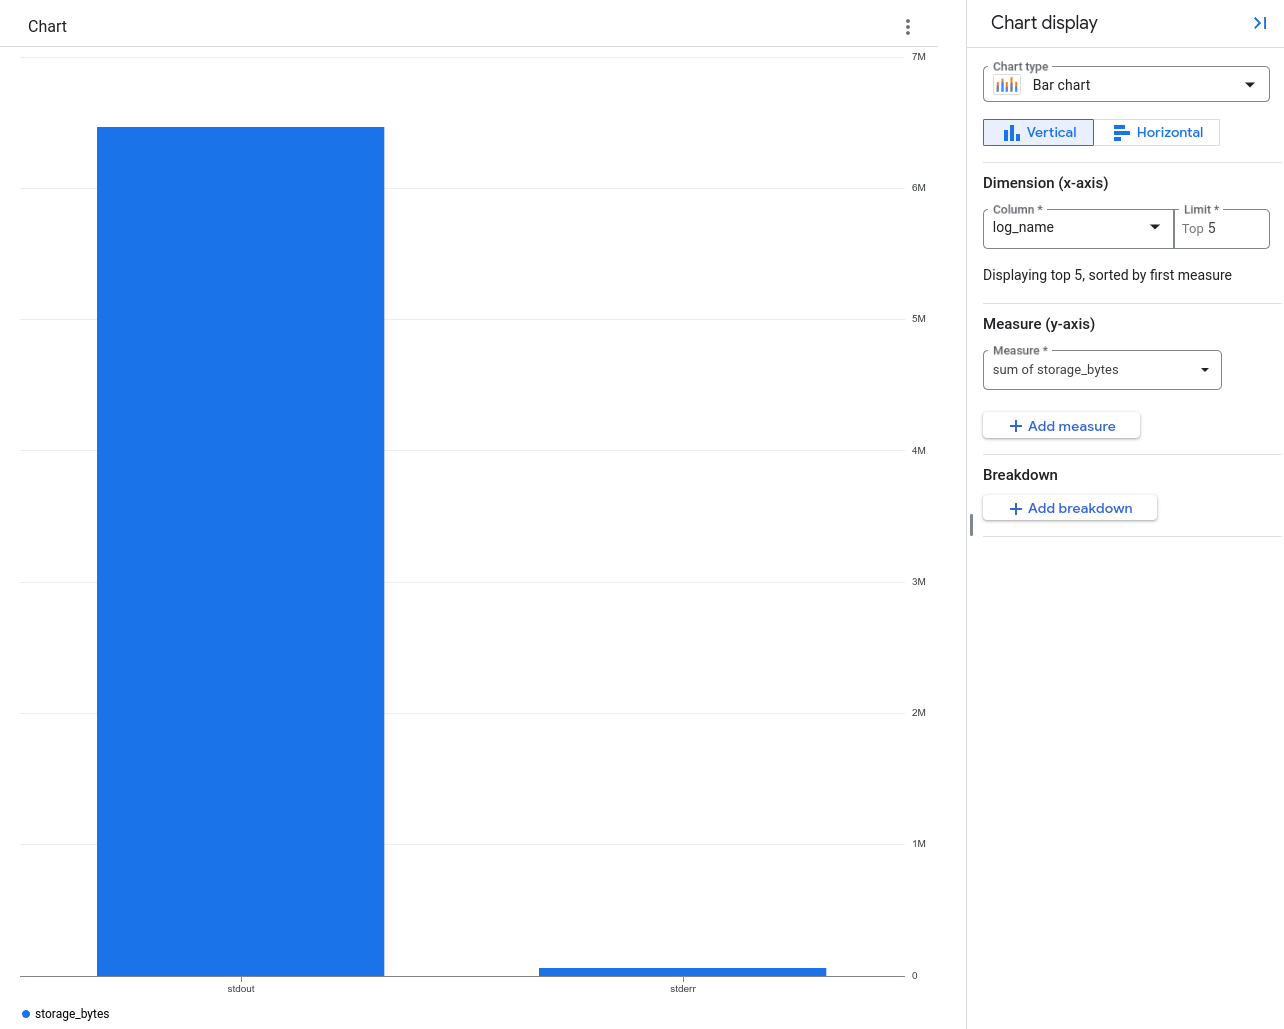
The previous chart shows that most log data is written to the log named
stdout.
Use the bq command-line tool to query for log volume by log name
You can include the storage_bytes field in queries that you run through the
BigQuery Studio page or by using the
bq command-line tool.
The following query reports the log name and the number of stored bytes for each log entry:
bq query --use_legacy_sql=false  'SELECT log_id as log_name,
  storage_bytes FROM `VIEW`'
The result of this query is similar to the following:
+----------+---------------+
| log_name | storage_bytes |
+----------+---------------+
| stdout   |           716 |
| stdout   |           699 |
| stdout   |           917 |
| stdout   |           704 |
Each row corresponds to one log entry. The value of the storage_bytes
column is the billable volume for that log entry.
Limitations
The storage_bytes field is available only when the following are true:
- The log bucket is upgraded to use Log Analytics.
Your query is executed on the Log Analytics page or anywhere you can query BigQuery datasets, which includes the BigQuery Studio and Looker Studio pages, and the bq command-line tool.
The log entry was written on or after January 1, 2024.