이 페이지에서는 GKE 추론 게이트웨이 배포를 맞춤설정하는 방법을 설명합니다.
이 페이지는 GKE 인프라 관리를 담당하는 네트워킹 전문가와 AI 워크로드를 관리하는 플랫폼 관리자를 대상으로 합니다.
추론 워크로드를 관리하고 최적화하려면 GKE 추론 게이트웨이의 고급 기능을 구성합니다.
다음 고급 기능을 이해하고 구성합니다.
- Model Armor 통합을 사용하려면 AI 보안 및 안전 검사를 구성하세요.
- API 보안, 비율 제한, 분석과 같은 기능으로 GKE 추론 게이트웨이를 개선하려면 인증 및 API 관리를 위해 Apigee를 구성하세요.
- 요청 본문의 모델 이름을 기반으로 요청을 라우팅하려면 본문 기반 라우팅을 구성하세요.
- GKE 추론 게이트웨이 및 모델 서버의 측정항목과 대시보드를 확인하고 HTTP 액세스 로깅을 사용 설정하려면 모니터링 가능성을 구성하세요.
- GKE 추론 게이트웨이 배포를 자동으로 확장하려면 자동 확장을 구성하세요.
AI 보안 및 안전 검사 구성
GKE 추론 게이트웨이는 Model Armor와 통합되어 대규모 언어 모델 (LLM)을 사용하는 애플리케이션의 프롬프트와 응답에 대한 안전성 검사를 실행합니다. 이 통합은 애플리케이션 수준 안전 조치를 보완하는 인프라 수준의 추가 안전 시행 레이어를 제공합니다. 이를 통해 모든 LLM 트래픽에 중앙 집중식 정책 적용이 가능합니다.
다음 다이어그램은 GKE 클러스터에서 GKE 추론 게이트웨이와 Model Armor의 통합을 보여줍니다.
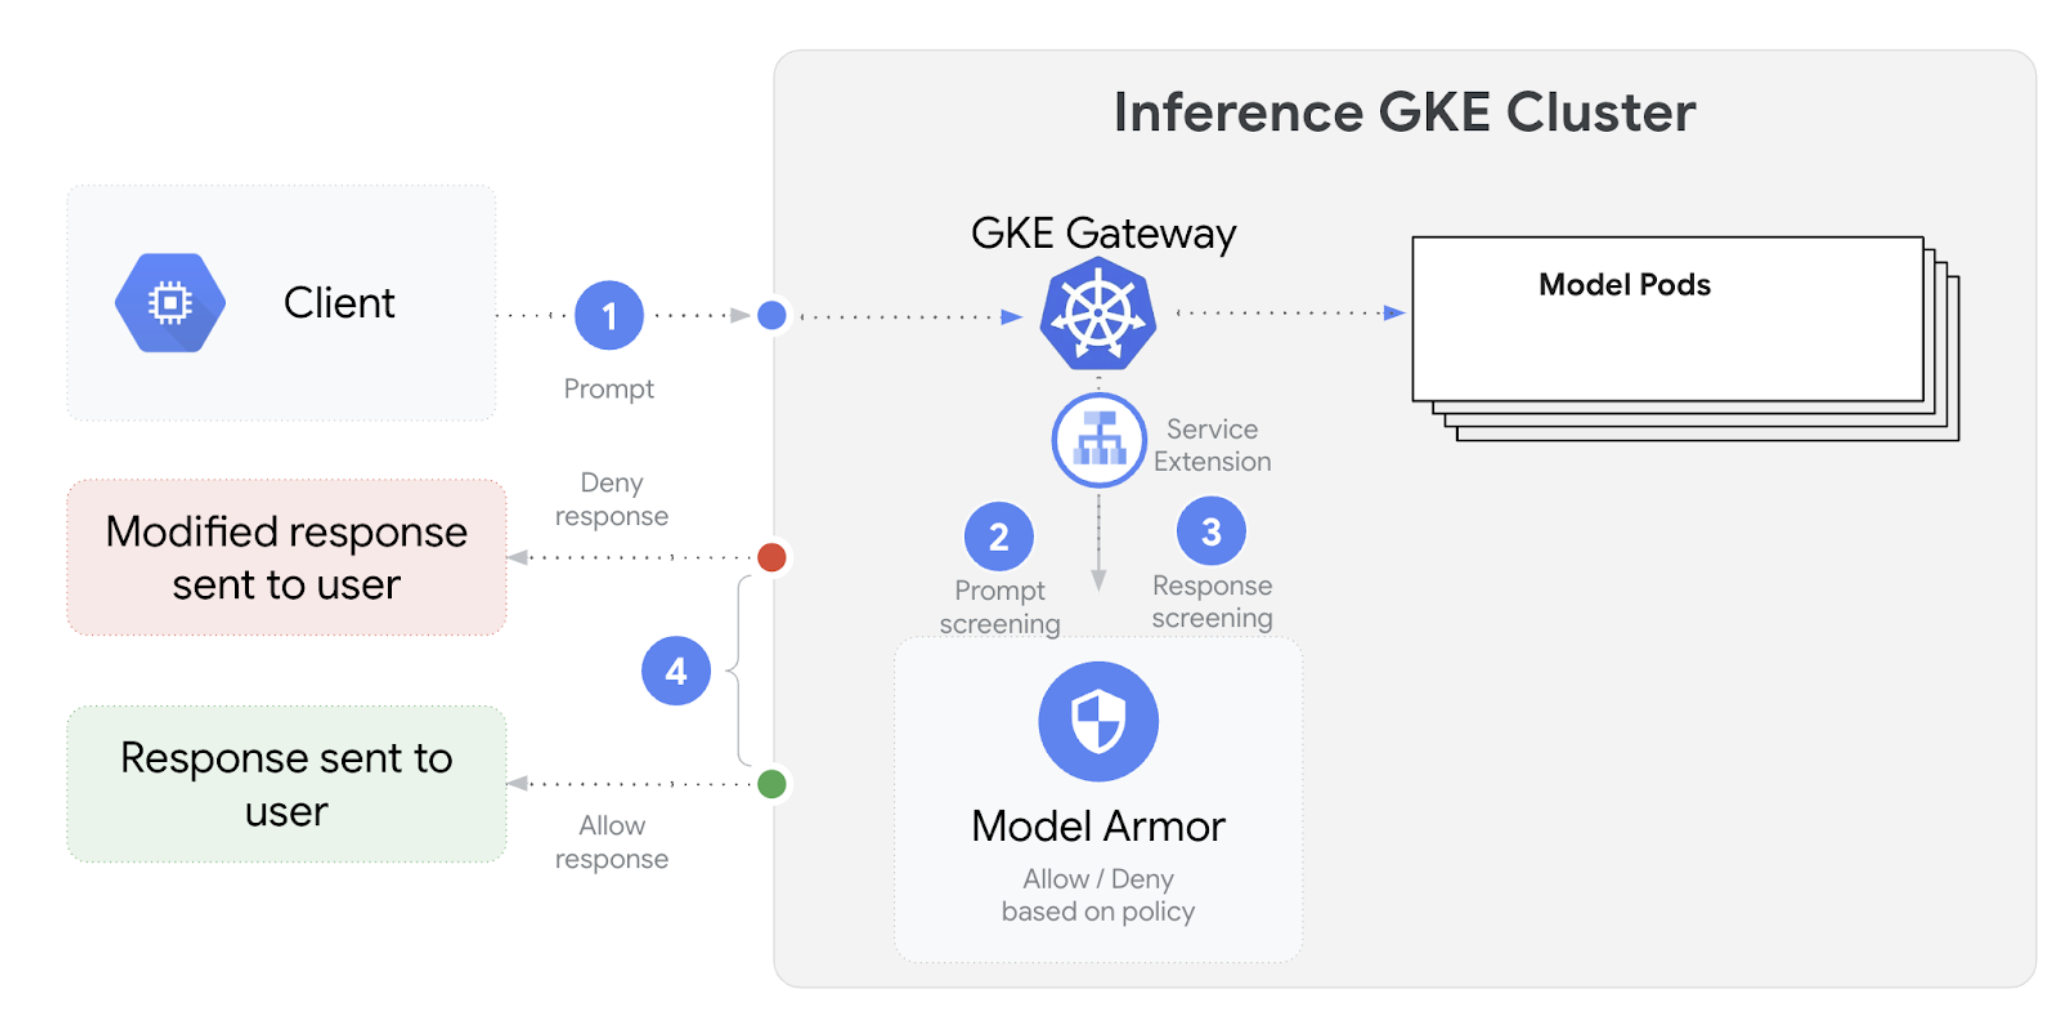
AI 안전 검사를 구성하려면 다음 단계를 수행하세요.
기본 요건
- Google Cloud 프로젝트에서 Model Armor 서비스를 사용 설정합니다.
Model Armor 콘솔, Google Cloud CLI 또는 API를 사용하여 Model Armor 템플릿을 만듭니다. 다음 명령어는 작업을 로깅하고 유해 콘텐츠를 필터링하는
llm라는 템플릿을 만듭니다.# Set environment variables PROJECT_ID=$(gcloud config get-value project) # Replace <var>CLUSTER_LOCATION<var> with the location of your GKE cluster. For example, `us-central1`. LOCATION="CLUSTER_LOCATION" MODEL_ARMOR_TEMPLATE_NAME=llm # Set the regional API endpoint gcloud config set api_endpoint_overrides/modelarmor \ "https://modelarmor.$LOCATION.rep.googleapis.com/" # Create the template gcloud model-armor templates create $MODEL_ARMOR_TEMPLATE_NAME \ --location $LOCATION \ --pi-and-jailbreak-filter-settings-enforcement=enabled \ --pi-and-jailbreak-filter-settings-confidence-level=MEDIUM_AND_ABOVE \ --rai-settings-filters='[{ "filterType": "HATE_SPEECH", "confidenceLevel": "MEDIUM_AND_ABOVE" },{ "filterType": "DANGEROUS", "confidenceLevel": "MEDIUM_AND_ABOVE" },{ "filterType": "HARASSMENT", "confidenceLevel": "MEDIUM_AND_ABOVE" },{ "filterType": "SEXUALLY_EXPLICIT", "confidenceLevel": "MEDIUM_AND_ABOVE" }]' \ --template-metadata-log-sanitize-operations \ --template-metadata-log-operations
IAM 권한 부여
서비스 확장 프로그램 서비스 계정에는 필요한 리소스에 액세스할 수 있는 권한이 필요합니다. 다음 명령어를 실행하여 필요한 역할을 부여합니다.
PROJECT_NUMBER=$(gcloud projects describe $PROJECT_ID --format 'get(projectNumber)') gcloud projects add-iam-policy-binding $PROJECT_ID \ --member=serviceAccount:service-$PROJECT_NUMBER@gcp-sa-dep.iam.gserviceaccount.com \ --role=roles/container.admin gcloud projects add-iam-policy-binding $PROJECT_ID \ --member=serviceAccount:service-$PROJECT_NUMBER@gcp-sa-dep.iam.gserviceaccount.com \ --role=roles/modelarmor.calloutUser gcloud projects add-iam-policy-binding $PROJECT_ID \ --member=serviceAccount:service-$PROJECT_NUMBER@gcp-sa-dep.iam.gserviceaccount.com \ --role=roles/serviceusage.serviceUsageConsumer gcloud projects add-iam-policy-binding $PROJECT_ID \ --member=serviceAccount:service-$PROJECT_NUMBER@gcp-sa-dep.iam.gserviceaccount.com \ --role=roles/modelarmor.userGCPTrafficExtension구성게이트웨이에 Model Armor 정책을 적용하려면 올바른 메타데이터 형식으로
GCPTrafficExtension리소스를 만듭니다.다음 샘플 매니페스트를
gcp-traffic-extension.yaml로 저장합니다.kind: GCPTrafficExtension apiVersion: networking.gke.io/v1 metadata: name: my-model-armor-extension spec: targetRefs: - group: "gateway.networking.k8s.io" kind: Gateway name: GATEWAY_NAME extensionChains: - name: my-model-armor-chain1 matchCondition: celExpressions: - celMatcher: request.path.startsWith("/") extensions: - name: my-model-armor-service supportedEvents: - RequestHeaders - RequestBody - RequestTrailers - ResponseHeaders - ResponseBody - ResponseTrailers timeout: 1s failOpen: false googleAPIServiceName: "modelarmor.${LOCATION}.rep.googleapis.com" metadata: model_armor_settings: '[{"model": "${MODEL}","model_response_template_id": "projects/${PROJECT_ID}/locations/${LOCATION}/templates/${MODEL_ARMOR_TEMPLATE_NAME}","user_prompt_template_id": "projects/${PROJECT_ID}/locations/${LOCATION}/templates/${MODEL_ARMOR_TEMPLATE_NAME}"}]'다음을 바꿉니다.
GATEWAY_NAME: 게이트웨이의 이름입니다.MODEL_ARMOR_TEMPLATE_NAME: Model Armor 템플릿의 이름입니다.
gcp-traffic-extension.yaml파일에는 다음 설정이 포함됩니다.targetRefs: 이 확장 프로그램이 적용되는 게이트웨이를 지정합니다.extensionChains: 트래픽에 적용할 확장 프로그램 체인을 정의합니다.matchCondition: 확장 프로그램이 적용되는 조건을 정의합니다.extensions: 적용할 확장 프로그램을 정의합니다.supportedEvents: 확장 프로그램이 호출되는 이벤트를 지정합니다.timeout: 확장 프로그램의 제한 시간을 지정합니다.googleAPIServiceName: 확장 프로그램의 서비스 이름을 지정합니다.metadata:extensionPolicy및 프롬프트 또는 응답 삭제 설정을 비롯한 확장 프로그램의 메타데이터를 지정합니다.
샘플 매니페스트를 클러스터에 적용합니다.
export GATEWAY_NAME="your-gateway-name"
export MODEL="google/gemma-3-1b-it" # Or your specific model
envsubst < gcp-traffic-extension.yaml | kubectl apply -f -
AI 안전 검사를 구성하고 게이트웨이와 통합하면 Model Armor가 정의된 규칙에 따라 프롬프트와 대답을 자동으로 필터링합니다.
인증 및 API 관리를 위해 Apigee 구성
GKE Inference Gateway는 Apigee와 통합되어 추론 워크로드에 대한 인증, 승인, API 관리를 제공합니다. Apigee 사용의 이점에 대해 자세히 알아보려면 Apigee 사용의 주요 이점을 참고하세요.
GKE 추론 게이트웨이를 Apigee와 통합하여 API 보안, 비율 제한, 할당량, 분석, 수익 창출과 같은 기능으로 GKE 추론 게이트웨이를 개선할 수 있습니다.
기본 요건
시작하기 전에 다음 사항을 확인하세요.
- 버전 1.34.* 이상을 실행하는 GKE 클러스터
- GKE 추론 게이트웨이가 배포된 GKE 클러스터
- GKE 클러스터와 동일한 리전에 생성된 Apigee 인스턴스
- GKE 클러스터에 설치된 Apigee APIM Operator 및 해당 CRD 자세한 내용은 Apigee APIM Operator 설치를 참고하세요.
- GKE 클러스터에 연결하도록 구성된
kubectl Google Cloud CLI가 설치되고 인증되어 있어야 합니다.
ApigeeBackendService 만들기
먼저 ApigeeBackendService 리소스를 만듭니다. GKE 추론 게이트웨이는 이를 사용하여 Apigee 확장 프로그램 프로세서를 만듭니다.
다음 매니페스트를
my-apigee-backend-service.yaml로 저장합니다.apiVersion: apim.googleapis.com/v1 kind: ApigeeBackendService metadata: name: my-apigee-backend-service spec: apigeeEnv: "APIGEE_ENVIRONMENT_NAME" # optional field defaultSecurityEnabled: true # optional field locations: name: "LOCATION" network: "CLUSTER_NETWORK" subnetwork: "CLUSTER_SUBNETWORK"다음을 바꿉니다.
APIGEE_ENVIRONMENT_NAME: Apigee 환경의 이름입니다. 참고:generateEnv=TRUE플래그를 사용하여apigee-apim-operator를 설치한 경우에는 이 필드를 설정할 필요가 없습니다. 그렇지 않은 경우 환경 만들기의 안내에 따라 Apigee 환경을 만듭니다.LOCATION: Apigee 인스턴스의 위치입니다.CLUSTER_NETWORK: GKE 클러스터의 네트워크입니다.CLUSTER_SUBNETWORK: GKE 클러스터의 서브네트워크입니다.
매니페스트를 클러스터에 적용합니다.
kubectl apply -f my-apigee-backend-service.yaml상태가
CREATED이 되었는지 확인합니다.kubectl wait --for=jsonpath='{.status.currentState}'="CREATED" -f my-apigee-backend-service.yaml --timeout=5m
GKE 추론 게이트웨이 구성
Apigee 확장 프로그램 프로세서를 부하 분산기 트래픽 확장 프로그램으로 사용 설정하도록 GKE 추론 게이트웨이를 구성합니다.
다음 매니페스트를
my-apigee-traffic-extension.yaml로 저장합니다.kind: GCPTrafficExtension apiVersion: networking.gke.io/v1 metadata: name: my-apigee-traffic-extension spec: targetRefs: - group: "gateway.networking.k8s.io" kind: Gateway name: GATEWAY_NAME extensionChains: - name: my-traffic-extension-chain matchCondition: celExpressions: - celMatcher: request.path.startsWith("/") extensions: - name: my-apigee-extension metadata: # The value for `apigee-extension-processor` must match the name of the `ApigeeBackendService` resource that was applied earlier. apigee-extension-processor: my-apigee-backend-service failOpen: false timeout: 1s supportedEvents: - RequestHeaders - ResponseHeaders - ResponseBody backendRef: group: apim.googleapis.com kind: ApigeeBackendService name: my-apigee-backend-service port: 443GATEWAY_NAME을 게이트웨이 이름으로 바꿉니다.매니페스트를 클러스터에 적용합니다.
kubectl apply -f my-apigee-traffic-extension.yamlGCPTrafficExtension상태가Programmed이 될 때까지 기다립니다.kubectl wait --for=jsonpath='{.status.ancestors[0].conditions[?(@.type=="Programmed")].status}'=True -f my-apigee-traffic-extension.yaml --timeout=5m
API 키를 사용하여 인증된 요청 보내기
GKE Inference Gateway의 IP 주소를 확인하려면 게이트웨이 상태를 검사하세요.
GW_IP=$(kubectl get gateway/GATEWAY_NAME -o jsonpath='{.status.addresses[0].value}')GATEWAY_NAME을 게이트웨이 이름으로 바꿉니다.인증 없이 요청을 테스트합니다. 이 요청은 거부해야 합니다.
curl -i ${GW_IP}/v1/completions -H 'Content-Type: application/json' -d '{
"model": "food-review",
"prompt": "Write as if you were a critic: San Francisco",
"max_tokens": 100,
"temperature": 0
}'
Apigee 확장 프로그램이 작동하고 있음을 나타내는 다음과 비슷한 응답이 표시됩니다.
{"fault":{"faultstring":"Raising fault. Fault name : RF-insufficient-request-raise-fault","detail":{"errorcode":"steps.raisefault.RaiseFault"}}}Apigee UI에 액세스하여 API 키를 만듭니다. 자세한 내용은 API 키 만들기를 참고하세요.
HTTP 요청 헤더에 API 키를 전송합니다.
curl -i ${GW_IP}/v1/completions -H 'Content-Type: application/json' -H 'x-api-key: API_KEY' -d '{ "model": "food-review", "prompt": "Write as if you were a critic: San Francisco", "max_tokens": 100, "temperature": 0 }'API_KEY를 내 API 키로 바꿉니다.
Apigee 정책 구성에 대한 자세한 내용은 Kubernetes용 Apigee APIM Operator로 API 관리 정책 사용을 참고하세요.
관측 가능성 구성
GKE Inference Gateway는 추론 워크로드의 상태, 성능, 동작에 대한 통계를 제공합니다. 이를 통해 문제를 식별하고 해결하고, 리소스 사용률을 최적화하고, 애플리케이션의 안정성을 보장할 수 있습니다.
Google Cloud 는 GKE 추론 게이트웨이의 추론 관측 가능성을 제공하는 다음 Cloud Monitoring 대시보드를 제공합니다.
- GKE Inference Gateway 대시보드:
InferencePool의 요청 및 토큰 처리량, 지연 시간, 오류, 캐시 사용률과 같은 LLM 서빙을 위한 주요 측정항목을 제공합니다. 사용 가능한 GKE 추론 게이트웨이 측정항목의 전체 목록을 확인하려면 노출된 측정항목을 참고하세요. - AI/ML 모니터링 가능성 대시보드: 인프라 사용량, DCGM 측정항목, vLLM 모델 성능 측정항목을 위한 대시보드를 제공합니다.
- 모델 서버 대시보드: 모델 서버의 주요 신호에 대한 대시보드를 제공합니다. 이를 통해
KVCache Utilization및Queue length과 같은 모델 서버의 부하와 성능을 모니터링할 수 있습니다. - 부하 분산기 대시보드: 초당 요청 수, 엔드 투 엔드 요청 처리 지연 시간, 요청-응답 상태 코드 등 부하 분산기의 측정항목을 보고합니다. 이러한 측정항목은 엔드 투 엔드 요청 처리 성능을 이해하고 오류를 식별하는 데 도움이 됩니다.
- Data Center GPU Manager (DCGM) 측정항목: NVIDIA GPU의 성능 및 사용률과 같은 DCGM 측정항목을 제공합니다. Cloud Monitoring에서 DCGM 측정항목을 구성할 수 있습니다. 자세한 내용은 DCGM 측정항목 수집 및 보기를 참고하세요.
GKE 추론 게이트웨이 대시보드 보기
GKE Inference Gateway 대시보드를 보려면 다음 단계를 수행하세요.
Google Cloud 콘솔에서 Monitoring 페이지로 이동합니다.
탐색창에서 대시보드를 선택합니다.
통합 섹션에서 GMP를 선택합니다.
Cloud Monitoring 대시보드 템플릿 페이지에서 '게이트웨이'를 검색합니다.
GKE Inference Gateway 대시보드를 확인합니다.
또는 모니터링 대시보드의 안내를 따를 수 있습니다.
AI/ML 모델 관측 가능성 대시보드 보기
배포된 모델과 모델의 관측 가능성 측정항목 대시보드를 보려면 다음 단계를 따르세요.
Google Cloud 콘솔에서 배포된 모델 페이지로 이동합니다.
측정항목, 로그, 대시보드 등 특정 배포에 관한 세부정보를 보려면 목록에서 모델 이름을 클릭합니다.
모델 세부정보 페이지에서 관측 가능성 탭을 클릭하여 다음 대시보드를 확인합니다. 메시지가 표시되면 사용 설정을 클릭하여 대시보드를 사용 설정합니다.
- 인프라 사용량 대시보드에는 사용률 측정항목이 표시됩니다.
- DCGM 대시보드에는 DCGM 측정항목이 표시됩니다.
- vLLM을 사용하는 경우 모델 성능 대시보드를 사용할 수 있으며 vLLM 모델 성능 측정항목이 표시됩니다.
모델 서버 관측 가능성 대시보드 구성
각 모델 서버에서 주요 신호를 수집하고 GKE 추론 게이트웨이 성능에 기여하는 요소를 파악하려면 모델 서버의 자동 모니터링을 구성하면 됩니다. 여기에는 다음과 같은 모델 서버가 포함됩니다.
통합 대시보드를 보려면 먼저 모델 서버에서 측정항목을 수집하고 있는지 확인하세요. 그런 다음 다음 단계를 수행합니다.
Google Cloud 콘솔에서 Monitoring 페이지로 이동합니다.
탐색창에서 대시보드를 선택합니다.
통합에서 GMP를 선택합니다. 해당 통합 대시보드가 표시됩니다.
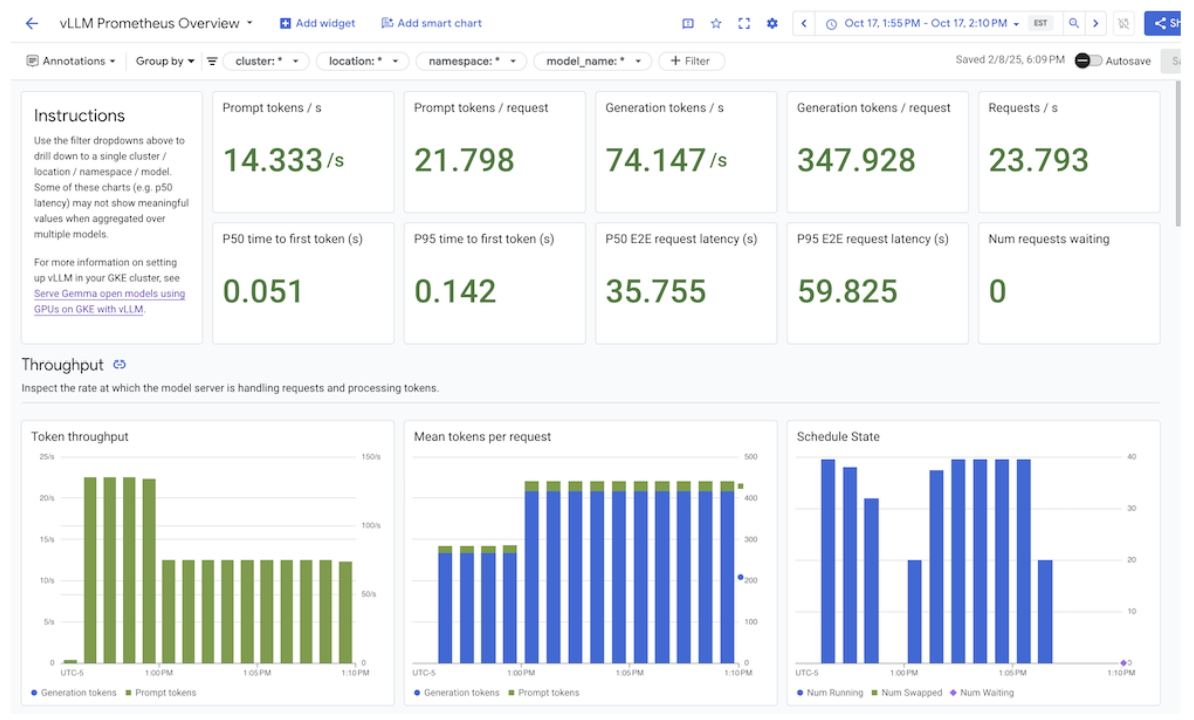
그림: 통합 대시보드
자세한 내용은 애플리케이션 모니터링 맞춤설정을 참고하세요.
Cloud Monitoring 알림 구성
GKE 추론 게이트웨이에 대한 Cloud Monitoring 알림을 구성하려면 다음 단계를 수행하세요.
다음 샘플 매니페스트를
alerts.yaml로 저장하고 필요에 따라 기준점을 수정합니다.groups: - name: gateway-api-inference-extension rules: - alert: HighInferenceRequestLatencyP99 annotations: title: 'High latency (P99) for model {{ $labels.model_name }}' description: 'The 99th percentile request duration for model {{ $labels.model_name }} and target model {{ $labels.target_model_name }} has been consistently above 10.0 seconds for 5 minutes.' expr: histogram_quantile(0.99, rate(inference_model_request_duration_seconds_bucket[5m])) > 10.0 for: 5m labels: severity: 'warning' - alert: HighInferenceErrorRate annotations: title: 'High error rate for model {{ $labels.model_name }}' description: 'The error rate for model {{ $labels.model_name }} and target model {{ $labels.target_model_name }} has been consistently above 5% for 5 minutes.' expr: sum by (model_name) (rate(inference_model_request_error_total[5m])) / sum by (model_name) (rate(inference_model_request_total[5m])) > 0.05 for: 5m labels: severity: 'critical' impact: 'availability' - alert: HighInferencePoolAvgQueueSize annotations: title: 'High average queue size for inference pool {{ $labels.name }}' description: 'The average number of requests pending in the queue for inference pool {{ $labels.name }} has been consistently above 50 for 5 minutes.' expr: inference_pool_average_queue_size > 50 for: 5m labels: severity: 'critical' impact: 'performance' - alert: HighInferencePoolAvgKVCacheUtilization annotations: title: 'High KV cache utilization for inference pool {{ $labels.name }}' description: 'The average KV cache utilization for inference pool {{ $labels.name }} has been consistently above 90% for 5 minutes, indicating potential resource exhaustion.' expr: inference_pool_average_kv_cache_utilization > 0.9 for: 5m labels: severity: 'critical' impact: 'resource_exhaustion'알림 정책을 만들려면 다음 명령어를 실행하세요.
gcloud alpha monitoring policies migrate --policies-from-prometheus-alert-rules-yaml=alerts.yaml알림 페이지에 새 알림 정책이 표시됩니다.
알림 수정
kubernetes-sigs/gateway-api-inference-extension GitHub 저장소에서 사용 가능한 최신 측정항목의 전체 목록을 확인할 수 있으며, 다른 측정항목을 사용하여 매니페스트에 새 알림을 추가할 수 있습니다.
샘플 알림을 수정하려면 다음 예시를 참고하세요.
  - alert: HighInferenceRequestLatencyP99
    annotations:
      title: 'High latency (P99) for model {{ $labels.model_name }}'
      description: 'The 99th percentile request duration for model {{ $labels.model_name }} and target model {{ $labels.target_model_name }} has been consistently above 10.0 seconds for 5 minutes.'
    expr: histogram_quantile(0.99, rate(inference_model_request_duration_seconds_bucket[5m])) > 10.0
    for: 5m
    labels:
      severity: 'warning'
이 알림은 5분 동안의 요청 기간의 99번째 백분위수가 10초를 초과하는 경우 실행됩니다. 요구사항에 따라 임곗값을 조정하려면 알림의 expr 섹션을 수정하면 됩니다.
GKE 추론 게이트웨이의 로깅 구성
GKE Inference Gateway의 로깅을 구성하면 요청 및 응답에 관한 세부정보가 제공되므로 문제 해결, 감사, 성능 분석에 유용합니다. HTTP 액세스 로그는 헤더, 상태 코드, 타임스탬프를 비롯한 모든 요청과 응답을 기록합니다. 이러한 세부정보는 문제를 식별하고, 오류를 찾고, 추론 워크로드의 동작을 이해하는 데 도움이 됩니다.
GKE 추론 게이트웨이의 로깅을 구성하려면 각 InferencePool 객체에 대해 HTTP 액세스 로깅을 사용 설정하세요.
다음 샘플 매니페스트를
logging-backend-policy.yaml로 저장합니다.apiVersion: networking.gke.io/v1 kind: GCPBackendPolicy metadata: name: logging-backend-policy namespace: NAMESPACE_NAME spec: default: logging: enabled: true sampleRate: 500000 targetRef: group: inference.networking.x-k8s.io kind: InferencePool name: INFERENCE_POOL_NAME다음을 바꿉니다.
NAMESPACE_NAME:InferencePool가 배포된 네임스페이스의 이름입니다.INFERENCE_POOL_NAME:InferencePool이름입니다.
샘플 매니페스트를 클러스터에 적용합니다.
kubectl apply -f logging-backend-policy.yaml
이 매니페스트를 적용하면 GKE Inference Gateway가 지정된 InferencePool에 대해 HTTP 액세스 로그를 사용 설정합니다. Cloud Logging에서 이러한 로그를 볼 수 있습니다. 로그에는 요청 URL, 헤더, 응답 상태 코드, 지연 시간 등 각 요청 및 응답에 관한 세부정보가 포함됩니다.
로그 기반 측정항목을 만들어 오류 세부정보 보기
로그 기반 측정항목을 사용하여 부하 분산 로그를 분석하고 오류 세부정보를 추출할 수 있습니다. gke-l7-global-external-managed 및 gke-l7-regional-internal-managed 게이트웨이 클래스와 같은 각 GKE 게이트웨이 클래스는 서로 다른 부하 분산기로 지원됩니다. 자세한 내용은 GatewayClass 기능을 참고하세요.
각 부하 분산기에는 로그 기반 측정항목을 만들 때 사용해야 하는 모니터링 리소스가 다릅니다. 각 부하 분산기의 모니터링 리소스에 대한 자세한 내용은 다음을 참고하세요.
- 리전 외부 부하 분산기: 외부 HTTP(S) 부하 분산기의 로그 기반 측정항목
- 내부 부하 분산기: 내부 HTTP(S) 부하 분산기의 로그 기반 측정항목
오류 세부정보를 보기 위한 로그 기반 측정항목을 만들려면 다음 단계를 따르세요.
다음
LogMetric정의로error_detail_metric.json이라는 JSON 파일을 만듭니다. 이 구성을 사용하면 부하 분산기 로그에서proxyStatus필드를 추출하는 측정항목이 생성됩니다.{ "description": "Metric to extract error details from load balancer logs.", "filter": "resource.type=\"MONITORED_RESOURCE\"", "metricDescriptor": { "metricKind": "DELTA", "valueType": "INT64", "labels": [ { "key": "error_detail", "valueType": "STRING", "description": "The detailed error string from the load balancer." } ] }, "labelExtractors": { "error_detail": "EXTRACT(jsonPayload.proxyStatus)" } }MONITORED_RESOURCE을 부하 분산기의 모니터링 리소스로 바꿉니다.gcloud CLI가 설치된 Cloud Shell 또는 로컬 터미널을 엽니다.
측정항목을 만들려면
--config-from-file플래그와 함께gcloud logging metrics create명령어를 실행합니다.gcloud logging metrics create error_detail_metric \ --config-from-file=error_detail_metric.json
측정항목을 만든 후 Cloud Monitoring에서 이를 사용하여 부하 분산기에서 보고한 오류의 분포를 볼 수 있습니다. 자세한 내용은 로그 기반 측정항목 만들기를 참고하세요.
로그 기반 측정항목에서 알림을 만드는 방법에 대한 자세한 내용은 카운터 측정항목에 대한 알림 정책 만들기를 참고하세요.
자동 확장 구성
자동 확장은 부하 변동에 따라 리소스 할당을 조정하여 수요에 따라 포드를 동적으로 추가하거나 삭제하여 성능과 리소스 효율성을 유지합니다. GKE 추론 게이트웨이의 경우 각 InferencePool에서 포드의 수평 자동 확장 처리가 필요합니다. GKE 수평형 포드 자동 확장 처리 (HPA)는 KVCache Utilization와 같은 모델 서버 측정항목을 기반으로 포드를 자동 확장합니다. 이렇게 하면 추론 서비스가 리소스 사용량을 효율적으로 관리하면서 다양한 워크로드와 쿼리 볼륨을 처리할 수 있습니다.
GKE 추론 게이트웨이에서 생성된 측정항목을 기반으로 자동 확장되도록 InferencePool 인스턴스를 구성하려면 다음 단계를 수행하세요.
클러스터에
PodMonitoring객체를 배포하여 GKE 추론 게이트웨이에서 생성된 측정항목을 수집합니다. 자세한 내용은 관측 가능성 구성을 참고하세요.커스텀 측정항목 Stackdriver 어댑터를 배포하여 HPA에 측정항목 액세스 권한을 부여합니다.
다음 샘플 매니페스트를
adapter_new_resource_model.yaml로 저장합니다.apiVersion: v1 kind: Namespace metadata: name: custom-metrics --- apiVersion: v1 kind: ServiceAccount metadata: name: custom-metrics-stackdriver-adapter namespace: custom-metrics --- apiVersion: rbac.authorization.k8s.io/v1 kind: ClusterRoleBinding metadata: name: custom-metrics:system:auth-delegator roleRef: apiGroup: rbac.authorization.k8s.io kind: ClusterRole name: system:auth-delegator subjects: - kind: ServiceAccount name: custom-metrics-stackdriver-adapter namespace: custom-metrics --- apiVersion: rbac.authorization.k8s.io/v1 kind: RoleBinding metadata: name: custom-metrics-auth-reader namespace: kube-system roleRef: apiGroup: rbac.authorization.k8s.io kind: Role name: extension-apiserver-authentication-reader subjects: - kind: ServiceAccount name: custom-metrics-stackdriver-adapter namespace: custom-metrics --- apiVersion: rbac.authorization.k8s.io/v1 kind: ClusterRole metadata: name: custom-metrics-resource-reader rules: - apiGroups: - "" resources: - pods - nodes - nodes/stats verbs: - get - list - watch --- apiVersion: rbac.authorization.k8s.io/v1 kind: ClusterRoleBinding metadata: name: custom-metrics-resource-reader roleRef: apiGroup: rbac.authorization.k8s.io kind: ClusterRole name: custom-metrics-resource-reader subjects: - kind: ServiceAccount name: custom-metrics-stackdriver-adapter namespace: custom-metrics --- apiVersion: apps/v1 kind: Deployment metadata: name: custom-metrics-stackdriver-adapter labels: run: custom-metrics-stackdriver-adapter k8s-app: custom-metrics-stackdriver-adapter spec: replicas: 1 selector: matchLabels: run: custom-metrics-stackdriver-adapter k8s-app: custom-metrics-stackdriver-adapter template: metadata: labels: run: custom-metrics-stackdriver-adapter k8s-app: custom-metrics-stackdriver-adapter kubernetes.io/cluster-service: "true" spec: serviceAccountName: custom-metrics-stackdriver-adapter containers: - image: gcr.io/gke-release/custom-metrics-stackdriver-adapter:v0.15.2-gke.1 imagePullPolicy: Always name: pod-custom-metrics-stackdriver-adapter command: - /adapter - --use-new-resource-model=true - --fallback-for-container-metrics=true resources: limits: cpu: 250m memory: 200Mi requests: cpu: 250m memory: 200Mi --- apiVersion: v1 kind: Service metadata: labels: run: custom-metrics-stackdriver-adapter k8s-app: custom-metrics-stackdriver-adapter kubernetes.io/cluster-service: 'true' kubernetes.io/name: Adapter name: custom-metrics-stackdriver-adapter namespace: custom-metrics spec: ports: - port: 443 protocol: TCP targetPort: 443 selector: run: custom-metrics-stackdriver-adapter k8s-app: custom-metrics-stackdriver-adapter type: ClusterIP --- apiVersion: apiregistration.k8s.io/v1 kind: APIService metadata: name: v1beta1.custom.metrics.k8s.io spec: insecureSkipTLSVerify: true group: custom.metrics.k8s.io groupPriorityMinimum: 100 versionPriority: 100 service: name: custom-metrics-stackdriver-adapter namespace: custom-metrics version: v1beta1 --- apiVersion: apiregistration.k8s.io/v1 kind: APIService metadata: name: v1beta2.custom.metrics.k8s.io spec: insecureSkipTLSVerify: true group: custom.metrics.k8s.io groupPriorityMinimum: 100 versionPriority: 200 service: name: custom-metrics-stackdriver-adapter namespace: custom-metrics version: v1beta2 --- apiVersion: apiregistration.k8s.io/v1 kind: APIService metadata: name: v1beta1.external.metrics.k8s.io spec: insecureSkipTLSVerify: true group: external.metrics.k8s.io groupPriorityMinimum: 100 versionPriority: 100 service: name: custom-metrics-stackdriver-adapter namespace: custom-metrics version: v1beta1 --- apiVersion: rbac.authorization.k8s.io/v1 kind: ClusterRole metadata: name: external-metrics-reader rules: - apiGroups: - "external.metrics.k8s.io" resources: - "*" verbs: - list - get - watch --- apiVersion: rbac.authorization.k8s.io/v1 kind: ClusterRoleBinding metadata: name: external-metrics-reader roleRef: apiGroup: rbac.authorization.k8s.io kind: ClusterRole name: external-metrics-reader subjects: - kind: ServiceAccount name: horizontal-pod-autoscaler namespace: kube-system샘플 매니페스트를 클러스터에 적용합니다.
kubectl apply -f adapter_new_resource_model.yaml
어댑터에 프로젝트의 측정항목을 읽을 권한을 부여하려면 다음 명령어를 실행하세요.
$ PROJECT_ID=PROJECT_ID $ PROJECT_NUMBER=$(gcloud projects describe PROJECT_ID --format="value(projectNumber)") $ gcloud projects add-iam-policy-binding projects/PROJECT_ID \ --role roles/monitoring.viewer \ --member=principal://iam.googleapis.com/projects/PROJECT_NUMBER/locations/global/workloadIdentityPools/$PROJECT_ID.svc.id.goog/subject/ns/custom-metrics/sa/custom-metrics-stackdriver-adapterPROJECT_ID를 Google Cloud 프로젝트 ID로 바꿉니다.각
InferencePool에 대해 다음과 유사한 HPA를 하나 배포합니다.apiVersion: autoscaling/v2 kind: HorizontalPodAutoscaler metadata: name: INFERENCE_POOL_NAME namespace: INFERENCE_POOL_NAMESPACE spec: scaleTargetRef: apiVersion: apps/v1 kind: Deployment name: INFERENCE_POOL_NAME minReplicas: MIN_REPLICAS maxReplicas: MAX_REPLICAS metrics: - type: External external: metric: name: prometheus.googleapis.com|inference_pool_average_kv_cache_utilization|gauge selector: matchLabels: metric.labels.name: INFERENCE_POOL_NAME resource.labels.cluster: CLUSTER_NAME resource.labels.namespace: INFERENCE_POOL_NAMESPACE target: type: AverageValue averageValue: TARGET_VALUE다음을 바꿉니다.
INFERENCE_POOL_NAME:InferencePool이름입니다.INFERENCE_POOL_NAMESPACE:InferencePool의 네임스페이스입니다.CLUSTER_NAME: 클러스터의 이름입니다.MIN_REPLICAS:InferencePool(기준 용량)의 최소 가용성입니다. HPA는 사용량이 HPA 타겟 임곗값 미만일 때 이 복제본 수를 유지합니다. 고가용성 워크로드는 포드 중단 시 지속적인 가용성을 보장하기 위해 이 값을1보다 높은 값으로 설정해야 합니다.MAX_REPLICAS:InferencePool에 호스팅된 워크로드에 할당해야 하는 가속기 수를 제한하는 값입니다. HPA는 이 값을 초과하여 복제본 수를 늘리지 않습니다. 트래픽이 가장 많은 시간대에는 복제본 수를 모니터링하여MAX_REPLICAS필드 값이 선택한 워크로드 성능 특성을 유지하기 위해 워크로드를 확장할 수 있도록 충분한 여유 공간을 제공하는지 확인합니다.TARGET_VALUE: 모델 서버별로 선택된 타겟KV-Cache Utilization을 나타내는 값입니다. 0~100 사이의 숫자이며 모델 서버, 모델, 액셀러레이터, 수신 트래픽 특성에 따라 크게 달라집니다. 로드 테스트를 통해 처리량 대 지연 시간 그래프를 플롯하여 이 타겟 값을 실험적으로 결정할 수 있습니다. 그래프에서 선택한 처리량과 지연 시간 조합을 선택하고 해당KV-Cache Utilization값을 HPA 타겟으로 사용합니다. 선택한 가격 대비 성능 결과를 달성하려면 이 값을 조정하고 자세히 모니터링해야 합니다. GKE Inference Quickstart를 사용하여 이 값을 자동으로 확인할 수 있습니다.