This page describes how to customize GKE Inference Gateway deployment.
This page is for Networking specialists who are responsible for managing GKE infrastructure, and for platform administrators who manage AI workloads.
To manage and optimize inference workloads, you configure advanced features of GKE Inference Gateway.
Understand and configure the following advanced features:
- To use Model Armor integration, configure AI security and safety checks.
- To enhance GKE Inference Gateway with features like API security, rate limiting, and analytics, configure Apigee for authentication and API management.
- To route requests based on the model name in the request body, configure Body-Based Routing.
- To view metrics and dashboards for GKE Inference Gateway and model servers, and to enable HTTP access logging, configure observability.
- To automatically scale your GKE Inference Gateway deployments, configure autoscaling.
Configure AI security and safety checks
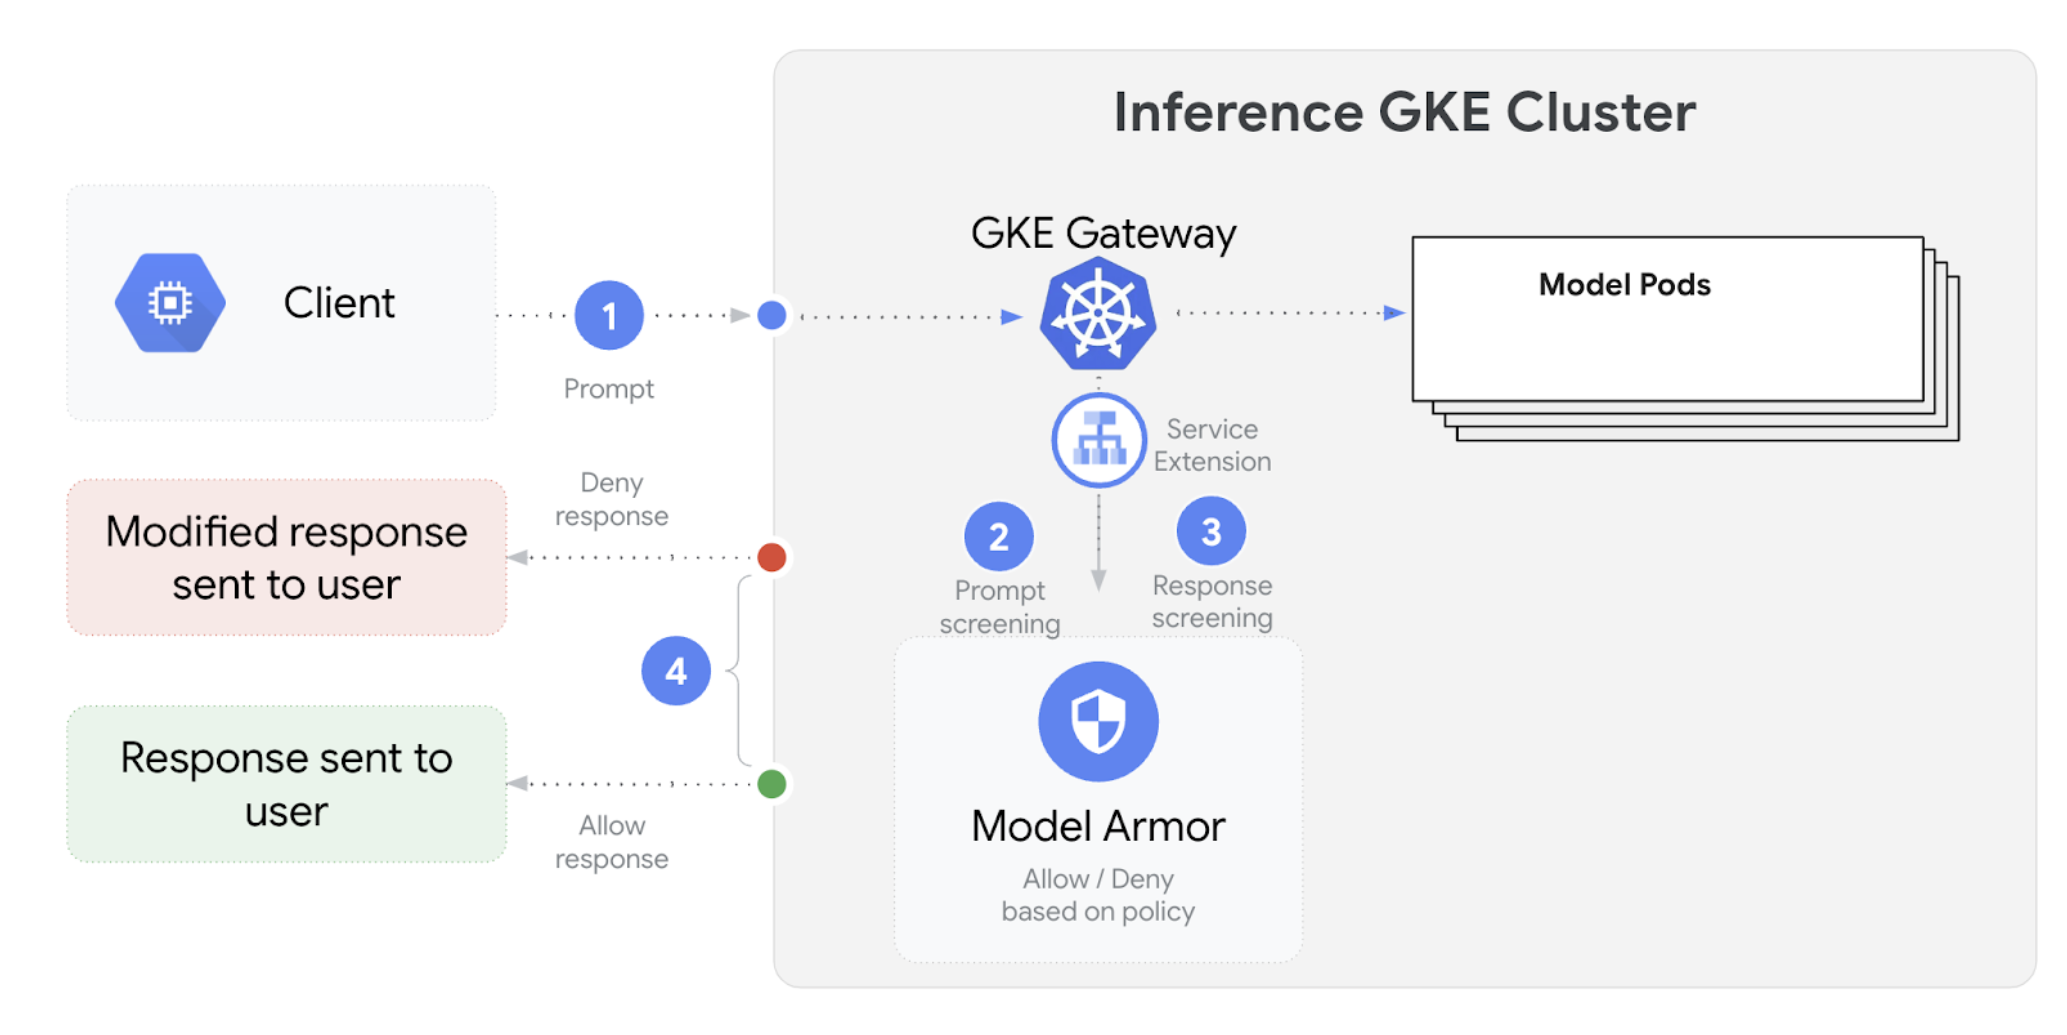
GKE Inference Gateway integrates with Model Armor to perform safety checks on prompts and responses for applications that use large language models (LLMs). This integration provides an additional layer of safety enforcement at the infrastructure level that complements application-level safety measures. This enables centralized policy application across all LLM traffic. You can also use NVIDIA NeMo Guardrails for safety checks.
The following diagram illustrates Model Armor integration with GKE Inference Gateway on a GKE cluster:
To configure AI safety checks, perform the following steps:
Prerequisites
- Enable the Model Armor service in your Google Cloud project.
Create the Model Armor templates using the Model Armor console, Google Cloud CLI, or API. The following command creates a template named
llmthat logs operations and filters for harmful content.# Set environment variables PROJECT_ID=$(gcloud config get-value project) # Replace <var>CLUSTER_LOCATION<var> with the location of your GKE cluster. For example, `us-central1`. LOCATION="CLUSTER_LOCATION" MODEL_ARMOR_TEMPLATE_NAME=llm # Set the regional API endpoint gcloud config set api_endpoint_overrides/modelarmor \ "https://modelarmor.$LOCATION.rep.googleapis.com/" # Create the template gcloud model-armor templates create $MODEL_ARMOR_TEMPLATE_NAME \ --location $LOCATION \ --pi-and-jailbreak-filter-settings-enforcement=enabled \ --pi-and-jailbreak-filter-settings-confidence-level=MEDIUM_AND_ABOVE \ --rai-settings-filters='[{ "filterType": "HATE_SPEECH", "confidenceLevel": "MEDIUM_AND_ABOVE" },{ "filterType": "DANGEROUS", "confidenceLevel": "MEDIUM_AND_ABOVE" },{ "filterType": "HARASSMENT", "confidenceLevel": "MEDIUM_AND_ABOVE" },{ "filterType": "SEXUALLY_EXPLICIT", "confidenceLevel": "MEDIUM_AND_ABOVE" }]' \ --template-metadata-log-sanitize-operations \ --template-metadata-log-operations
Grant IAM permissions
The Service Extensions service account requires permissions to access the necessary resources. Grant the required roles by running the following commands:
PROJECT_NUMBER=$(gcloud projects describe $PROJECT_ID --format 'get(projectNumber)')

gcloud projects add-iam-policy-binding $PROJECT_ID \
    --member=serviceAccount:service-$PROJECT_NUMBER@gcp-sa-dep.iam.gserviceaccount.com \
    --role=roles/container.admin

gcloud projects add-iam-policy-binding $PROJECT_ID \
    --member=serviceAccount:service-$PROJECT_NUMBER@gcp-sa-dep.iam.gserviceaccount.com \
    --role=roles/modelarmor.calloutUser

gcloud projects add-iam-policy-binding $PROJECT_ID \
    --member=serviceAccount:service-$PROJECT_NUMBER@gcp-sa-dep.iam.gserviceaccount.com \
    --role=roles/serviceusage.serviceUsageConsumer

gcloud projects add-iam-policy-binding $PROJECT_ID \
    --member=serviceAccount:service-$PROJECT_NUMBER@gcp-sa-dep.iam.gserviceaccount.com \
    --role=roles/modelarmor.user
Configure the
GCPTrafficExtensionTo apply the Model Armor policies to your Gateway, create a
GCPTrafficExtensionresource with the correct metadata format.Save the following sample manifest as
gcp-traffic-extension.yaml:kind: GCPTrafficExtension apiVersion: networking.gke.io/v1 metadata: name: my-model-armor-extension spec: targetRefs: - group: "gateway.networking.k8s.io" kind: Gateway name: GATEWAY_NAME extensionChains: - name: my-model-armor-chain1 matchCondition: celExpressions: - celMatcher: request.path.startsWith("/") extensions: - name: my-model-armor-service supportedEvents: - RequestHeaders - RequestBody - RequestTrailers - ResponseHeaders - ResponseBody - ResponseTrailers timeout: 1s failOpen: false googleAPIServiceName: "modelarmor.${LOCATION}.rep.googleapis.com" metadata: model_armor_settings: '[{"model": "${MODEL}","model_response_template_id": "projects/${PROJECT_ID}/locations/${LOCATION}/templates/${MODEL_ARMOR_TEMPLATE_NAME}","user_prompt_template_id": "projects/${PROJECT_ID}/locations/${LOCATION}/templates/${MODEL_ARMOR_TEMPLATE_NAME}"}]'Replace the following:
GATEWAY_NAME: the name of the Gateway.MODEL_ARMOR_TEMPLATE_NAME: the name of your Model Armor template.
The
gcp-traffic-extension.yamlfile includes the following settings:targetRefs: specifies the Gateway to which this extension applies.extensionChains: defines a chain of extensions to be applied to the traffic.matchCondition: defines the conditions under which the extensions are applied.extensions: defines the extensions to be applied.supportedEvents: specifies the events during which the extension is invoked.timeout: specifies the timeout for the extension.googleAPIServiceName: specifies the service name for the extension.metadata: specifies the metadata for the extension, including theextensionPolicyand prompt or response sanitization settings.
Apply the sample manifest to your cluster:
export GATEWAY_NAME="your-gateway-name"
export MODEL="google/gemma-3-1b-it" # Or your specific model
envsubst < gcp-traffic-extension.yaml | kubectl apply -f -
After you configure the AI safety checks and integrate them with your Gateway, Model Armor automatically filters prompts and responses based on the defined rules.
Configure Apigee for authentication and API management
GKE Inference Gateway integrates with Apigee to provide authentication, authorization, and API management for your inference workloads. To learn more about the benefits of using Apigee, see Key benefits of using Apigee.
You can integrate GKE Inference Gateway with Apigee to enhance your GKE Inference Gateway with features such as API security, rate limiting, quotas, analytics, and monetization.
Prerequisites
Before you begin, ensure you have the following:
- A GKE cluster running version 1.34.* or later.
- A GKE cluster with GKE Inference Gateway deployed.
- An Apigee instance created in the same region as your GKE cluster.
- The Apigee APIM Operator and its CRDs installed in your GKE cluster. For instructions, see Install the Apigee APIM operator.
kubectlconfigured to connect to your GKE cluster.Google Cloud CLIinstalled and authenticated.
Create an ApigeeBackendService
First, create an ApigeeBackendService resource. GKE Inference Gateway uses this
to create an Apigee Extension Processor.
Save the following manifest as
my-apigee-backend-service.yaml:apiVersion: apim.googleapis.com/v1 kind: ApigeeBackendService metadata: name: my-apigee-backend-service spec: apigeeEnv: "APIGEE_ENVIRONMENT_NAME" # optional field defaultSecurityEnabled: true # optional field locations: name: "LOCATION" network: "CLUSTER_NETWORK" subnetwork: "CLUSTER_SUBNETWORK"Replace the following:
APIGEE_ENVIRONMENT_NAME: The name of your Apigee environment. Note: You don't need to set this field if theapigee-apim-operatoris installed with thegenerateEnv=TRUEflag. If not, create an Apigee environment by following the instructions in Create an environment.LOCATION: The location of your Apigee instance.CLUSTER_NETWORK: The network of your GKE cluster.CLUSTER_SUBNETWORK: The subnetwork of your GKE cluster.
Apply the manifest to your cluster:
kubectl apply -f my-apigee-backend-service.yamlVerify that the status has become
CREATED:kubectl wait --for=jsonpath='{.status.currentState}'="CREATED" -f my-apigee-backend-service.yaml --timeout=5m
Configure GKE Inference Gateway
Configure GKE Inference Gateway to enable the Apigee Extension Processor as a load balancer traffic extension.
Save the following manifest as
my-apigee-traffic-extension.yaml:kind: GCPTrafficExtension apiVersion: networking.gke.io/v1 metadata: name: my-apigee-traffic-extension spec: targetRefs: - group: "gateway.networking.k8s.io" kind: Gateway name: GATEWAY_NAME extensionChains: - name: my-traffic-extension-chain matchCondition: celExpressions: - celMatcher: request.path.startsWith("/") extensions: - name: my-apigee-extension metadata: # The value for `apigee-extension-processor` must match the name of the `ApigeeBackendService` resource that was applied earlier. apigee-extension-processor: my-apigee-backend-service failOpen: false timeout: 1s supportedEvents: - RequestHeaders - ResponseHeaders - ResponseBody backendRef: group: apim.googleapis.com kind: ApigeeBackendService name: my-apigee-backend-service port: 443Replace
GATEWAY_NAMEwith the name of your Gateway.Apply the manifest to your cluster:
kubectl apply -f my-apigee-traffic-extension.yamlWait for the
GCPTrafficExtensionstatus to becomeProgrammed:kubectl wait --for=jsonpath='{.status.ancestors[0].conditions[?(@.type=="Programmed")].status}'=True -f my-apigee-traffic-extension.yaml --timeout=5m
Send Authenticated Requests using API keys
To find the IP address of your GKE Inference Gateway, inspect the Gateway status:
GW_IP=$(kubectl get gateway/GATEWAY_NAME -o jsonpath='{.status.addresses[0].value}')Replace
GATEWAY_NAMEwith the name of your Gateway.Test a request without authentication. This request should be rejected:
curl -i ${GW_IP}/v1/completions -H 'Content-Type: application/json' -d '{
"model": "food-review",
"prompt": "Write as if you were a critic: San Francisco",
"max_tokens": 100,
"temperature": 0
}'
You will see a response similar to the following, indicating that the Apigee extension is working:
{"fault":{"faultstring":"Raising fault. Fault name : RF-insufficient-request-raise-fault","detail":{"errorcode":"steps.raisefault.RaiseFault"}}}Access the Apigee UI and create an API key. For instructions, see Create an API key.
Send the API Key in the HTTP request header:
curl -i ${GW_IP}/v1/completions -H 'Content-Type: application/json' -H 'x-api-key: API_KEY' -d '{
"model": "food-review",
"prompt": "Write as if you were a critic: San Francisco",
"max_tokens": 100,
"temperature": 0
}'
Replace
API_KEYwith your API key.
For more detailed information on configuring Apigee policies, see Use API management policies with the Apigee APIM Operator for Kubernetes.
Configure observability
GKE Inference Gateway provides insights into the health, performance, and behavior of your inference workloads. This helps you to identify and resolve issues, optimize resource utilization, and ensure the reliability of your applications.
Google Cloud provides the following Cloud Monitoring dashboards that offer inference observability for GKE Inference Gateway:
- GKE Inference Gateway dashboard:
provides golden metrics for LLM serving, such as request
and token throughput, latency, errors, and cache utilization for the
InferencePool. To see the complete list of available GKE Inference Gateway metrics, see Exposed metrics. - AI/ML observability dashboards: provides dashboards for infrastructure usage, DCGM metrics, and vLLM model performance metrics.
- Model server dashboard: provides a
dashboard for golden signals of model server. This lets you monitor the load and performance of the model servers, such as
KVCache UtilizationandQueue length. - Load balancer dashboard: reports metrics from the load balancer, such as requests per second, end-to-end request serving latency, and request-response status codes. These metrics help you understand the performance of end-to-end request serving and identify errors.
- Data Center GPU Manager (DCGM) metrics: provides DCGM metrics, such as the performance and utilization of NVIDIA GPUs. You can configure DCGM metrics in Cloud Monitoring. For more information, see Collect and view DCGM metrics.
View GKE Inference Gateway dashboard
To view GKE Inference Gateway dashboard, perform the following steps:
In the Google Cloud console, go to the Monitoring page.
In the navigation pane, select Dashboards.
In the Integrations section, select GMP.
In the Cloud Monitoring Dashboard Templates page, search for "Gateway".
View GKE Inference Gateway dashboard.
Alternately, you can follow the instructions in Monitoring dashboard.
View AI/ML models observability dashboards
To view your deployed models and dashboards for observability metrics of a model, follow these steps:
In the Google Cloud console, go to the Deployed Models page.
To view details about a specific deployment, including its metrics, logs, and dashboards, click the model name in the list.
In the model details page, click the Observability tab to view the following dashboards. If prompted, click Enable to enable the dashboard.
- The Infrastructure usage dashboard displays utilization metrics.
- The DCGM dashboard displays DCGM metrics.
- If you are using vLLM, then the Model performance dashboard is available and displays metrics for the vLLM model performance.
Configure model server observability dashboard
To collect golden signals from each model server and understand what contributes to GKE Inference Gateway performance, you can configure auto-monitoring for your model servers. This includes model servers such as the following:
To view the integration dashboards, first ensure you are collecting metrics from your model server. Then, perform the following steps:
In the Google Cloud console, go to the Monitoring page.
In the navigation pane, select Dashboards.
Under Integrations, select GMP. The corresponding integration dashboards are displayed.
Figure: Integration dashboards
For more information, see Customize monitoring for applications.
Configure the Cloud Monitoring alerts
To configure Cloud Monitoring alerts for GKE Inference Gateway, perform the following steps:
Save the following sample manifest as
alerts.yamland modify the thresholds as needed:groups: - name: gateway-api-inference-extension rules: - alert: HighInferenceRequestLatencyP99 annotations: title: 'High latency (P99) for model {{ $labels.model_name }}' description: 'The 99th percentile request duration for model {{ $labels.model_name }} and target model {{ $labels.target_model_name }} has been consistently above 10.0 seconds for 5 minutes.' expr: histogram_quantile(0.99, rate(inference_model_request_duration_seconds_bucket[5m])) > 10.0 for: 5m labels: severity: 'warning' - alert: HighInferenceErrorRate annotations: title: 'High error rate for model {{ $labels.model_name }}' description: 'The error rate for model {{ $labels.model_name }} and target model {{ $labels.target_model_name }} has been consistently above 5% for 5 minutes.' expr: sum by (model_name) (rate(inference_model_request_error_total[5m])) / sum by (model_name) (rate(inference_model_request_total[5m])) > 0.05 for: 5m labels: severity: 'critical' impact: 'availability' - alert: HighInferencePoolAvgQueueSize annotations: title: 'High average queue size for inference pool {{ $labels.name }}' description: 'The average number of requests pending in the queue for inference pool {{ $labels.name }} has been consistently above 50 for 5 minutes.' expr: inference_pool_average_queue_size > 50 for: 5m labels: severity: 'critical' impact: 'performance' - alert: HighInferencePoolAvgKVCacheUtilization annotations: title: 'High KV cache utilization for inference pool {{ $labels.name }}' description: 'The average KV cache utilization for inference pool {{ $labels.name }} has been consistently above 90% for 5 minutes, indicating potential resource exhaustion.' expr: inference_pool_average_kv_cache_utilization > 0.9 for: 5m labels: severity: 'critical' impact: 'resource_exhaustion'To create alerting policies, run the following command:
gcloud alpha monitoring policies migrate --policies-from-prometheus-alert-rules-yaml=alerts.yamlYou see new alert policies in the Alerting page.
Modify alerts
You can find complete list of latest metrics available in the kubernetes-sigs/gateway-api-inference-extension GitHub repository, and you can append new alerts to the manifest by using other metrics.
To modify the sample alerts, consider the following example:
  - alert: HighInferenceRequestLatencyP99
    annotations:
      title: 'High latency (P99) for model {{ $labels.model_name }}'
      description: 'The 99th percentile request duration for model {{ $labels.model_name }} and target model {{ $labels.target_model_name }} has been consistently above 10.0 seconds for 5 minutes.'
    expr: histogram_quantile(0.99, rate(inference_model_request_duration_seconds_bucket[5m])) > 10.0
    for: 5m
    labels:
      severity: 'warning'
This alert fires if the 99th percentile of the request duration over 5 minutes
exceeds 10 seconds. You can modify the expr section of the alert to adjust the
threshold based on your requirements.
Configure logging for GKE Inference Gateway
Configuring logging for GKE Inference Gateway provides detailed information about requests and responses, which is useful for troubleshooting, auditing, and performance analysis. HTTP access logs record every request and response, including headers, status codes, and timestamps. This level of detail can help you identify issues, find errors, and understand the behavior of your inference workloads.
To configure logging for GKE Inference Gateway, enable HTTP access logging for each of your InferencePool objects.
Save the following sample manifest as
logging-backend-policy.yaml:apiVersion: networking.gke.io/v1 kind: GCPBackendPolicy metadata: name: logging-backend-policy namespace: NAMESPACE_NAME spec: default: logging: enabled: true sampleRate: 500000 targetRef: group: inference.networking.x-k8s.io kind: InferencePool name: INFERENCE_POOL_NAMEReplace the following:
NAMESPACE_NAME: the name of the namespace where yourInferencePoolis deployed.INFERENCE_POOL_NAME: the name of theInferencePool.
Apply the sample manifest to your cluster:
kubectl apply -f logging-backend-policy.yaml
After you apply this manifest, GKE Inference Gateway enables HTTP
access logs for the specified InferencePool. You can view these logs in
Cloud Logging. The logs include detailed information about each request and
response, such as the request URL, headers, response status code, and latency.
Create logs-based metrics to view error details
You can use logs-based metrics to analyze your load balancing logs and extract
error details. Each GKE Gateway class, such as the
gke-l7-global-external-managed and gke-l7-regional-internal-managed
Gateway classes, is backed by a different load balancer. For more
information, see GatewayClass
capabilities.
Each load balancer has a different monitored resource that you must use when you create a logs-based metric. For more information about the monitored resource for each load balancer, see the following:
- For regional external load balancers: Logs-based metrics for external HTTP(S) load balancers
- For internal load balancers: Logs-based metrics for internal HTTP(S) load balancers
To create a logs-based metric to view error details, do the following:
Create a JSON file named
error_detail_metric.jsonwith the followingLogMetricdefinition. This configuration creates a metric that extracts theproxyStatusfield from your load balancer logs.{ "description": "Metric to extract error details from load balancer logs.", "filter": "resource.type=\"MONITORED_RESOURCE\"", "metricDescriptor": { "metricKind": "DELTA", "valueType": "INT64", "labels": [ { "key": "error_detail", "valueType": "STRING", "description": "The detailed error string from the load balancer." } ] }, "labelExtractors": { "error_detail": "EXTRACT(jsonPayload.proxyStatus)" } }Replace
MONITORED_RESOURCEwith the monitored resource for your load balancer.Open Cloud Shell or your local terminal where the gcloud CLI is installed.
To create the metric, run the
gcloud logging metrics createcommand with the--config-from-fileflag:gcloud logging metrics create error_detail_metric \ --config-from-file=error_detail_metric.json
After the metric is created, you can use it in Cloud Monitoring to view the distribution of errors reported by the load balancer. For more information, see Create a logs-based metric.
For more information about creating alerts from logs-based metrics, see Create an alerting policy on a counter metric.
Configure autoscaling
Autoscaling adjusts resource allocation in response to load variations,
maintaining performance and resource efficiency by dynamically adding or
removing Pods based on demand. For GKE Inference Gateway, this involves
horizontal autoscaling of Pods in each InferencePool. The GKE
Horizontal Pod Autoscaler (HPA) autoscales Pods based on model-server metrics
such as KVCache Utilization. This ensures the inference service handles
different workloads and query volumes while efficiently managing resource usage.
To configure InferencePool instances so they autoscale based on metrics produced by GKE Inference Gateway, perform the following steps:
Deploy a
PodMonitoringobject in the cluster to collect metrics produced by GKE Inference Gateway. For more information, see Configure observability.Deploy the Custom Metrics Stackdriver Adapter to give HPA access to the metrics:
Save the following sample manifest as
adapter_new_resource_model.yaml:apiVersion: v1 kind: Namespace metadata: name: custom-metrics --- apiVersion: v1 kind: ServiceAccount metadata: name: custom-metrics-stackdriver-adapter namespace: custom-metrics --- apiVersion: rbac.authorization.k8s.io/v1 kind: ClusterRoleBinding metadata: name: custom-metrics:system:auth-delegator roleRef: apiGroup: rbac.authorization.k8s.io kind: ClusterRole name: system:auth-delegator subjects: - kind: ServiceAccount name: custom-metrics-stackdriver-adapter namespace: custom-metrics --- apiVersion: rbac.authorization.k8s.io/v1 kind: RoleBinding metadata: name: custom-metrics-auth-reader namespace: kube-system roleRef: apiGroup: rbac.authorization.k8s.io kind: Role name: extension-apiserver-authentication-reader subjects: - kind: ServiceAccount name: custom-metrics-stackdriver-adapter namespace: custom-metrics --- apiVersion: rbac.authorization.k8s.io/v1 kind: ClusterRole metadata: name: custom-metrics-resource-reader rules: - apiGroups: - "" resources: - pods - nodes - nodes/stats verbs: - get - list - watch --- apiVersion: rbac.authorization.k8s.io/v1 kind: ClusterRoleBinding metadata: name: custom-metrics-resource-reader roleRef: apiGroup: rbac.authorization.k8s.io kind: ClusterRole name: custom-metrics-resource-reader subjects: - kind: ServiceAccount name: custom-metrics-stackdriver-adapter namespace: custom-metrics --- apiVersion: apps/v1 kind: Deployment metadata: name: custom-metrics-stackdriver-adapter labels: run: custom-metrics-stackdriver-adapter k8s-app: custom-metrics-stackdriver-adapter spec: replicas: 1 selector: matchLabels: run: custom-metrics-stackdriver-adapter k8s-app: custom-metrics-stackdriver-adapter template: metadata: labels: run: custom-metrics-stackdriver-adapter k8s-app: custom-metrics-stackdriver-adapter kubernetes.io/cluster-service: "true" spec: serviceAccountName: custom-metrics-stackdriver-adapter containers: - image: gcr.io/gke-release/custom-metrics-stackdriver-adapter:v0.15.2-gke.1 imagePullPolicy: Always name: pod-custom-metrics-stackdriver-adapter command: - /adapter - --use-new-resource-model=true - --fallback-for-container-metrics=true resources: limits: cpu: 250m memory: 200Mi requests: cpu: 250m memory: 200Mi --- apiVersion: v1 kind: Service metadata: labels: run: custom-metrics-stackdriver-adapter k8s-app: custom-metrics-stackdriver-adapter kubernetes.io/cluster-service: 'true' kubernetes.io/name: Adapter name: custom-metrics-stackdriver-adapter namespace: custom-metrics spec: ports: - port: 443 protocol: TCP targetPort: 443 selector: run: custom-metrics-stackdriver-adapter k8s-app: custom-metrics-stackdriver-adapter type: ClusterIP --- apiVersion: apiregistration.k8s.io/v1 kind: APIService metadata: name: v1beta1.custom.metrics.k8s.io spec: insecureSkipTLSVerify: true group: custom.metrics.k8s.io groupPriorityMinimum: 100 versionPriority: 100 service: name: custom-metrics-stackdriver-adapter namespace: custom-metrics version: v1beta1 --- apiVersion: apiregistration.k8s.io/v1 kind: APIService metadata: name: v1beta2.custom.metrics.k8s.io spec: insecureSkipTLSVerify: true group: custom.metrics.k8s.io groupPriorityMinimum: 100 versionPriority: 200 service: name: custom-metrics-stackdriver-adapter namespace: custom-metrics version: v1beta2 --- apiVersion: apiregistration.k8s.io/v1 kind: APIService metadata: name: v1beta1.external.metrics.k8s.io spec: insecureSkipTLSVerify: true group: external.metrics.k8s.io groupPriorityMinimum: 100 versionPriority: 100 service: name: custom-metrics-stackdriver-adapter namespace: custom-metrics version: v1beta1 --- apiVersion: rbac.authorization.k8s.io/v1 kind: ClusterRole metadata: name: external-metrics-reader rules: - apiGroups: - "external.metrics.k8s.io" resources: - "*" verbs: - list - get - watch --- apiVersion: rbac.authorization.k8s.io/v1 kind: ClusterRoleBinding metadata: name: external-metrics-reader roleRef: apiGroup: rbac.authorization.k8s.io kind: ClusterRole name: external-metrics-reader subjects: - kind: ServiceAccount name: horizontal-pod-autoscaler namespace: kube-systemApply the sample manifest to your cluster:
kubectl apply -f adapter_new_resource_model.yaml
To give adapter permissions to read metrics from the project, run the following command:
$ PROJECT_ID=PROJECT_ID
$ PROJECT_NUMBER=$(gcloud projects describe PROJECT_ID --format="value(projectNumber)")
$ gcloud projects add-iam-policy-binding projects/PROJECT_ID \
  --role roles/monitoring.viewer \
  --member=principal://iam.googleapis.com/projects/PROJECT_NUMBER/locations/global/workloadIdentityPools/$PROJECT_ID.svc.id.goog/subject/ns/custom-metrics/sa/custom-metrics-stackdriver-adapter
Replace
PROJECT_IDwith your Google Cloud project ID.For each
InferencePool, deploy one HPA that is similar to the following:apiVersion: autoscaling/v2 kind: HorizontalPodAutoscaler metadata: name: INFERENCE_POOL_NAME namespace: INFERENCE_POOL_NAMESPACE spec: scaleTargetRef: apiVersion: apps/v1 kind: Deployment name: INFERENCE_POOL_NAME minReplicas: MIN_REPLICAS maxReplicas: MAX_REPLICAS metrics: - type: External external: metric: name: prometheus.googleapis.com|inference_pool_average_kv_cache_utilization|gauge selector: matchLabels: metric.labels.name: INFERENCE_POOL_NAME resource.labels.cluster: CLUSTER_NAME resource.labels.namespace: INFERENCE_POOL_NAMESPACE target: type: AverageValue averageValue: TARGET_VALUEReplace the following:
INFERENCE_POOL_NAME: the name of theInferencePool.INFERENCE_POOL_NAMESPACE: the namespace of theInferencePool.CLUSTER_NAME: the name of the cluster.MIN_REPLICAS: the minimum availability of theInferencePool(baseline capacity). HPA keeps this number of replicas up when usage is below the HPA target threshold. Highly available workloads must set this to a value higher than1to ensure continued availability during Pod disruptions.MAX_REPLICAS: the value that constrains the number of accelerators that must be assigned to the workloads hosted in theInferencePool. HPA won't increase the number of replicas beyond this value. During peak traffic times, monitor the number of replicas to ensure that the value of theMAX_REPLICASfield provides enough headroom so the workload can scale up to maintain the chosen workload performance characteristics.TARGET_VALUE: the value that represents the chosen targetKV-Cache Utilizationper model server. This is a number between 0-100 and is highly dependent on the model server, model, accelerator, and incoming traffic characteristics. You can determine this target value experimentally through load testing and plotting a throughput versus latency graph. Select a chosen throughput and latency combination from the graph, and use the correspondingKV-Cache Utilizationvalue as the HPA target. You must tweak and monitor this value closely to achieve chosen price-performance results. You can use GKE Inference Quickstart to determine this value automatically.
What's next
- Learn about GKE Inference Gateway.
- Deploy GKE Inference Gateway.
- Manage GKE Inference Gateway roll out operations.
- Serve with GKE Inference Gateway.