GKE Inference Gateway の構成をカスタマイズする


このページでは、GKE Inference Gateway のデプロイをカスタマイズする方法について説明します。

このページは、GKE インフラストラクチャの管理を担当するネットワーク スペシャリストと、AI ワークロードを管理するプラットフォーム管理者を対象としています。

推論ワークロードを管理して最適化するには、GKE Inference Gateway の高度な機能を構成します。

次の高度な機能について理解し、構成してください。

AI セキュリティと安全性チェックを構成する

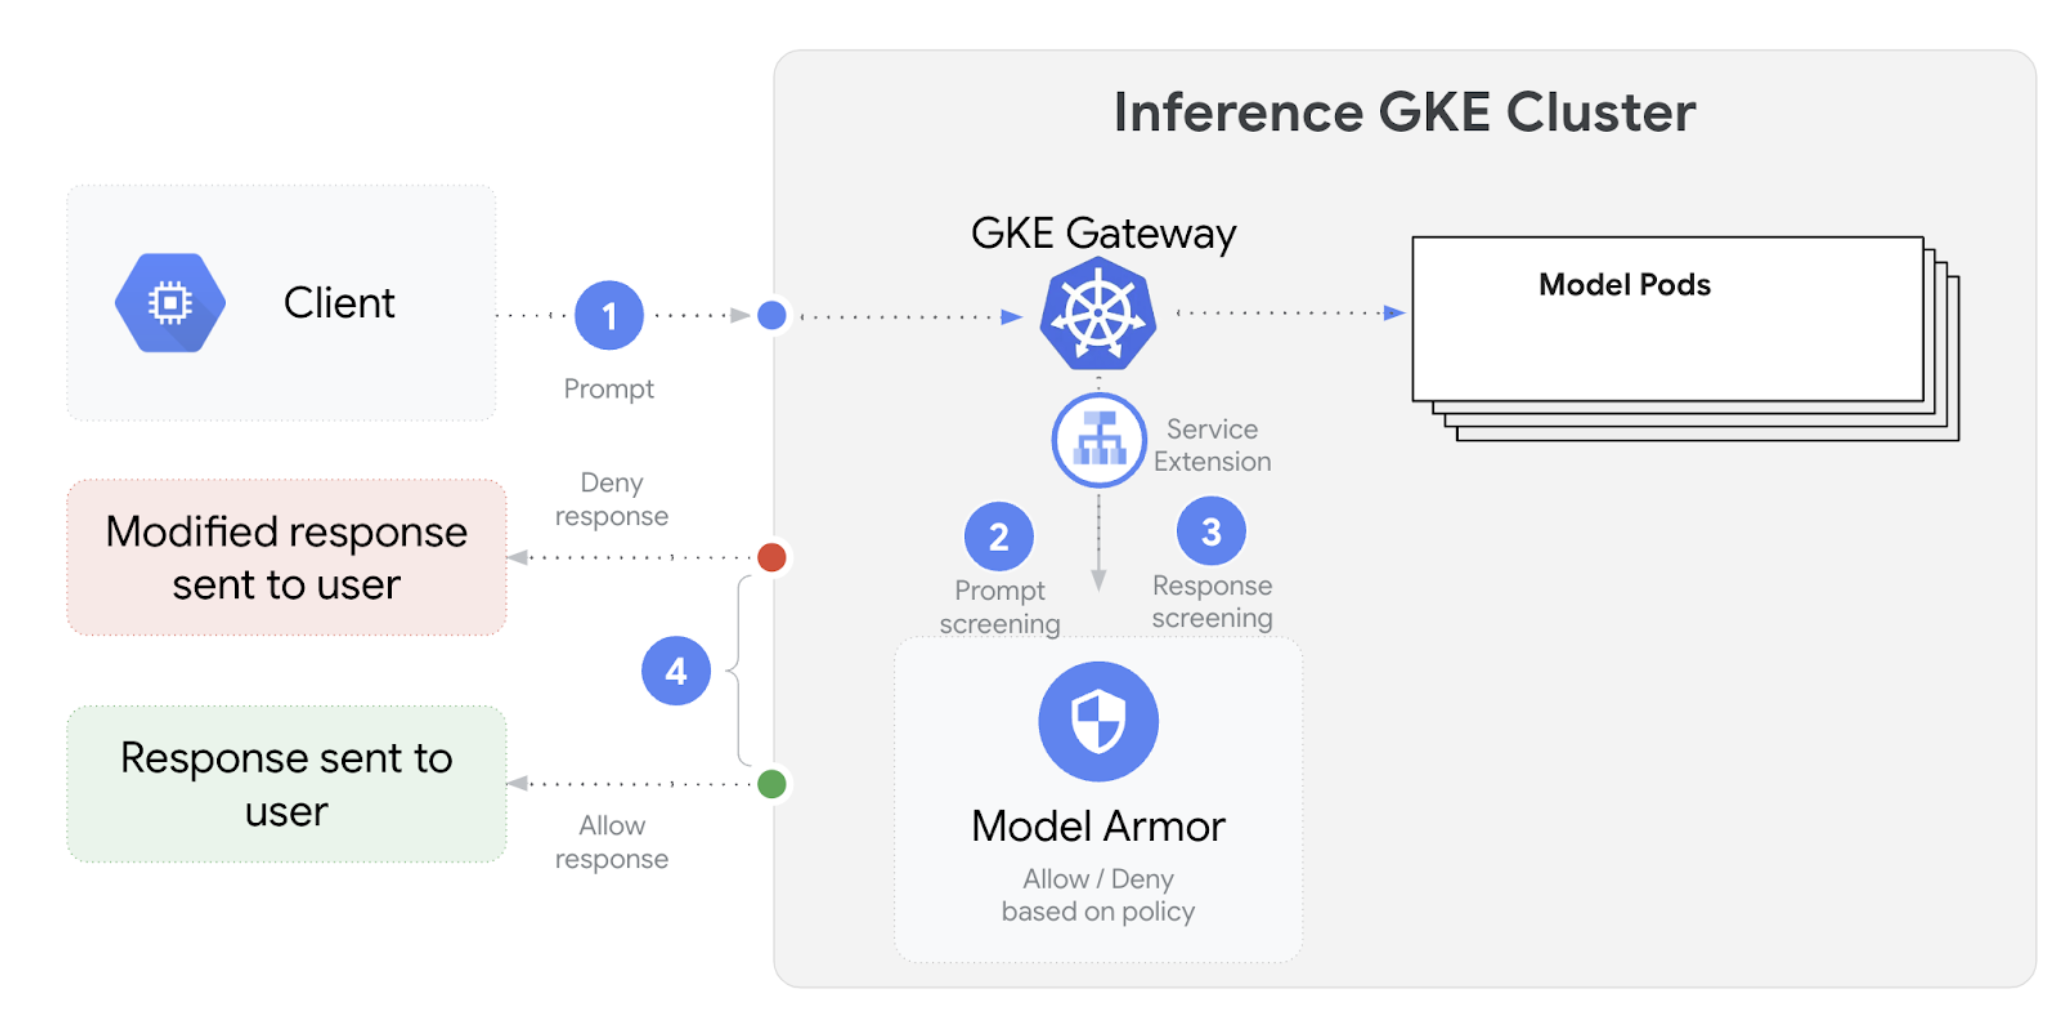
GKE Inference Gateway は Model Armor と統合されており、大規模言語モデル(LLM)を使用するアプリケーションのプロンプトとレスポンスを安全性チェックします。この統合により、アプリケーション レベルの安全対策を補完する、インフラストラクチャ レベルの安全性強化レイヤが追加されます。これにより、すべての LLM トラフィックにポリシーを一元的に適用できます。

次の図は、GKE クラスタの GKE Inference Gateway と Model Armor の統合を示したものです。

GKE クラスタ上での Google Cloud Model Armor の統合
図: GKE クラスタ上での Model Armor の統合

AI 安全性チェックを構成する手順は次のとおりです。

  1. 次の前提条件を満たしていることを確認します。

    1. Google Cloud プロジェクトで Model Armor サービスを有効にします
    2. Model Armor コンソール、Google Cloud CLI、または API を使用して Model Armor テンプレートを作成します。
  2. my-model-armor-template-name-id という名前の Model Armor テンプレートが作成されていることを確認します。

  3. GCPTrafficExtension を構成する手順は次のとおりです。

    1. 次のサンプル マニフェストを gcp-traffic-extension.yaml として保存します。

      kind: GCPTrafficExtension
      apiVersion: networking.gke.io/v1
      metadata:
        name: my-model-armor-extension
      spec:
        targetRefs:
        - group: "gateway.networking.k8s.io"
          kind: Gateway
          name: GATEWAY_NAME
        extensionChains:
        - name: my-model-armor-chain1
          matchCondition:
            celExpressions:
            - celMatcher: request.path.startsWith("/")
          extensions:
          - name: my-model-armor-service
            supportedEvents:
            - RequestHeaders
            timeout: 1s
            googleAPIServiceName: "modelarmor.us-central1.rep.googleapis.com"
            metadata:
              'extensionPolicy': MODEL_ARMOR_TEMPLATE_NAME
              'sanitizeUserPrompt': 'true'
              'sanitizeUserResponse': 'true'
      

      次のように置き換えます。

      • GATEWAY_NAME: Gatewayの名前
      • MODEL_ARMOR_TEMPLATE_NAME: Model Armor テンプレートの名前。

      gcp-traffic-extension.yaml ファイルには次の設定が含まれます。

      • targetRefs: この拡張機能が適用される Gateway を指定します。
      • extensionChains: トラフィックに適用する一連の拡張機能を定義します。
      • matchCondition: 拡張機能が適用される条件を定義します。
      • extensions: 適用する拡張機能を定義します。
      • supportedEvents: 拡張機能が呼び出されるイベントを指定します。
      • timeout: 拡張機能のタイムアウトを指定します。
      • googleAPIServiceName: 拡張機能のサービス名を指定します。
      • metadata: extensionPolicy やプロンプトまたはレスポンスのサニタイズ設定など、拡張機能のメタデータを指定します。
    2. マニフェストをクラスタに適用します。

      kubectl apply -f `gcp-traffic-extension.yaml`
      

AI 安全性チェックを構成して Gateway と統合すると、Model Armor は定義されたルールに基づいてプロンプトとレスポンスを自動的にフィルタします。

オブザーバビリティを構成する

GKE Inference Gateway は、推論ワークロードの健全性、パフォーマンス、動作に関する分析情報を提供します。これは、問題を特定して解決し、リソース使用率を最適化し、アプリケーションの信頼性を保証する上で役立ちます。

Google Cloud では、GKE Inference Gateway の推論オブザーバビリティを提供する次の Cloud Monitoring ダッシュボードをご覧いただけます。

  • GKE Inference Gateway ダッシュボード: LLM 処理に関するゴールデン指標(InferencePool に対するリクエストとトークンのスループット、レイテンシ、エラー、キャッシュ使用率など)を確認できます。使用可能な GKE Inference Gateway の指標の一覧については、公開されている指標をご覧ください。
  • モデルサーバー ダッシュボード: モデルサーバーのゴールデン シグナルのダッシュボードです。このダッシュボードでは、KVCache UtilizationQueue length などのモデルサーバーの負荷とパフォーマンスをモニタリングできます。このダッシュボードでは、モデルサーバーの負荷とパフォーマンスをモニタリングできます。
  • ロードバランサ ダッシュボード: ロードバランサの指標(1 秒あたりのリクエスト数、エンド ツー エンドのリクエスト処理レイテンシ、リクエスト / レスポンスのステータス コードなど)をレポートします。これらの指標は、エンド ツー エンドのリクエスト処理のパフォーマンスを把握し、エラーを特定するのに役立ちます。
  • Data Center GPU Manager(DCGM)指標: NVIDIA GPU のパフォーマンスや使用率など、NVIDIA GPU の指標を確認できます。NVIDIA Data Center GPU Manager(DCGM)指標は、Cloud Monitoring で構成できます。詳細については、DCGM 指標を収集して表示するをご覧ください。

GKE Inference Gateway ダッシュボードを表示する

GKE Inference Gateway ダッシュボードを表示する手順は次のとおりです。

  1. Google Cloud コンソールで、[モニタリング] ページに移動します。

    [モニタリング] に移動

  2. ナビゲーション パネルで [ダッシュボード] を選択します。

  3. [統合] セクションで [GMP] を選択します。

  4. [Cloud Monitoring ダッシュボード テンプレート] ページで、[ゲートウェイ] を検索します。

  5. GKE Inference Gateway ダッシュボードを表示します。

または、モニタリング ダッシュボードの手順に沿って操作することもできます。

モデルサーバーのオブザーバビリティ ダッシュボードを構成する

各モデルサーバーからゴールデン シグナルを収集し、GKE Inference Gateway のパフォーマンスに影響を与えている要因を把握するには、モデルサーバーの自動モニタリングを構成します。これには、次のようなモデルサーバーが含まれます。

統合ダッシュボードを表示する手順は次のとおりです。

  1. モデルサーバーから指標を収集します。
  2. Google Cloud コンソールで、[モニタリング] ページに移動します。

    [モニタリング] に移動

  3. ナビゲーション パネルで [ダッシュボード] を選択します。

  4. [統合] で [GMP] を選択します。該当する統合ダッシュボードが表示されます。

    統合ダッシュボードのビュー
    図: 統合ダッシュボード

詳細については、アプリケーションのモニタリングをカスタマイズするをご覧ください。

ロードバランサのオブザーバビリティ ダッシュボードを構成する

GKE Inference Gateway でアプリケーション ロードバランサを使用するには、次の手順でダッシュボードをインポートします。

  1. ロードバランサ ダッシュボードを作成するには、次のファイルを作成して dashboard.json として保存します。

    
    {
        "displayName": "GKE Inference Gateway (Load Balancer) Prometheus Overview",
        "dashboardFilters": [
          {
            "filterType": "RESOURCE_LABEL",
            "labelKey": "cluster",
            "templateVariable": "",
            "valueType": "STRING"
          },
          {
            "filterType": "RESOURCE_LABEL",
            "labelKey": "location",
            "templateVariable": "",
            "valueType": "STRING"
          },
          {
            "filterType": "RESOURCE_LABEL",
            "labelKey": "namespace",
            "templateVariable": "",
            "valueType": "STRING"
          },
          {
            "filterType": "RESOURCE_LABEL",
            "labelKey": "forwarding_rule_name",
            "templateVariable": "",
            "valueType": "STRING"
          }
        ],
        "labels": {},
        "mosaicLayout": {
          "columns": 48,
          "tiles": [
            {
              "height": 8,
              "width": 48,
              "widget": {
                "title": "",
                "id": "",
                "text": {
                  "content": "### Inferece Gateway Metrics\n\nPlease refer to the [official documentation](https://github.com/kubernetes-sigs/gateway-api-inference-extension/blob/main/site-src/guides/metrics.md) for more details of underlying metrics used in the dashboard.\n\n\n### External Application Load Balancer Metrics\n\nPlease refer to the [pubic page](/load-balancing/docs/metrics) for complete list of External Application Load Balancer metrics.\n\n### Model Server Metrics\n\nYou can redirect to the detail dashboard for model servers under the integration tab",
                  "format": "MARKDOWN",
                  "style": {
                    "backgroundColor": "#FFFFFF",
                    "fontSize": "FS_EXTRA_LARGE",
                    "horizontalAlignment": "H_LEFT",
                    "padding": "P_EXTRA_SMALL",
                    "pointerLocation": "POINTER_LOCATION_UNSPECIFIED",
                    "textColor": "#212121",
                    "verticalAlignment": "V_TOP"
                  }
                }
              }
            },
            {
              "yPos": 8,
              "height": 4,
              "width": 48,
              "widget": {
                "title": "External Application Load Balancer",
                "id": "",
                "sectionHeader": {
                  "dividerBelow": false,
                  "subtitle": ""
                }
              }
            },
            {
              "yPos": 12,
              "height": 15,
              "width": 24,
              "widget": {
                "title": "E2E Request Latency p99 (by code)",
                "id": "",
                "xyChart": {
                  "chartOptions": {
                    "displayHorizontal": false,
                    "mode": "COLOR",
                    "showLegend": false
                  },
                  "dataSets": [
                    {
                      "breakdowns": [],
                      "dimensions": [],
                      "legendTemplate": "",
                      "measures": [],
                      "plotType": "LINE",
                      "targetAxis": "Y1",
                      "timeSeriesQuery": {
                        "outputFullDuration": false,
                        "prometheusQuery": "histogram_quantile(0.99, sum by(le, response_code) (rate(loadbalancing_googleapis_com:https_external_regional_total_latencies_bucket{monitored_resource=\"http_external_regional_lb_rule\",forwarding_rule_name=~\".*inference-gateway.*\"}[1m])))",
                        "unitOverride": "ms"
                      }
                    }
                  ],
                  "thresholds": [],
                  "yAxis": {
                    "label": "",
                    "scale": "LINEAR"
                  }
                }
              }
            },
            {
              "yPos": 12,
              "height": 43,
              "width": 48,
              "widget": {
                "title": "Regional",
                "collapsibleGroup": {
                  "collapsed": false
                },
                "id": ""
              }
            },
            {
              "yPos": 12,
              "xPos": 24,
              "height": 15,
              "width": 24,
              "widget": {
                "title": "E2E Request Latency p95 (by code)",
                "id": "",
                "xyChart": {
                  "chartOptions": {
                    "displayHorizontal": false,
                    "mode": "COLOR",
                    "showLegend": false
                  },
                  "dataSets": [
                    {
                      "breakdowns": [],
                      "dimensions": [],
                      "legendTemplate": "",
                      "measures": [],
                      "plotType": "LINE",
                      "targetAxis": "Y1",
                      "timeSeriesQuery": {
                        "outputFullDuration": false,
                        "prometheusQuery": "histogram_quantile(0.95, sum by(le, response_code) (rate(loadbalancing_googleapis_com:https_external_regional_total_latencies_bucket{monitored_resource=\"http_external_regional_lb_rule\",forwarding_rule_name=~\".*inference-gateway.*\"}[1m])))",
                        "unitOverride": "ms"
                      }
                    }
                  ],
                  "thresholds": [],
                  "yAxis": {
                    "label": "",
                    "scale": "LINEAR"
                  }
                }
              }
            },
            {
              "yPos": 27,
              "height": 15,
              "width": 24,
              "widget": {
                "title": "E2E Request Latency p90 (by code)",
                "id": "",
                "xyChart": {
                  "chartOptions": {
                    "displayHorizontal": false,
                    "mode": "COLOR",
                    "showLegend": false
                  },
                  "dataSets": [
                    {
                      "breakdowns": [],
                      "dimensions": [],
                      "legendTemplate": "",
                      "measures": [],
                      "plotType": "LINE",
                      "targetAxis": "Y1",
                      "timeSeriesQuery": {
                        "outputFullDuration": false,
                        "prometheusQuery": "histogram_quantile(0.90, sum by(le, response_code) (rate(loadbalancing_googleapis_com:https_external_regional_total_latencies_bucket{monitored_resource=\"http_external_regional_lb_rule\",forwarding_rule_name=~\".*inference-gateway.*\"}[1m])))",
                        "unitOverride": "ms"
                      }
                    }
                  ],
                  "thresholds": [],
                  "yAxis": {
                    "label": "",
                    "scale": "LINEAR"
                  }
                }
              }
            },
            {
              "yPos": 27,
              "xPos": 24,
              "height": 15,
              "width": 24,
              "widget": {
                "title": "E2E Request Latency p50 (by code)",
                "id": "",
                "xyChart": {
                  "chartOptions": {
                    "displayHorizontal": false,
                    "mode": "COLOR",
                    "showLegend": false
                  },
                  "dataSets": [
                    {
                      "breakdowns": [],
                      "dimensions": [],
                      "legendTemplate": "",
                      "measures": [],
                      "plotType": "LINE",
                      "targetAxis": "Y1",
                      "timeSeriesQuery": {
                        "outputFullDuration": false,
                        "prometheusQuery": "histogram_quantile(0.50, sum by(le, response_code) (rate(loadbalancing_googleapis_com:https_external_regional_total_latencies_bucket{monitored_resource=\"http_external_regional_lb_rule\",forwarding_rule_name=~\".*inference-gateway.*\"}[1m])))",
                        "unitOverride": "ms"
                      }
                    }
                  ],
                  "thresholds": [],
                  "yAxis": {
                    "label": "",
                    "scale": "LINEAR"
                  }
                }
              }
            },
            {
              "yPos": 42,
              "height": 13,
              "width": 48,
              "widget": {
                "title": "Request /s (by code)",
                "id": "",
                "xyChart": {
                  "chartOptions": {
                    "displayHorizontal": false,
                    "mode": "COLOR",
                    "showLegend": false
                  },
                  "dataSets": [
                    {
                      "breakdowns": [],
                      "dimensions": [],
                      "legendTemplate": "",
                      "measures": [],
                      "plotType": "LINE",
                      "targetAxis": "Y1",
                      "timeSeriesQuery": {
                        "outputFullDuration": false,
                        "prometheusQuery": "sum by (response_code)(rate(loadbalancing_googleapis_com:https_external_regional_request_count{monitored_resource=\"http_external_regional_lb_rule\", forwarding_rule_name=~\".*inference-gateway.*\"}[1m]))",
                        "unitOverride": ""
                      }
                    }
                  ],
                  "thresholds": [],
                  "yAxis": {
                    "label": "",
                    "scale": "LINEAR"
                  }
                }
              }
            },
            {
              "yPos": 55,
              "height": 4,
              "width": 48,
              "widget": {
                "title": "Inference Optimized Gateway",
                "id": "",
                "sectionHeader": {
                  "dividerBelow": false,
                  "subtitle": ""
                }
              }
            },
            {
              "yPos": 59,
              "height": 17,
              "width": 48,
              "widget": {
                "title": "Request Latency",
                "id": "",
                "xyChart": {
                  "chartOptions": {
                    "displayHorizontal": false,
                    "mode": "COLOR",
                    "showLegend": false
                  },
                  "dataSets": [
                    {
                      "breakdowns": [],
                      "dimensions": [],
                      "legendTemplate": "p95",
                      "measures": [],
                      "plotType": "LINE",
                      "targetAxis": "Y1",
                      "timeSeriesQuery": {
                        "outputFullDuration": false,
                        "prometheusQuery": "histogram_quantile(0.95, sum by(le) (rate(inference_model_request_duration_seconds_bucket{}[${__interval}])))",
                        "unitOverride": "s"
                      }
                    },
                    {
                      "breakdowns": [],
                      "dimensions": [],
                      "legendTemplate": "p90",
                      "measures": [],
                      "plotType": "LINE",
                      "targetAxis": "Y1",
                      "timeSeriesQuery": {
                        "outputFullDuration": false,
                        "prometheusQuery": "histogram_quantile(0.9, sum by(le) (rate(inference_model_request_duration_seconds_bucket{}[${__interval}])))",
                        "unitOverride": "s"
                      }
                    },
                    {
                      "breakdowns": [],
                      "dimensions": [],
                      "legendTemplate": "p50",
                      "measures": [],
                      "plotType": "LINE",
                      "targetAxis": "Y1",
                      "timeSeriesQuery": {
                        "outputFullDuration": false,
                        "prometheusQuery": "histogram_quantile(0.5, sum by(le) (rate(inference_model_request_duration_seconds_bucket{}[${__interval}])))",
                        "unitOverride": "s"
                      }
                    }
                  ],
                  "thresholds": [],
                  "yAxis": {
                    "label": "",
                    "scale": "LINEAR"
                  }
                }
              }
            },
            {
              "yPos": 59,
              "height": 65,
              "width": 48,
              "widget": {
                "title": "Inference Model",
                "collapsibleGroup": {
                  "collapsed": false
                },
                "id": ""
              }
            },
            {
              "yPos": 76,
              "height": 16,
              "width": 24,
              "widget": {
                "title": "Request / s",
                "id": "",
                "xyChart": {
                  "chartOptions": {
                    "displayHorizontal": false,
                    "mode": "COLOR",
                    "showLegend": false
                  },
                  "dataSets": [
                    {
                      "breakdowns": [],
                      "dimensions": [],
                      "legendTemplate": "",
                      "measures": [],
                      "plotType": "LINE",
                      "targetAxis": "Y1",
                      "timeSeriesQuery": {
                        "outputFullDuration": false,
                        "prometheusQuery": "sum by(model_name, target_model_name) (rate(inference_model_request_total{}[${__interval}]))",
                        "unitOverride": ""
                      }
                    }
                  ],
                  "thresholds": [],
                  "yAxis": {
                    "label": "",
                    "scale": "LINEAR"
                  }
                }
              }
            },
            {
              "yPos": 76,
              "xPos": 24,
              "height": 16,
              "width": 24,
              "widget": {
                "title": "Request Error / s",
                "id": "",
                "xyChart": {
                  "chartOptions": {
                    "displayHorizontal": false,
                    "mode": "COLOR",
                    "showLegend": false
                  },
                  "dataSets": [
                    {
                      "breakdowns": [],
                      "dimensions": [],
                      "legendTemplate": "",
                      "measures": [],
                      "plotType": "LINE",
                      "targetAxis": "Y1",
                      "timeSeriesQuery": {
                        "outputFullDuration": false,
                        "prometheusQuery": "sum by (error_code,model_name,target_model_name) (rate(inference_model_request_error_total[${__interval}]))",
                        "unitOverride": ""
                      }
                    }
                  ],
                  "thresholds": [],
                  "yAxis": {
                    "label": "",
                    "scale": "LINEAR"
                  }
                }
              }
            },
            {
              "yPos": 92,
              "height": 16,
              "width": 24,
              "widget": {
                "title": "Request Size",
                "id": "",
                "xyChart": {
                  "chartOptions": {
                    "displayHorizontal": false,
                    "mode": "COLOR",
                    "showLegend": false
                  },
                  "dataSets": [
                    {
                      "breakdowns": [],
                      "dimensions": [],
                      "legendTemplate": "p95",
                      "measures": [],
                      "plotType": "LINE",
                      "targetAxis": "Y1",
                      "timeSeriesQuery": {
                        "outputFullDuration": false,
                        "prometheusQuery": "histogram_quantile(0.95, sum by(le) (rate(inference_model_request_sizes_bucket{}[${__interval}])))",
                        "unitOverride": "By"
                      }
                    },
                    {
                      "breakdowns": [],
                      "dimensions": [],
                      "legendTemplate": "p90",
                      "measures": [],
                      "plotType": "LINE",
                      "targetAxis": "Y1",
                      "timeSeriesQuery": {
                        "outputFullDuration": false,
                        "prometheusQuery": "histogram_quantile(0.9, sum by(le) (rate(inference_model_request_sizes_bucket{}[${__interval}])))",
                        "unitOverride": "By"
                      }
                    },
                    {
                      "breakdowns": [],
                      "dimensions": [],
                      "legendTemplate": "p50",
                      "measures": [],
                      "plotType": "LINE",
                      "targetAxis": "Y1",
                      "timeSeriesQuery": {
                        "outputFullDuration": false,
                        "prometheusQuery": "histogram_quantile(0.5, sum by(le) (rate(inference_model_request_sizes_bucket{}[${__interval}])))",
                        "unitOverride": "By"
                      }
                    }
                  ],
                  "thresholds": [],
                  "yAxis": {
                    "label": "",
                    "scale": "LINEAR"
                  }
                }
              }
            },
            {
              "yPos": 92,
              "xPos": 24,
              "height": 16,
              "width": 24,
              "widget": {
                "title": "Response Size",
                "id": "",
                "xyChart": {
                  "chartOptions": {
                    "displayHorizontal": false,
                    "mode": "COLOR",
                    "showLegend": false
                  },
                  "dataSets": [
                    {
                      "breakdowns": [],
                      "dimensions": [],
                      "legendTemplate": "p95",
                      "measures": [],
                      "plotType": "LINE",
                      "targetAxis": "Y1",
                      "timeSeriesQuery": {
                        "outputFullDuration": false,
                        "prometheusQuery": "histogram_quantile(0.95, sum by(le) (rate(inference_model_response_sizes_bucket{}[${__interval}])))",
                        "unitOverride": "By"
                      }
                    },
                    {
                      "breakdowns": [],
                      "dimensions": [],
                      "legendTemplate": "p90",
                      "measures": [],
                      "plotType": "LINE",
                      "targetAxis": "Y1",
                      "timeSeriesQuery": {
                        "outputFullDuration": false,
                        "prometheusQuery": "histogram_quantile(0.9, sum by(le) (rate(inference_model_response_sizes_bucket{}[${__interval}])))",
                        "unitOverride": "By"
                      }
                    },
                    {
                      "breakdowns": [],
                      "dimensions": [],
                      "legendTemplate": "p50",
                      "measures": [],
                      "plotType": "LINE",
                      "targetAxis": "Y1",
                      "timeSeriesQuery": {
                        "outputFullDuration": false,
                        "prometheusQuery": "histogram_quantile(0.5, sum by(le) (rate(inference_model_response_sizes_bucket{}[${__interval}])))",
                        "unitOverride": "By"
                      }
                    }
                  ],
                  "thresholds": [],
                  "yAxis": {
                    "label": "",
                    "scale": "LINEAR"
                  }
                }
              }
            },
            {
              "yPos": 108,
              "height": 16,
              "width": 24,
              "widget": {
                "title": "Input Token Count",
                "id": "",
                "xyChart": {
                  "chartOptions": {
                    "displayHorizontal": false,
                    "mode": "COLOR",
                    "showLegend": false
                  },
                  "dataSets": [
                    {
                      "breakdowns": [],
                      "dimensions": [],
                      "legendTemplate": "p95",
                      "measures": [],
                      "plotType": "LINE",
                      "targetAxis": "Y1",
                      "timeSeriesQuery": {
                        "outputFullDuration": false,
                        "prometheusQuery": "histogram_quantile(0.95, sum by(le) (rate(inference_model_input_tokens_bucket{}[${__interval}])))",
                        "unitOverride": ""
                      }
                    },
                    {
                      "breakdowns": [],
                      "dimensions": [],
                      "legendTemplate": "p90",
                      "measures": [],
                      "plotType": "LINE",
                      "targetAxis": "Y1",
                      "timeSeriesQuery": {
                        "outputFullDuration": false,
                        "prometheusQuery": "histogram_quantile(0.9, sum by(le) (rate(inference_model_input_tokens_bucket{}[${__interval}])))",
                        "unitOverride": ""
                      }
                    },
                    {
                      "breakdowns": [],
                      "dimensions": [],
                      "legendTemplate": "p50",
                      "measures": [],
                      "plotType": "LINE",
                      "targetAxis": "Y1",
                      "timeSeriesQuery": {
                        "outputFullDuration": false,
                        "prometheusQuery": "histogram_quantile(0.5, sum by(le) (rate(inference_model_input_tokens_bucket{}[${__interval}])))",
                        "unitOverride": ""
                      }
                    }
                  ],
                  "thresholds": []
                }
              }
            },
            {
              "yPos": 108,
              "xPos": 24,
              "height": 16,
              "width": 24,
              "widget": {
                "title": "Output Token Count",
                "id": "",
                "xyChart": {
                  "chartOptions": {
                    "displayHorizontal": false,
                    "mode": "COLOR",
                    "showLegend": false
                  },
                  "dataSets": [
                    {
                      "breakdowns": [],
                      "dimensions": [],
                      "legendTemplate": "p95",
                      "measures": [],
                      "plotType": "LINE",
                      "targetAxis": "Y1",
                      "timeSeriesQuery": {
                        "outputFullDuration": false,
                        "prometheusQuery": "histogram_quantile(0.95, sum by(le) (rate(inference_model_output_tokens_bucket{}[${__interval}])))",
                        "unitOverride": ""
                      }
                    },
                    {
                      "breakdowns": [],
                      "dimensions": [],
                      "legendTemplate": "p90",
                      "measures": [],
                      "plotType": "LINE",
                      "targetAxis": "Y1",
                      "timeSeriesQuery": {
                        "outputFullDuration": false,
                        "prometheusQuery": "histogram_quantile(0.9, sum by(le) (rate(inference_model_output_tokens_bucket{}[${__interval}])))",
                        "unitOverride": ""
                      }
                    },
                    {
                      "breakdowns": [],
                      "dimensions": [],
                      "legendTemplate": "p50",
                      "measures": [],
                      "plotType": "LINE",
                      "targetAxis": "Y1",
                      "timeSeriesQuery": {
                        "outputFullDuration": false,
                        "prometheusQuery": "histogram_quantile(0.5, sum by(le) (rate(inference_model_output_tokens_bucket{}[${__interval}])))",
                        "unitOverride": ""
                      }
                    }
                  ],
                  "thresholds": []
                }
              }
            },
            {
              "yPos": 124,
              "height": 16,
              "width": 24,
              "widget": {
                "title": "Average KV Cache Utilization",
                "id": "",
                "xyChart": {
                  "chartOptions": {
                    "displayHorizontal": false,
                    "mode": "COLOR",
                    "showLegend": false
                  },
                  "dataSets": [
                    {
                      "breakdowns": [],
                      "dimensions": [],
                      "legendTemplate": "",
                      "measures": [],
                      "plotType": "LINE",
                      "targetAxis": "Y1",
                      "timeSeriesQuery": {
                        "outputFullDuration": false,
                        "prometheusQuery": "sum by (name)(avg_over_time(inference_pool_average_kv_cache_utilization[${__interval}]))*100",
                        "unitOverride": "%"
                      }
                    }
                  ],
                  "thresholds": [],
                  "yAxis": {
                    "label": "",
                    "scale": "LINEAR"
                  }
                }
              }
            },
            {
              "yPos": 124,
              "height": 16,
              "width": 48,
              "widget": {
                "title": "Inference Pool",
                "collapsibleGroup": {
                  "collapsed": false
                },
                "id": ""
              }
            },
            {
              "yPos": 124,
              "xPos": 24,
              "height": 16,
              "width": 24,
              "widget": {
                "title": "Average Queue Size",
                "id": "",
                "xyChart": {
                  "chartOptions": {
                    "displayHorizontal": false,
                    "mode": "COLOR",
                    "showLegend": false
                  },
                  "dataSets": [
                    {
                      "breakdowns": [],
                      "dimensions": [],
                      "legendTemplate": "",
                      "measures": [],
                      "plotType": "LINE",
                      "targetAxis": "Y1",
                      "timeSeriesQuery": {
                        "outputFullDuration": false,
                        "prometheusQuery": "sum by (name) (avg_over_time(inference_pool_average_queue_size[${__interval}]))",
                        "unitOverride": ""
                      }
                    }
                  ],
                  "thresholds": [],
                  "yAxis": {
                    "label": "",
                    "scale": "LINEAR"
                  }
                }
              }
            },
            {
              "yPos": 140,
              "height": 4,
              "width": 48,
              "widget": {
                "title": "Model Server",
                "id": "",
                "sectionHeader": {
                  "dividerBelow": true,
                  "subtitle": "The following charts will only be populated if model server is exporting metrics."
                }
              }
            },
            {
              "yPos": 144,
              "height": 32,
              "width": 48,
              "widget": {
                "title": "vLLM",
                "collapsibleGroup": {
                  "collapsed": false
                },
                "id": ""
              }
            },
            {
              "yPos": 144,
              "xPos": 1,
              "height": 16,
              "width": 24,
              "widget": {
                "title": "Token Throughput",
                "id": "",
                "xyChart": {
                  "chartOptions": {
                    "displayHorizontal": false,
                    "mode": "COLOR",
                    "showLegend": false
                  },
                  "dataSets": [
                    {
                      "breakdowns": [],
                      "dimensions": [],
                      "legendTemplate": "Prompt Tokens/Sec",
                      "measures": [],
                      "plotType": "LINE",
                      "targetAxis": "Y1",
                      "timeSeriesQuery": {
                        "outputFullDuration": false,
                        "prometheusQuery": "sum by(model_name) (rate(vllm:prompt_tokens_total[${__interval}]))",
                        "unitOverride": ""
                      }
                    },
                    {
                      "breakdowns": [],
                      "dimensions": [],
                      "legendTemplate": "Generation Tokens/Sec",
                      "measures": [],
                      "plotType": "LINE",
                      "targetAxis": "Y1",
                      "timeSeriesQuery": {
                        "outputFullDuration": false,
                        "prometheusQuery": "sum by(model_name) (rate(vllm:generation_tokens_total[${__interval}]))",
                        "unitOverride": ""
                      }
                    }
                  ],
                  "thresholds": []
                }
              }
            },
            {
              "yPos": 144,
              "xPos": 25,
              "height": 16,
              "width": 23,
              "widget": {
                "title": "Request Latency",
                "id": "",
                "xyChart": {
                  "chartOptions": {
                    "displayHorizontal": false,
                    "mode": "COLOR",
                    "showLegend": false
                  },
                  "dataSets": [
                    {
                      "breakdowns": [],
                      "dimensions": [],
                      "legendTemplate": "p95",
                      "measures": [],
                      "plotType": "LINE",
                      "targetAxis": "Y1",
                      "timeSeriesQuery": {
                        "outputFullDuration": false,
                        "prometheusQuery": "histogram_quantile(0.95, sum by(le) (rate(vllm:e2e_request_latency_seconds_bucket[${__interval}])))",
                        "unitOverride": "s"
                      }
                    },
                    {
                      "breakdowns": [],
                      "dimensions": [],
                      "legendTemplate": "p90",
                      "measures": [],
                      "plotType": "LINE",
                      "targetAxis": "Y1",
                      "timeSeriesQuery": {
                        "outputFullDuration": false,
                        "prometheusQuery": "histogram_quantile(0.9, sum by(le) (rate(vllm:e2e_request_latency_seconds_bucket[${__interval}])))",
                        "unitOverride": "s"
                      }
                    },
                    {
                      "breakdowns": [],
                      "dimensions": [],
                      "legendTemplate": "p50",
                      "measures": [],
                      "plotType": "LINE",
                      "targetAxis": "Y1",
                      "timeSeriesQuery": {
                        "outputFullDuration": false,
                        "prometheusQuery": "histogram_quantile(0.5, sum by(le) (rate(vllm:e2e_request_latency_seconds_bucket[${__interval}])))",
                        "unitOverride": "s"
                      }
                    }
                  ],
                  "thresholds": [],
                  "yAxis": {
                    "label": "",
                    "scale": "LINEAR"
                  }
                }
              }
            },
            {
              "yPos": 160,
              "xPos": 1,
              "height": 16,
              "width": 24,
              "widget": {
                "title": "Time Per Output Token Latency",
                "id": "",
                "xyChart": {
                  "chartOptions": {
                    "displayHorizontal": false,
                    "mode": "COLOR",
                    "showLegend": false
                  },
                  "dataSets": [
                    {
                      "breakdowns": [],
                      "dimensions": [],
                      "legendTemplate": "p95",
                      "measures": [],
                      "plotType": "LINE",
                      "targetAxis": "Y1",
                      "timeSeriesQuery": {
                        "outputFullDuration": false,
                        "prometheusQuery": "histogram_quantile(0.95, sum by(le) (rate(vllm:time_per_output_token_seconds_bucket[${__interval}])))",
                        "unitOverride": "s"
                      }
                    },
                    {
                      "breakdowns": [],
                      "dimensions": [],
                      "legendTemplate": "p90",
                      "measures": [],
                      "plotType": "LINE",
                      "targetAxis": "Y1",
                      "timeSeriesQuery": {
                        "outputFullDuration": false,
                        "prometheusQuery": "histogram_quantile(0.9, sum by(le) (rate(vllm:time_per_output_token_seconds_bucket[${__interval}])))",
                        "unitOverride": "s"
                      }
                    },
                    {
                      "breakdowns": [],
                      "dimensions": [],
                      "legendTemplate": "p50",
                      "measures": [],
                      "plotType": "LINE",
                      "targetAxis": "Y1",
                      "timeSeriesQuery": {
                        "outputFullDuration": false,
                        "prometheusQuery": "histogram_quantile(0.5, sum by(le) (rate(vllm:time_per_output_token_seconds_bucket[${__interval}])))",
                        "unitOverride": "s"
                      }
                    }
                  ],
                  "thresholds": [],
                  "yAxis": {
                    "label": "",
                    "scale": "LINEAR"
                  }
                }
              }
            },
            {
              "yPos": 160,
              "xPos": 25,
              "height": 16,
              "width": 23,
              "widget": {
                "title": "Time To First Token Latency",
                "id": "",
                "xyChart": {
                  "chartOptions": {
                    "displayHorizontal": false,
                    "mode": "COLOR",
                    "showLegend": false
                  },
                  "dataSets": [
                    {
                      "breakdowns": [],
                      "dimensions": [],
                      "legendTemplate": "p95",
                      "measures": [],
                      "plotType": "LINE",
                      "targetAxis": "Y1",
                      "timeSeriesQuery": {
                        "outputFullDuration": false,
                        "prometheusQuery": "histogram_quantile(0.95, sum by(le) (rate(vllm:time_to_first_token_seconds_bucket[${__interval}])))",
                        "unitOverride": "s"
                      }
                    },
                    {
                      "breakdowns": [],
                      "dimensions": [],
                      "legendTemplate": "p90",
                      "measures": [],
                      "plotType": "LINE",
                      "targetAxis": "Y1",
                      "timeSeriesQuery": {
                        "outputFullDuration": false,
                        "prometheusQuery": "histogram_quantile(0.9, sum by(le) (rate(vllm:time_to_first_token_seconds_bucket[${__interval}])))",
                        "unitOverride": "s"
                      }
                    },
                    {
                      "breakdowns": [],
                      "dimensions": [],
                      "legendTemplate": "p50",
                      "measures": [],
                      "plotType": "LINE",
                      "targetAxis": "Y1",
                      "timeSeriesQuery": {
                        "outputFullDuration": false,
                        "prometheusQuery": "histogram_quantile(0.5, sum by(le) (rate(vllm:time_to_first_token_seconds_bucket[${__interval}])))",
                        "unitOverride": "s"
                      }
                    }
                  ],
                  "thresholds": [],
                  "yAxis": {
                    "label": "",
                    "scale": "LINEAR"
                  }
                }
              }
            }
          ]
        }
      }
    
  2. Google Cloud Armor にダッシュボードをインストールするには、次のコマンドを実行します。

    gcloud monitoring dashboards create --project $PROJECT_ID --config-from-file=dashboard.json
    
  3. Google Cloud コンソールで [モニタリング] ページを開きます。

    [モニタリング] に移動

  4. ナビゲーション メニューで [ダッシュボード] を選択します。

  5. カスタム ダッシュボードのリストから [Inference Optimized Gateway(L7LB を使用)Prometheus の概要] ダッシュボードを選択します。

  6. [外部アプリケーション ロードバランサ] セクションには、次のロード バランシング 指標が表示されます。

    • E2E リクエスト レイテンシ p99(コード別): ロードバランサが処理するリクエストのエンド ツー エンドのリクエスト処理レイテンシの 99 パーセンタイルを、返されたステータス コードで集計して示します。
    • リクエスト数(コード別): ロードバランサが処理したリクエスト数を、返されたステータス コード別に集計して表示します。

GKE Inference Gateway のロギングを構成する

GKE Inference Gateway のロギングを構成して、リクエストとレスポンスの詳細情報を確認しましょう。これは、トラブルシューティング、監査、パフォーマンス分析に役立ちます。HTTP アクセス ログには、ヘッダー、ステータス コード、タイムスタンプなど、すべてのリクエストとレスポンスが記録されます。このレベルの詳細は、問題の特定、エラーの検出、推論ワークロードの動作の把握に役立ちます。

GKE Inference Gateway のロギングを構成するには、各 InferencePool オブジェクトの HTTP アクセス ロギングを有効にします。

  1. 次のサンプル マニフェストを logging-backend-policy.yaml として保存します。

    apiVersion: networking.gke.io/v1
    kind: GCPBackendPolicy
    metadata:
      name: logging-backend-policy
      namespace: NAMESPACE_NAME
    spec:
      default:
        logging:
          enabled: true
          sampleRate: 500000
      targetRef:
        group: inference.networking.x-k8s.io
        kind: InferencePool
        name: INFERENCE_POOL_NAME
    

    次のように置き換えます。

    • NAMESPACE_NAME: InferencePool がデプロイされる名前空間の名前。
    • INFERENCE_POOL_NAME: InferencePool の名前。
  2. マニフェストをクラスタに適用します。

    kubectl apply -f logging-backend-policy.yaml
    

このマニフェストを適用すると、GKE Inference Gateway は指定された InferencePool の HTTP アクセスログを有効にします。これらのログは Cloud Logging で確認できます。ログでは、各リクエストとレスポンスの詳細情報、例えば、リクエスト URL、ヘッダー、レスポンス ステータス コード、レイテンシなどを確認できます。

自動スケーリングを構成する

自動スケーリングは、ワークロードの変化に応じてリソース割り当てを調整し、また需要に応じて Pod を動的に追加または削除してパフォーマンスとリソース効率を維持します。GKE Inference Gateway の場合、これは各 InferencePool の Pod の水平自動スケーリングを伴います。GKE Horizontal Pod Autoscaler(HPA)は、KVCache Utilization などのモデルサーバー 指標に基づいて Pod を自動スケーリングします。これにより、推論サービスはリソース使用量を効率的に管理しながら、さまざまなワークロードとクエリ量を処理できます。

GKE Inference Gateway によって生成された指標に基づいて自動スケーリングされるように InferencePool インスタンスを構成するには、次の操作を行います。

  1. クラスタに PodMonitoring オブジェクトをデプロイして、GKE Inference Gateway によって生成された指標を収集します。詳細については、オブザーバビリティを構成するをご覧ください。

  2. Custom Metrics Stackdriver Adapterをデプロイして、HPA に指標へのアクセス権を付与します。

    1. 次のサンプル マニフェストを adapter_new_resource_model.yaml として保存します。

      apiVersion: v1
      kind: Namespace
      metadata:
        name: custom-metrics
      ---
      apiVersion: v1
      kind: ServiceAccount
      metadata:
        name: custom-metrics-stackdriver-adapter
        namespace: custom-metrics
      ---
      apiVersion: rbac.authorization.k8s.io/v1
      kind: ClusterRoleBinding
      metadata:
        name: custom-metrics:system:auth-delegator
      roleRef:
        apiGroup: rbac.authorization.k8s.io
        kind: ClusterRole
        name: system:auth-delegator
      subjects:
      - kind: ServiceAccount
        name: custom-metrics-stackdriver-adapter
        namespace: custom-metrics
      ---
      apiVersion: rbac.authorization.k8s.io/v1
      kind: RoleBinding
      metadata:
        name: custom-metrics-auth-reader
        namespace: kube-system
      roleRef:
        apiGroup: rbac.authorization.k8s.io
        kind: Role
        name: extension-apiserver-authentication-reader
      subjects:
      - kind: ServiceAccount
        name: custom-metrics-stackdriver-adapter
        namespace: custom-metrics
      ---
      apiVersion: rbac.authorization.k8s.io/v1
      kind: ClusterRole
      metadata:
        name: custom-metrics-resource-reader
        namespace: custom-metrics
      rules:
      - apiGroups:
        - ""
        resources:
        - pods
        - nodes
        - nodes/stats
        verbs:
        - get
        - list
        - watch
      ---
      apiVersion: rbac.authorization.k8s.io/v1
      kind: ClusterRoleBinding
      metadata:
        name: custom-metrics-resource-reader
      roleRef:
        apiGroup: rbac.authorization.k8s.io
        kind: ClusterRole
        name: custom-metrics-resource-reader
      subjects:
      - kind: ServiceAccount
        name: custom-metrics-stackdriver-adapter
        namespace: custom-metrics
      ---
      apiVersion: apps/v1
      kind: Deployment
      metadata:
        run: custom-metrics-stackdriver-adapter
        k8s-app: custom-metrics-stackdriver-adapter
      spec:
        replicas: 1
        selector:
          matchLabels:
            run: custom-metrics-stackdriver-adapter
            k8s-app: custom-metrics-stackdriver-adapter
        template:
          metadata:
            labels:
              run: custom-metrics-stackdriver-adapter
              k8s-app: custom-metrics-stackdriver-adapter
              kubernetes.io/cluster-service: "true"
          spec:
            serviceAccountName: custom-metrics-stackdriver-adapter
            containers:
            - image: gcr.io/gke-release/custom-metrics-stackdriver-adapter:v0.15.2-gke.1
              imagePullPolicy: Always
              name: pod-custom-metrics-stackdriver-adapter
              command:
              - /adapter
              - --use-new-resource-model=true
              - --fallback-for-container-metrics=true
              resources:
                limits:
                  cpu: 250m
                  memory: 200Mi
                requests:
                  cpu: 250m
                  memory: 200Mi
      ---
      apiVersion: v1
      kind: Service
      metadata:
        labels:
          run: custom-metrics-stackdriver-adapter
          k8s-app: custom-metrics-stackdriver-adapter
          kubernetes.io/cluster-service: 'true'
          kubernetes.io/name: Adapter
        name: custom-metrics-stackdriver-adapter
        namespace: custom-metrics
      spec:
        ports:
        - port: 443
          protocol: TCP
          targetPort: 443
        selector:
          run: custom-metrics-stackdriver-adapter
          k8s-app: custom-metrics-stackdriver-adapter
        type: ClusterIP
      ---
      apiVersion: apiregistration.k8s.io/v1
      kind: APIService
      metadata:
        name: v1beta1.custom.metrics.k8s.io
      spec:
        insecureSkipTLSVerify: true
        group: custom.metrics.k8s.io
        groupPriorityMinimum: 100
        versionPriority: 100
        service:
          name: custom-metrics-stackdriver-adapter
          namespace: custom-metrics
        version: v1beta1
      ---
      apiVersion: apiregistration.k8s.io/v1
      kind: APIService
      metadata:
        name: v1beta2.custom.metrics.k8s.io
      spec:
        insecureSkipTLSVerify: true
        group: custom.metrics.k8s.io
        groupPriorityMinimum: 100
        versionPriority: 200
        service:
          name: custom-metrics-stackdriver-adapter
          namespace: custom-metrics
        version: v1beta2
      ---
      apiVersion: apiregistration.k8s.io/v1
      kind: APIService
      metadata:
        name: v1beta1.external.metrics.k8s.io
      spec:
        insecureSkipTLSVerify: true
        group: external.metrics.k8s.io
        groupPriorityMinimum: 100
        versionPriority: 100
        service:
          name: custom-metrics-stackdriver-adapter
          namespace: custom-metrics
        version: v1beta1
      ---
      apiVersion: rbac.authorization.k8s.io/v1
      kind: ClusterRole
      metadata:
        name: external-metrics-reader
      rules:
      - apiGroups:
        - "external.metrics.k8s.io"
        resources:
        - "*"
        verbs:
        - list
        - get
        - watch
      ---
      apiVersion: rbac.authorization.k8s.io/v1
      kind: ClusterRoleBinding
      metadata:
        name: external-metrics-reader
      roleRef:
        apiGroup: rbac.authorization.k8s.io
        kind: ClusterRole
        name: external-metrics-reader
      subjects:
      - kind: ServiceAccount
        name: horizontal-pod-autoscaler
        namespace: kube-system
      
    2. マニフェストをクラスタに適用します。

      kubectl apply -f adapter_new_resource_model.yaml
      
  3. プロジェクトから指標を読み取る権限をアダプターに付与するには、次のコマンドを実行します。

    $ PROJECT_ID=PROJECT_ID
    $ PROJECT_NUMBER=$(gcloud projects describe PROJECT_ID --format="value(projectNumber)")
    $ gcloud projects add-iam-policy-binding projects/PROJECT_ID \
      --role roles/monitoring.viewer \
      --member=principal://iam.googleapis.com/projects/PROJECT_NUMBER/locations/global/workloadIdentityPools/$PROJECT_ID.svc.id.goog/subject/ns/custom-metrics/sa/custom-metrics-stackdriver-adapter
    

    PROJECT_ID は、実際の Google Cloud PROJECT_ID に置き換えます。

  4. InferencePool ごとに、次のような HPA を 1 つデプロイします。

    apiVersion: autoscaling/v2
    kind: HorizontalPodAutoscaler
    metadata:
      name: INFERENCE_POOL_NAME
      namespace: INFERENCE_POOL_NAMESPACE
    spec:
      scaleTargetRef:
        apiVersion: apps/v1
        kind: Deployment
        name: INFERENCE_POOL_NAME
      minReplicas: MIN_REPLICAS
      maxReplicas: MAX_REPLICAS
      metrics:
      - type: External
        external:
          metric:
            name: prometheus.googleapis.com|inference_pool_average_kv_cache_utilization|gauge
            selector:
              matchLabels:
                metric.labels.name: INFERENCE_POOL_NAME
                resource.labels.cluster: CLUSTER_NAME
                resource.labels.namespace: INFERENCE_POOL_NAMESPACE
          target:
            type: AverageValue
            averageValue: TARGET_VALUE
    

    次のように置き換えます。

    • INFERENCE_POOL_NAME: InferencePool の名前。
    • INFERENCE_POOL_NAMESPACE: InferencePool の名前空間。
    • CLUSTER_NAME: クラスタの名前。
    • MIN_REPLICAS: InferencePool の最小可用性(ベースライン容量)。使用率が HPA ターゲットしきい値を下回っている場合、HPA はこのレプリカ数を維持します。高可用性ワークロードでは、Pod の中断中に可用性を維持するために、この値を 1 より大きい値に設定する必要があります。
    • MAX_REPLICAS: InferencePool でホストされているワークロードに割り当てる必要があるアクセラレータの数を制限する値。HPA は、この値を超えてレプリカ数を増やしません。トラフィックのピーク時にレプリカ数をモニタリングし、MAX_REPLICAS フィールドの値に十分なヘッドルームがあることを確認しておくことで、ワークロードをスケールアップして選択したワークロードのパフォーマンス特性を維持できるようにしておきましょう。
    • TARGET_VALUE: モデルサーバーごとに選択されたターゲット KV-Cache Utilization を表す値。これは 0 ~ 100 の数値で、モデルサーバー、モデル、アクセラレータ、受信トラフィックの特性に大きく依存します。このターゲット値は、負荷テストを実施してスループットとレイテンシのグラフをプロットすることで、実験的に決定できます。グラフから選択したスループットとレイテンシの組み合わせを選択し、対応する KV-Cache Utilization 値を HPA ターゲットとして使用します。選択した価格-パフォーマンス関係を達成するには、この値を微調整して注意深くモニタリングする必要があります。GKE Inference Recommendationsをご利用いただくと、この値を自動的に決定できます。

次のステップ