本页面介绍了如何使用 Google Cloud 控制台创建基于 PromQL 的提醒政策。
准备工作
-
如需获得在 Google Cloud 控制台中创建基于 PromQL 的提醒政策所需的权限,请让您的管理员为您授予项目的 Monitoring Editor (
roles/monitoring.editor) IAM 角色。 如需详细了解如何授予角色,请参阅管理对项目、文件夹和组织的访问权限。如需详细了解 Cloud Monitoring 角色,请参阅使用 Identity and Access Management 控制访问权限。
确保您熟悉提醒政策的一般概念以及 Cloud Monitoring 中的 PromQL。 如需了解详情,请参阅以下主题:
配置您要用于接收任何提醒的通知渠道。为实现冗余,我们建议您创建多种类型的通知渠道。如需了解详情,请参阅创建和管理通知渠道。
如果提醒政策中的 PromQL 查询引用了任何指标,那么在您创建提醒政策时,这些指标必须已存在于 Monitoring 中。
创建 PromQL 提醒政策
如需通过 Google Cloud 控制台创建基于 PromQL 的提醒政策,请执行以下操作:
-
在 Google Cloud 控制台中,前往 notifications 提醒页面:
如果您使用搜索栏查找此页面,请选择子标题为监控的结果。
在提醒页面上,点击创建政策。
在政策配置模式下,选择代码编辑器(MQL 或 PromQL)。
验证已在PromQL 切换开关中选择 PromQL。语言切换开关位于同一工具栏中,用于设置查询的格式。
输入用于选择要监控的数据的 PromQL 查询。 如果未启用自动运行,请点击运行查询。
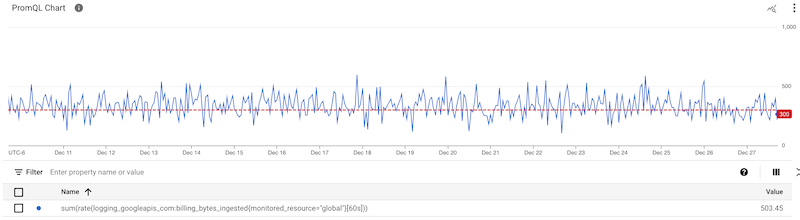
例如,以下查询会汇总在 60 秒间隔内注入的结算日志记录数据的速率,并确定汇总的速率是否超过 300 字节:
sum(rate(logging_googleapis_com:billing_bytes_ingested{monitored_resource="global"}[60s]))>300运行查询后,您会看到一个图表。对于一个项目,此查询生成了以下结果:
点击下一步,然后执行以下操作:
选择重新测试窗口。此字段用于定义必须满足条件多长时间才能触发提醒政策。
默认值为 0 秒。使用此设置时,单个测量值可能会导致发出通知。如需了解详情和查看示例,请参阅校准时间段和时长设置。
如需选择提醒评估 PromQL 查询的频率,请为评估间隔选择一个值。
输入条件的名称,然后点击下一步。
点击下一步,然后执行以下操作:
点击创建政策。
如需查看完整步骤,请参阅管理提醒政策。