Stay organized with collections
Save and categorize content based on your preferences.
This page describes how to create PromQL-based alerting policies
by using the Google Cloud console.
Before you begin
To get the permissions that
you need to create PromQL-based alerting policies in the Google Cloud console,
ask your administrator to grant you the
Monitoring Editor (roles/monitoring.editor)
IAM role on your project.
For more information about granting roles, see Manage access to projects, folders, and organizations.
Ensure that you're familiar with the general concepts of alerting policies
and PromQL in Cloud Monitoring.
For more information, see the following topics:
Configure the notification channels that you want to use to receive any
alerts. For redundancy purposes, we recommend that you create multiple
types of notification channels. For more information, see
Create and manage notification channels.
If the PromQL query in your alerting policy references any
metrics, then the metrics must already exist in Monitoring
when you create the alerting policy.
Create PromQL alerting policies
To create a PromQL-based alerting policy from
the Google Cloud console, do the following:
In the Google Cloud console, go to the
notificationsAlerting page:
If you use the search bar to find this page, then select the result whose subheading is
Monitoring.
On the Alerting page, click Create Policy.
Under Policy configuration mode, select
Code editor (MQL or PromQL).
Verify that PromQL is selected
in the Language toggle. The language toggle is in the same toolbar that
lets you format your query.
Enter the PromQL query that selects the data you want to monitor.
If Auto-run isn't enabled, then click Run Query.
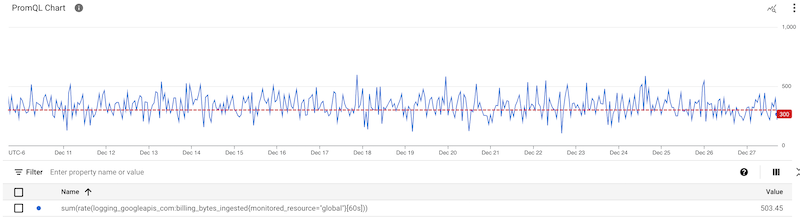
For example, the following query summarizes the rate of
billing logging data ingested over a 60-second interval
and determines whether the summarized rate is over 300 bytes:
After you run your query, you see a chart. For one
project, this query produced the following result:
Click Next, and then do the following:
Select a Retest window. This field defines for how long the
condition must be satisfied before the alerting policy is triggered.
The default value is 0 sec. With this setting, a single
measurement can result in a notification. For more information and
an example, see
Alignment period and duration settings.
To select how often alerting evaluates the PromQL query, choose
a value for the Evaluation interval.
[[["Easy to understand","easyToUnderstand","thumb-up"],["Solved my problem","solvedMyProblem","thumb-up"],["Other","otherUp","thumb-up"]],[["Hard to understand","hardToUnderstand","thumb-down"],["Incorrect information or sample code","incorrectInformationOrSampleCode","thumb-down"],["Missing the information/samples I need","missingTheInformationSamplesINeed","thumb-down"],["Other","otherDown","thumb-down"]],["Last updated 2025-08-29 UTC."],[],[],null,["# Create PromQL-based alerting policies (Console)\n\nThis page describes how to create PromQL-based alerting policies\nby using the Google Cloud console.\n\nBefore you begin\n----------------\n\n1.\n\n To get the permissions that\n you need to create PromQL-based alerting policies in the Google Cloud console,\n\n ask your administrator to grant you the\n\n\n [Monitoring Editor](/iam/docs/roles-permissions/monitoring#monitoring.editor) (`roles/monitoring.editor`)\n IAM role on your project.\n\n\n For more information about granting roles, see [Manage access to projects, folders, and organizations](/iam/docs/granting-changing-revoking-access).\n\n\n You might also be able to get\n the required permissions through [custom\n roles](/iam/docs/creating-custom-roles) or other [predefined\n roles](/iam/docs/roles-overview#predefined).\n\n For more information about Cloud Monitoring roles,\n see [Control access with Identity and Access Management](/monitoring/access-control).\n2. Ensure that you're familiar with the general concepts of alerting policies\n and PromQL in Cloud Monitoring.\n For more information, see the following topics:\n\n - [Alerting overview](/monitoring/alerts)\n - [PromQL in Cloud Monitoring](/monitoring/promql)\n3. Configure the notification channels that you want to use to receive any\n alerts. For redundancy purposes, we recommend that you create multiple\n types of notification channels. For more information, see\n [Create and manage notification channels](/monitoring/support/notification-options).\n\n4. If the PromQL query in your alerting policy references any\n metrics, then the metrics must already exist in Monitoring\n when you create the alerting policy.\n\nCreate PromQL alerting policies\n-------------------------------\n\nTo create a PromQL-based alerting policy from\nthe Google Cloud console, do the following:\n\n1. In the Google Cloud console, go to the\n *notifications* **Alerting** page:\n\n [Go to **Alerting**](https://console.cloud.google.com/monitoring/alerting)\n\n \u003cbr /\u003e\n\n If you use the search bar to find this page, then select the result whose subheading is\n **Monitoring**.\n2. On the **Alerting** page, click **Create Policy**.\n\n3. Under **Policy configuration mode** , select\n **Code editor (MQL or PromQL)**.\n\n4. Verify that **PromQL** is selected\n in the **Language** toggle. The language toggle is in the same toolbar that\n lets you format your query.\n\n5. Enter the PromQL query that selects the data you want to monitor.\n If **Auto-run** isn't enabled, then click **Run Query**.\n\n For example, the following query summarizes the rate of\n billing logging data ingested over a 60-second interval\n and determines whether the summarized rate is over 300 bytes: \n\n ```\n sum(rate(logging_googleapis_com:billing_bytes_ingested{monitored_resource=\"global\"}[60s]))\u003e300\n ```\n\n After you run your query, you see a chart. For one\n project, this query produced the following result:\n\n6. Click **Next**, and then do the following:\n\n 1. Select a **Retest window**. This field defines for how long the\n condition must be satisfied before the alerting policy is triggered.\n\n The default value is **0 sec** . With this setting, a single\n measurement can result in a notification. For more information and\n an example, see\n [Alignment period and duration settings](/monitoring/alerts/concepts-indepth#duration).\n 2. To select how often alerting evaluates the PromQL query, choose\n a value for the **Evaluation interval**.\n\n | **Note:** Incidents created by a PromQL-based alerting policy don't follow the alerting policy autoclose duration. Instead, the incident is automatically closed when it reaches a set time after the last time the condition was met. This time is the larger of 270 seconds and twice the condition's evaluation interval.\n 3. Enter a name for the condition and click **Next**.\n\n7. Click **Next**, and then do the following:\n\n 1. Add [notification channels](/monitoring/support/notification-options).\n\n 2. Choose a severity level for incidents.\n\n 3. Optional: Add [alerting policy labels](/monitoring/alerts/labels) and\n [documentation](/monitoring/alerts/doc-variables).\n\n 4. Enter a name for the alerting policy.\n\n8. Click **Create policy**.\n\nFor complete steps, see [Managing alerting policies](/monitoring/alerts/using-alerting-ui)."]]