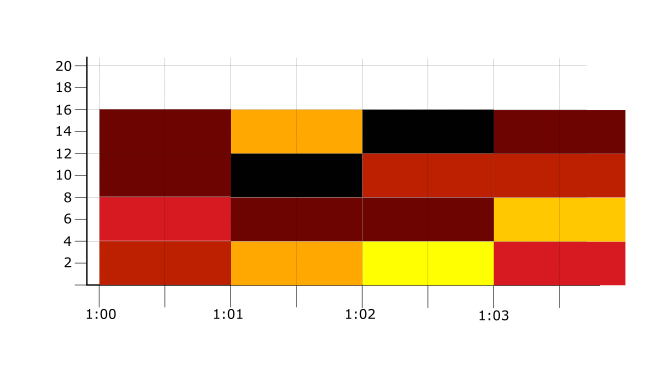
[[["易于理解","easyToUnderstand","thumb-up"],["解决了我的问题","solvedMyProblem","thumb-up"],["其他","otherUp","thumb-up"]],[["很难理解","hardToUnderstand","thumb-down"],["信息或示例代码不正确","incorrectInformationOrSampleCode","thumb-down"],["没有我需要的信息/示例","missingTheInformationSamplesINeed","thumb-down"],["翻译问题","translationIssue","thumb-down"],["其他","otherDown","thumb-down"]],["最后更新时间 (UTC):2025-08-28。"],[],[],null,["# About distribution-valued metrics\n\nThis document describes how you can create and interpret a chart that displays\nmetric data of the [`Distribution`](/monitoring/api/ref_v3/rest/v3/TypedValue#Distribution) value type.\nThis value type is used by services when the individual measurements are too\nnumerous to collect, but statistical information, such as averages or\npercentiles, about those measurements is valuable.\nFor example, when an application relies on HTTP traffic, you can use a\ndistribution-valued metric that captures HTTP response latency to evaluate\nhow quickly HTTP requests complete.\n\nTo illustrate how a histogram is created, consider a service that measures\nthe HTTP latency of requests and that reports this data by using a metric with\na distribution-value type. The data is reported every minute.\nThe service defines ranges of values for the metric, called *buckets*, and\nrecords the count of measured values that falls into each bucket.\nFor example, when an HTTP request completes, the service increments the count\nin the bucket whose range includes the request's latency value. These counts\ncreate a histogram of values for that minute.\n\nAssume that the latencies measured in a one-minute interval are\n5, 1, 3, 5, 6, 10, and 14. If the buckets are \\[0, 4), \\[4, 8), \\[8, 12), and\n\\[12, 16), then the histogram of this data is \\[2, 3, 1, 1\\].\nThe following table shows\nhow individual measurements affect the count for each bucket:\n\nWhen this data is written to the time series, a [`Point`](/monitoring/api/ref_v3/rest/v3/TimeSeries#Point)\nobject is created. For metrics with a distribution value, that object\nincludes the histogram of values. For this sampling period, the\n`Point` contains \\[2, 3, 1, 1\\]. The individual measurements aren't\nwritten to the time series.\n\nAssume that the previous table records the histogram for the latency data as\nmeasured at time 1:00. That table illustrates how to take a series of\nmeasurements and convert them into bucket counts. Suppose that the bucket\ncounts at times 1:01, 1:02, and 1:03 are as shown in the following table:\n\nThe previous table displays a sequence of histograms indexed by time. Each\ncolumn in the table represents the latency data for a one-minute period. To get\nthe number of measurements at a specific time, sum the bucket counts. However,\nthe actual measurements aren't shown as those measurements aren't available\nin distribution-valued metrics.\n\nHeatmap charts\n--------------\n\nHeatmap charts are designed to display a single time series with distribution\nvalues. For these charts, the *X* -axis represents time, the *Y*-axis represents\nthe buckets, and color represents the value. The brighter the color\nindicates a higher value. For example, dark areas of the heatmap indicate\nlower bucket counts than yellow or white areas.\n\nThe following figure is one representation of a heatmap for the previous\nexample:\n\nIn the previous figure, the heatmap uses black to represent the smallest\nbucket count, 0, and yellow to represent the largest bucket count, 10. Reds\nand oranges represent values between these two extremes.\n\nBecause heatmap charts can display only a single time series, you must set the\n[aggregation](/monitoring/api/v3/aggregation#aggr-intro) options to combine all time series.\n\n\u003cbr /\u003e\n\nTo use Metrics Explorer to display the sum of the RTT latencies of a VM instance, do the following:\n\n1. In the Google Cloud console, go to the\n *leaderboard* **Metrics explorer** page:\n\n [Go to **Metrics explorer**](https://console.cloud.google.com/monitoring/metrics-explorer)\n\n \u003cbr /\u003e\n\n If you use the search bar to find this page, then select the result whose subheading is\n **Monitoring**.\n2. In the toolbar of the Google Cloud console, select your Google Cloud project. For [App Hub](/app-hub/docs/overview) configurations, select the App Hub host project or the app-enabled folder's management project.\n3. In the **Metric** element, expand the **Select a metric** menu, enter `RTT latencies` in the filter bar, and then use the submenus to select a specific resource type and metric:\n 1. In the **Active resources** menu, select **VM Instance**.\n 2. In the **Active metric categories** menu, select **Vm_flow**.\n 3. In the **Active metrics** menu, select **RTT latencies**.\n 4. Click **Apply**.\n\nLine and bar charts\n-------------------\n\nLine charts, stacked bar charts, and stacked line charts, which are designed to\ndisplay scalar data, can't display\ndistribution values. To display a metric with a distribution value\nwith one of these chart types,\nyou must convert the histogram values into scalar values.\nFor example, you can set the aggregation options to compute the mean of the\nvalues in the histogram or to compute a percentile.\n\nFor information about how to display a distribution-valued metric on\na line chart, see the following section.\n\nAggregation and distribution metrics\n------------------------------------\n\n[Aggregation](/monitoring/api/v3/aggregation#aggr-intro) is the process of regularizing points within a\ntime series and of combining multiple time series. Aggregation is the same for\ndistribution type metrics as it is for metrics that have a value type\nof integer or double. However, the chart type enforces some requirements on the\nchoices used for aligning and grouping time series.\n\n### Heatmap charts\n\nHeatmap charts display one distribution-valued time series. Therefore, the\n[alignment function](/monitoring/api/v3/aggregation#alignment-intro) and [grouping function](/monitoring/api/v3/aggregation#aggr-grouping)\nmust be set to create a single time series.\n\nSelect a `sum` or `delta` alignment function when a chart displays a heatmap.\nThese functions combine, at the bucket level, all samples for a\nsingle time series that are in the same alignment period, and the result is a\ndistribution value. For example, if two adjacent samples of a\ntime series are \\[2, 3, 1, 1\\] and \\[2, 5, 4, 1\\], then the sum alignment\nfunction produces \\[4, 8, 5, 2\\].\n\nThe grouping function defines how different time series are\ncombined. This function is sometimes called an aggregator or a reducer.\nFor heatmaps, set the grouping function to the `sum` function.\nThe sum function adds the values of the same buckets across all histograms,\nresulting in a new histogram. For example, the\nsum of the value \\[2, 3, 1, 1\\] from timeseries-A and the value\n\\[1, 5, 2, 2\\] from timeseries-B is \\[3, 8, 3, 3\\].\n\n### Line charts\n\nLine charts display only scalar-valued time series. If you select a\ndistribution-valued metric, then the chart is configured with optimal\nparameters to display a heat map. The fields of the **Aggregation** element\nare set to **Distribution** and **None**.\n\n- The interpretation of **Distribution** depends on the specific metric.\n For distribution-valued metric types that have a `GAUGE` metric kind,\n the default alignment function is set to `sum`. When a distribution-valued\n metric type has a `CUMULATIVE` metric kind, the default alignment\n function is `DELTA`.\n\n- The setting of **None** ensures that all time times are combined.\n\nIf you want to display a distribution-valued metric on a line chart,\nthen you must change the default settings of your chart.\nFor example, to configure a line chart on a dashboard to display the 99th\npercentile of every time series for a distribution-valued metric,\ndo the following:\n\n1. In the Google Cloud console, go to the **Dashboards** page:\n\n [Go to **Dashboards**](https://console.cloud.google.com/monitoring/dashboards)\n\n \u003cbr /\u003e\n\n If you use the search bar to find this page, then select the result whose subheading is\n **Monitoring**.\n2. In the toolbar of the Google Cloud console, select your Google Cloud project. For [App Hub](/app-hub/docs/overview) configurations, select the App Hub host project or the app-enabled folder's management project.\n3. In the toolbar, click *add* **Add widget**.\n4. In the **Add widget** dialog, select *leaderboard* **Metric**.\n5. In the **Metric** element, and select the **VM Instance - RTT latencies** metric.\n6. In the **Aggregation** element, expand the first menu and select **99th percentile**.\n7. In the **Display** pane, set the value of the **Widget type** menu to **Line chart**.\n8. Optional: In the **Aggregation** element, expand the second menu and select the labels used to group time series. By default, no labels are selected, and therefore one line is displayed on the chart.\n\nWhat's next\n-----------\n\nFor information about how to determine the bucket model for a metric and\nhow to interpret percentiles, see\n[Percentiles and distribution-valued metrics](/monitoring/api/v3/distribution-metrics)."]]