本文介绍了 Cloud Monitoring 集成页面,您可以通过该页面集中管理和查看 Monitoring 与 Google 服务以及第三方应用的集成状态。
许多 Google 服务(例如 Compute Engine)会将遥测数据发送到 Cloud Monitoring。您可以使用集成页面查看服务发送的遥测种类,以及预览显示遥测数据的信息中心。
Cloud Monitoring 还提供与第三方应用的集成。这些集成可让您从 Apache Web Server、MySQL、Redis 等应用收集遥测数据,以便在 Compute Engine 和 Google Kubernetes Engine 上运行部署。
- 使用 Compute Engine 时,Ops Agent 会收集第三方遥测数据。
- 使用 GKE 时,Google Cloud Managed Service for Prometheus 会收集第三方遥测数据。
您可以从集成页面配置这些第三方集成,并查看每个集成提供的遥测种类。集成还可能提供信息中心和 Cloud Monitoring 提醒政策。
- 在您配置集成并且集成开始收集指标数据后,系统会为您安装信息中心(如果有)。您可以从集成页面预览信息中心。
- 您可以从集成页面安装 Cloud Monitoring 提醒政策(如果有)。许多将指标导出到 Managed Service for Prometheus 的应用还包含用于提醒的 Prometheus
Rules配置(在 Cloud Monitoring 外部)。
开始使用
在 Google Cloud 控制台中,前往 ![]() 集成页面:
集成页面:
如果您使用搜索栏查找此页面,请选择子标题为监控的结果。
以下屏幕截图显示了 Monitoring 集成页面的示例:
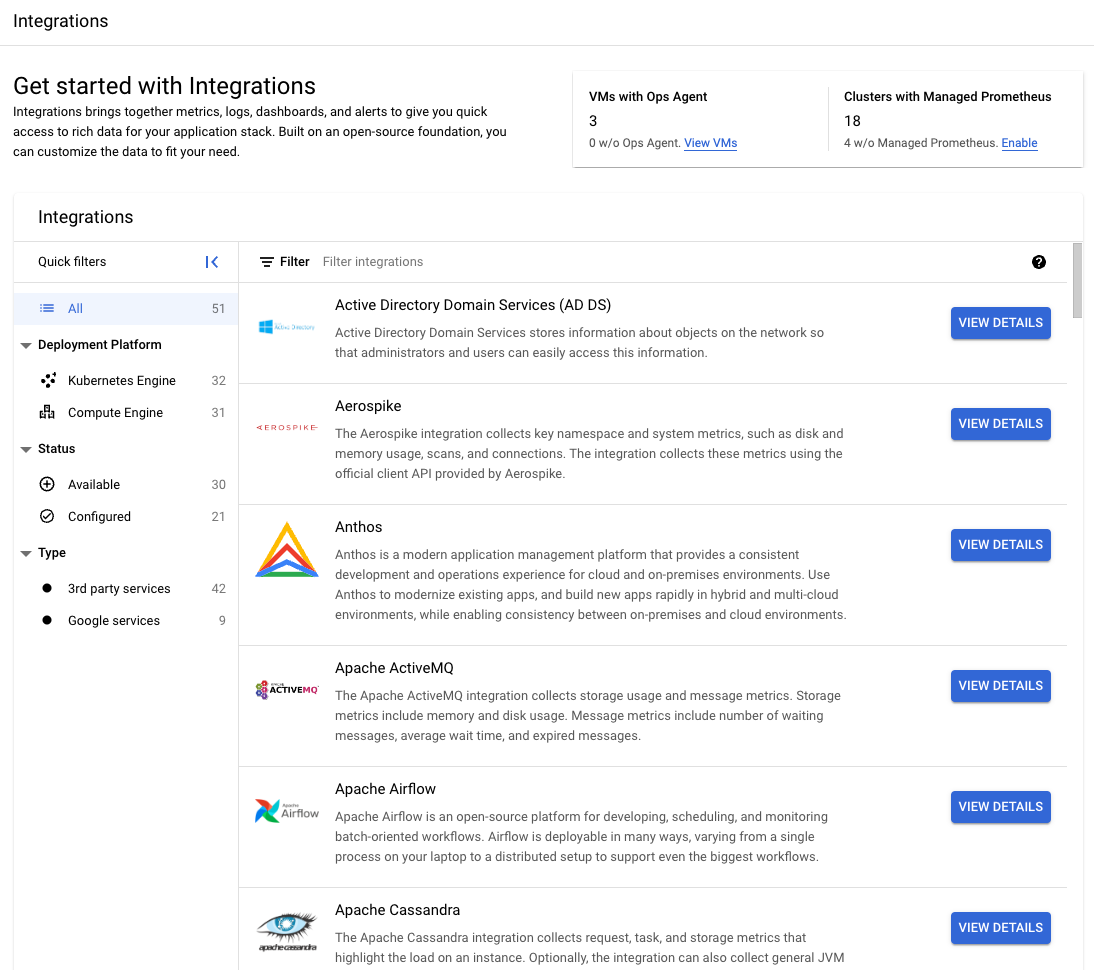
集成页面会显示以下内容:
列出已安装 Ops Agent 的 Compute Engine 虚拟机的数量,以及已启用 Managed Service for Prometheus 的 GKE 集群的数量。
快速过滤条件面板,可用于控制集成列表中显示的内容。
- 如需查看完整的集成列表,请点击全部。
- 如需按部署平台选择集成,请点击以下选项之一:
- Kubernetes Engine
- Compute Engine
- 如需按安装状态选择集成,请点击以下选项之一:
- 可用:显示您尚未安装的集成。
- 已配置:显示您已安装的集成。
- 如需按应用类型限制集成列表,请点击以下选项之一:
- 第三方服务:显示与 Ops Agent 或 Managed Service for Prometheus 集成的所有第三方服务。
- Google 服务:显示具有用于 Cloud Monitoring 的预定义信息中心的服务(例如 Compute Engine)。
当前支持的集成列表。如果您选择了快速过滤条件,列表中会显示过滤后的结果。如需在列表中搜索特定集成,请使用列表的过滤条件栏。
集成条目会指明是否安装了信息中心,对于第三方集成,还会显示安装集成的虚拟机数量。
查看集成详情
如需查看集成提供的内容,请对相应集成条目点击查看详情。如果集成同时适用于 Compute Engine 和 GKE,您可以在详情页面中选择部署平台。
根据部署平台和集成,您会看到集成的当前配置摘要(如果适用)和一组标签页。显示的标签页因集成而异,可能包括以下内容:
- 指标:集成收集的指标的表格。此标签页在默认情况下处于打开状态。
- 日志:集成收集的日志及其字段的列表。此标签页不适用于在 GKE 上部署的第三方集成。
- 信息中心:可用于集成的信息中心的说明和预览。如需详细了解此标签页,请参阅查看信息中心预览。
- 提醒:可用于集成的提醒政策的列表。如需详细了解此标签页,请参阅安装提醒政策。
以下屏幕截图显示了用于 Compute Engine 的第三方集成的详情窗格示例,其中选择了指标标签页:
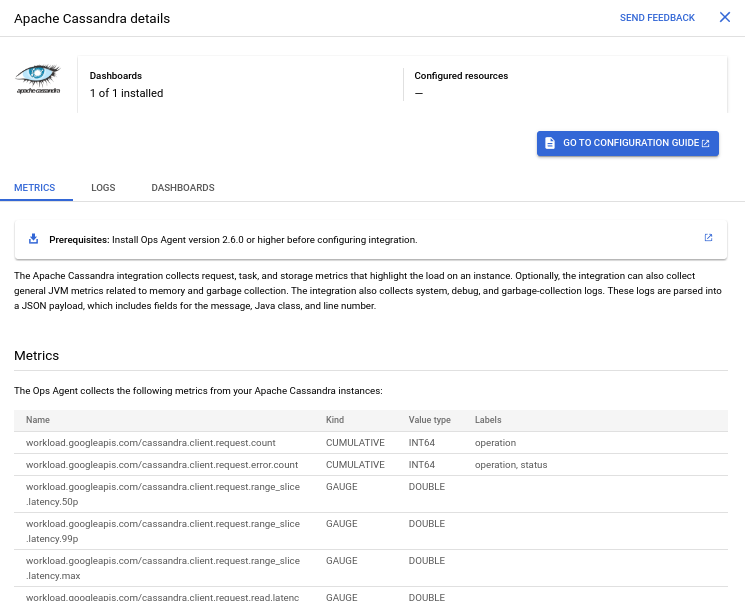
指标标签页会显示集成收集的指标(如果有)的表格。
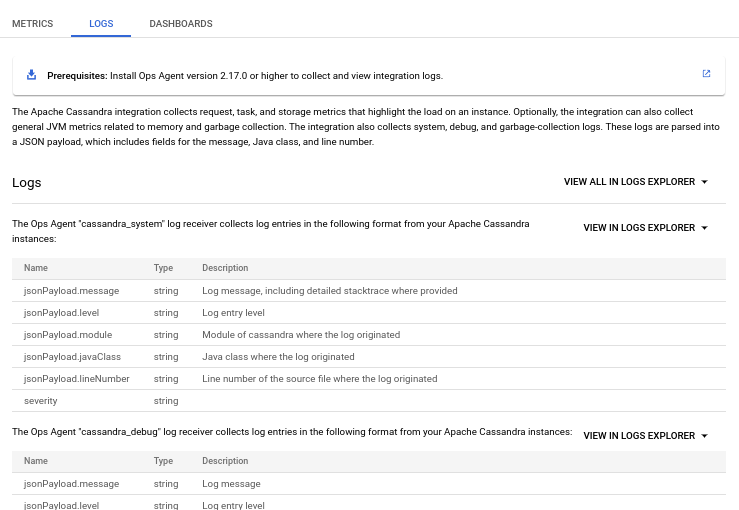
如果集成收集日志,日志标签页会显示每个 Ops Agent 日志接收器收集的日志的结构,并提供一个链接,用于在 Logs Explorer 中查看这些日志。如果有多个日志接收器,您还会获得一个链接,用于在一个查询中查看所有日志。以下屏幕截图展示了日志标签页的示例:
配置第三方集成
如果您打开尚未安装的第三方集成的详情窗格,则面板会指明您没有用于该集成的任何信息中心或已配置资源。
如需向虚拟机或集群添加第三方集成,请点击转到配置指南,然后按照说明操作。
查看信息中心预览
如果有信息中心可用于集成,则详情窗格会显示信息中心标签页。借助信息中心,您可以在图表中查看集成收集的指标。信息中心标签页提供了用于集成的信息中心的说明和静态预览。
如需查看信息中心的相关信息并查看信息中心的预览,请执行以下操作:
- 在集成页面中,对相应集成点击查看详情。
- 选择您的部署平台(如果适用)。
- 选择信息中心标签页。
在您配置第三方集成并开始收集指标后,Monitoring 会自动安装可用于集成的信息中心。系统还会为您安装用于 Google 服务的信息中心。
如需从信息中心标签页前往已安装的信息中心,请点击查看信息中心。
如需详细了解 Cloud Monitoring 中的信息中心,请参阅信息中心和图表。
安装提醒政策
如果有 Cloud Monitoring 提醒政策可用于集成,则详情窗格会显示提醒标签页。提醒政策会指示 Monitoring 在满足指定条件时通知您。提醒标签页提供了可用提醒政策的列表,并提供了一个用于安装这些政策的界面。提醒政策需要知道将通知发送到何处,因此它们需要您提供信息才能进行安装。
如需查看可用提醒政策的说明,请执行以下操作:
- 在集成页面中,对相应集成点击查看详情。
- 选择您的部署平台(如果适用)。
- 选择提醒标签页。
如需通过提醒标签页安装提醒政策,请执行以下操作:
- 从可用提醒政策列表中,选择您要安装的提醒政策。
- 在配置通知部分中,选择一个或多个通知渠道。您可以选择禁止使用通知渠道,但如果您这样做,则您的提醒政策将以静默方式触发。您可以在 Monitoring 中查看其状态,但不会收到通知。如需了解通知渠道,请参阅创建和管理通知渠道。
- 点击创建政策。
如需详细了解 Cloud Monitoring 中的提醒政策,请参阅提醒简介。