Monitor migrated workloads
You can view logs and metrics from your migrated workloads in the Google Cloud console.
You can also view logs from the command line with
kubectl.
You can execute bash commands on the container with your migrated workload. For
more, see the Troubleshooting topic.
View metrics on the GKE console
The GKE console and Cloud Monitoring provide a suite of tools to monitor your containers. To get started:
- Open GKE Workloads
- Click the name of the workload you would like to monitor.
From here, you can see details about this workload, including aggregate graphs of performance across all Pods.
View logs in Cloud Logging
Once you enable monitoring, you can view workload logs in the Cloud Monitoring user interface.
You can use Cloud Logging to view logs for the following aspects of your migration:
- Logs written to
stdoutby processes launched byinit. - The content of var/log/syslog.
- Optionally, application logs written to the file system.
You can view system logs that are in Cloud Logging from the Google Cloud console. To do so:
- Open GKE Workloads.
- Find your workload and click its Name. The Deployment Details page appears.
- Find the row labeled Logs and click Container logs.
This loads Cloud Logging, showing logs for this workload only.
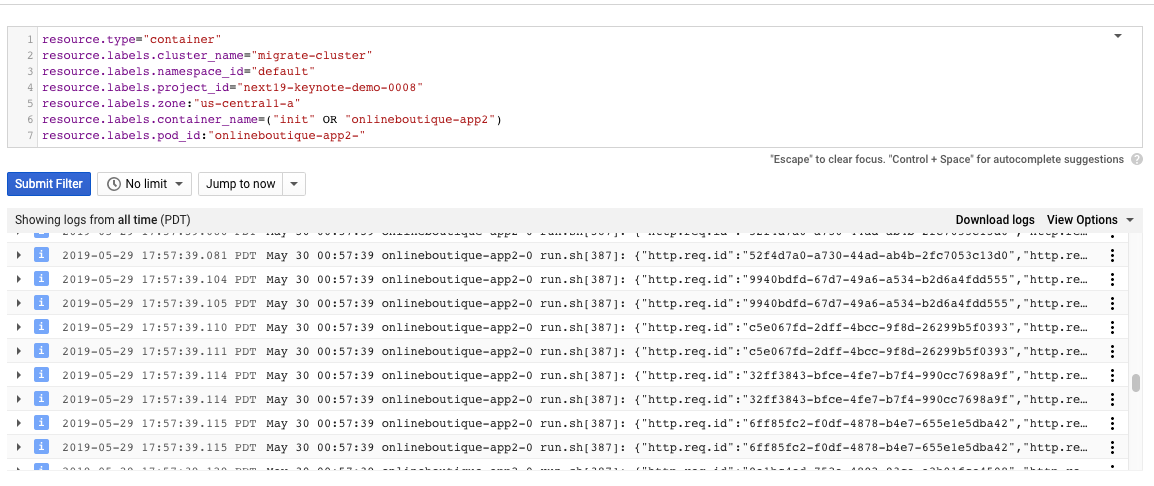
View logs in kubectl
You can use kubectl to retrieve logs from a running container. You can also
monitor the progress of export from short-term to long-term storage.
To view the logs for a pod:
Find the name of your pod from the output of
kubectl get pods. In the example below, the pod's name issuitecrm-app-0.kubectl get podsNAME READY STATUS RESTARTS AGE csi-disk-controller-0 3/3 Running 4 4d csi-disk-node-5t922 3/3 Running 3 4d csi-disk-node-5tdcp 3/3 Running 3 4d csi-disk-node-86c2t 3/3 Running 3 4d csi-disk-node-8785n 3/3 Running 3 4d suitecrm-app-0 1/1 Running 0 17hView the logs from your pod with
kubectl logs.kubectl logs [POD_NAME]I0529 07:01:26.000000 12 hclog.py:48] [suitecrm-app-0] - Auto-detected template: centos D0529 07:01:26.000000 12 hclog.py:42] [util] - SHELL OUTPUT: UNIT FILE STATE D0529 07:01:26.000000 12 hclog.py:42] [util] - SHELL OUTPUT: adservice.service enabled
The pod's recent logs are displayed.
For more information on logging and Kubernetes, see the Kubernetes Logging documentation.
What's next
- Learn how to upgrade container workloads for enhanced runtime.