本頁說明如何自訂 GKE Inference Gateway 部署作業。
本頁面適用於負責管理 GKE 基礎架構的網路專家,以及管理 AI 工作負載的平台管理員。
如要管理及最佳化推論工作負載,請設定 GKE 推論閘道的進階功能。
瞭解及設定下列進階功能:
- 如要使用 Model Armor 整合功能,請設定 AI 安全檢查。
- 如要使用 API 安全性、速率限制和分析等功能強化 GKE Inference Gateway,請設定 Apigee 進行驗證和 API 管理。
- 如要根據要求主體中的模型名稱轉送要求,請設定以主體為準的轉送規則。
- 如要查看 GKE Inference Gateway 和模型伺服器的指標和資訊主頁,並啟用 HTTP 存取記錄,請設定可觀測性。
- 如要自動調整 GKE Inference Gateway 部署作業的資源配置,請設定自動調度資源。
設定 AI 安全檢查
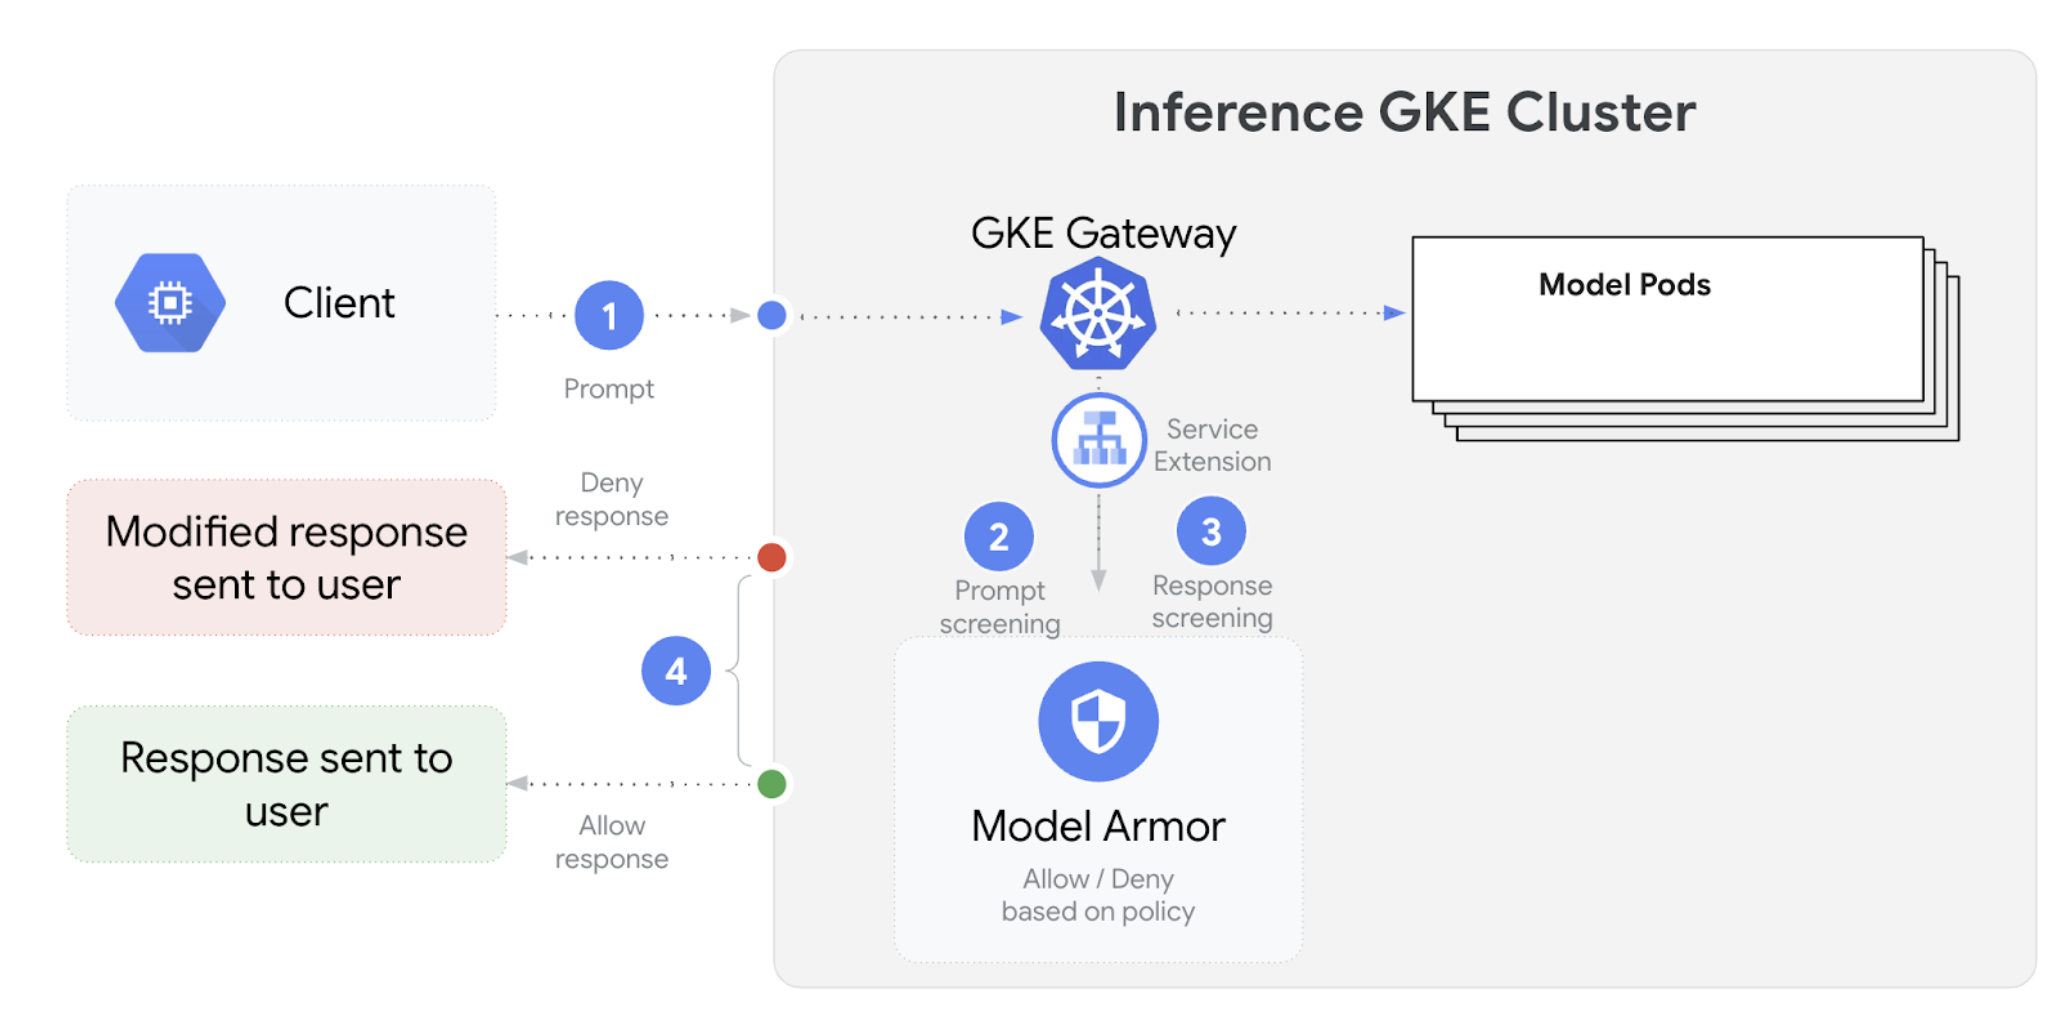
GKE Inference Gateway 會與 Model Armor 整合,對使用大型語言模型 (LLM) 的應用程式執行提示和回覆的安全檢查。這項整合功能可在基礎架構層級提供額外的安全措施,與應用程式層級的安全措施相輔相成。這樣一來,您就能集中管理所有大型語言模型流量的政策。
下圖說明 Model Armor 與 GKE 叢集上的 GKE Inference Gateway 整合:
如要設定 AI 安全性檢查,請按照下列步驟操作:
必要條件
- 在 Google Cloud 專案中啟用 Model Armor 服務。
使用 Model Armor 控制台、Google Cloud CLI 或 API,建立 Model Armor 範本。下列指令會建立名為
llm的範本,用於記錄作業及篩除有害內容。# Set environment variables PROJECT_ID=$(gcloud config get-value project) # Replace <var>CLUSTER_LOCATION<var> with the location of your GKE cluster. For example, `us-central1`. LOCATION="CLUSTER_LOCATION" MODEL_ARMOR_TEMPLATE_NAME=llm # Set the regional API endpoint gcloud config set api_endpoint_overrides/modelarmor \ "https://modelarmor.$LOCATION.rep.googleapis.com/" # Create the template gcloud model-armor templates create $MODEL_ARMOR_TEMPLATE_NAME \ --location $LOCATION \ --pi-and-jailbreak-filter-settings-enforcement=enabled \ --pi-and-jailbreak-filter-settings-confidence-level=MEDIUM_AND_ABOVE \ --rai-settings-filters='[{ "filterType": "HATE_SPEECH", "confidenceLevel": "MEDIUM_AND_ABOVE" },{ "filterType": "DANGEROUS", "confidenceLevel": "MEDIUM_AND_ABOVE" },{ "filterType": "HARASSMENT", "confidenceLevel": "MEDIUM_AND_ABOVE" },{ "filterType": "SEXUALLY_EXPLICIT", "confidenceLevel": "MEDIUM_AND_ABOVE" }]' \ --template-metadata-log-sanitize-operations \ --template-metadata-log-operations
授予 IAM 權限
Service Extensions 服務帳戶需要權限才能存取必要資源。執行下列指令,授予必要角色:
PROJECT_NUMBER=$(gcloud projects describe $PROJECT_ID --format 'get(projectNumber)')

gcloud projects add-iam-policy-binding $PROJECT_ID \
    --member=serviceAccount:service-$PROJECT_NUMBER@gcp-sa-dep.iam.gserviceaccount.com \
    --role=roles/container.admin

gcloud projects add-iam-policy-binding $PROJECT_ID \
    --member=serviceAccount:service-$PROJECT_NUMBER@gcp-sa-dep.iam.gserviceaccount.com \
    --role=roles/modelarmor.calloutUser

gcloud projects add-iam-policy-binding $PROJECT_ID \
    --member=serviceAccount:service-$PROJECT_NUMBER@gcp-sa-dep.iam.gserviceaccount.com \
    --role=roles/serviceusage.serviceUsageConsumer

gcloud projects add-iam-policy-binding $PROJECT_ID \
    --member=serviceAccount:service-$PROJECT_NUMBER@gcp-sa-dep.iam.gserviceaccount.com \
    --role=roles/modelarmor.user
設定
GCPTrafficExtension如要將 Model Armor 政策套用至 Gateway,請建立具有正確中繼資料格式的
GCPTrafficExtension資源。將下列範例資訊清單儲存為
gcp-traffic-extension.yaml:kind: GCPTrafficExtension apiVersion: networking.gke.io/v1 metadata: name: my-model-armor-extension spec: targetRefs: - group: "gateway.networking.k8s.io" kind: Gateway name: GATEWAY_NAME extensionChains: - name: my-model-armor-chain1 matchCondition: celExpressions: - celMatcher: request.path.startsWith("/") extensions: - name: my-model-armor-service supportedEvents: - RequestHeaders - RequestBody - RequestTrailers - ResponseHeaders - ResponseBody - ResponseTrailers timeout: 1s failOpen: false googleAPIServiceName: "modelarmor.${LOCATION}.rep.googleapis.com" metadata: model_armor_settings: '[{"model": "${MODEL}","model_response_template_id": "projects/${PROJECT_ID}/locations/${LOCATION}/templates/${MODEL_ARMOR_TEMPLATE_NAME}","user_prompt_template_id": "projects/${PROJECT_ID}/locations/${LOCATION}/templates/${MODEL_ARMOR_TEMPLATE_NAME}"}]'更改下列內容:
GATEWAY_NAME:閘道的名稱。MODEL_ARMOR_TEMPLATE_NAME:Model Armor 範本的名稱。
gcp-traffic-extension.yaml檔案包含下列設定:targetRefs:指定這個擴充功能適用的閘道。extensionChains:定義要套用至流量的擴充功能鏈結。matchCondition:定義套用擴充功能的條件。extensions:定義要套用的擴充功能。supportedEvents:指定擴充功能叫用的事件。timeout:指定擴充功能的逾時時間。googleAPIServiceName:指定擴充功能的服務名稱。metadata:指定擴充功能的中繼資料,包括extensionPolicy和提示或回應清除設定。
將範例資訊清單套用至叢集:
export GATEWAY_NAME="your-gateway-name"
export MODEL="google/gemma-3-1b-it" # Or your specific model
envsubst < gcp-traffic-extension.yaml | kubectl apply -f -
設定 AI 安全檢查並與 Gateway 整合後,Model Armor 會根據定義的規則自動篩選提示和回覆。
設定 Apigee 進行驗證和 API 管理
GKE Inference Gateway 與 Apigee 整合,可為推論工作負載提供驗證、授權和 API 管理功能。如要進一步瞭解使用 Apigee 的好處,請參閱「使用 Apigee 的主要好處」。
您可以將 GKE 推論閘道與 Apigee 整合,透過 API 安全性、速率限制、配額、數據分析和營利等功能,提升 GKE 推論閘道效能。
必要條件
開始之前,請確認您具備以下項目:
- 執行 1.34.* 以上版本的 GKE 叢集。
- 已部署 GKE Inference Gateway 的 GKE 叢集。
- 在與 GKE 叢集相同的地區中建立 Apigee 執行個體。
- 安裝在 GKE 叢集中的 Apigee APIM 運算子及其 CRD。如需操作說明,請參閱「安裝 Apigee APIM 運算子」。
kubectl已設定為連線至 GKE 叢集。Google Cloud CLI已安裝並通過驗證。
建立 ApigeeBackendService
首先,請建立 ApigeeBackendService 資源。GKE Inference Gateway 會使用這項資訊建立 Apigee 擴充功能處理器。
將下列資訊清單儲存為
my-apigee-backend-service.yaml:apiVersion: apim.googleapis.com/v1 kind: ApigeeBackendService metadata: name: my-apigee-backend-service spec: apigeeEnv: "APIGEE_ENVIRONMENT_NAME" # optional field defaultSecurityEnabled: true # optional field locations: name: "LOCATION" network: "CLUSTER_NETWORK" subnetwork: "CLUSTER_SUBNETWORK"更改下列內容:
APIGEE_ENVIRONMENT_NAME:Apigee 環境的名稱。注意:如果apigee-apim-operator是使用generateEnv=TRUE旗標安裝,就不需要設定這個欄位。如果沒有,請按照「建立環境」一文的操作說明建立 Apigee 環境。LOCATION:Apigee 執行個體的位置。CLUSTER_NETWORK:GKE 叢集的網路。CLUSTER_SUBNETWORK:GKE 叢集的子網路。
將資訊清單套用至叢集:
kubectl apply -f my-apigee-backend-service.yaml確認狀態是否已變更為
CREATED:kubectl wait --for=jsonpath='{.status.currentState}'="CREATED" -f my-apigee-backend-service.yaml --timeout=5m
設定 GKE Inference Gateway
設定 GKE Inference Gateway,啟用 Apigee 擴充功能處理器做為負載平衡器流量擴充功能。
將下列資訊清單儲存為
my-apigee-traffic-extension.yaml:kind: GCPTrafficExtension apiVersion: networking.gke.io/v1 metadata: name: my-apigee-traffic-extension spec: targetRefs: - group: "gateway.networking.k8s.io" kind: Gateway name: GATEWAY_NAME extensionChains: - name: my-traffic-extension-chain matchCondition: celExpressions: - celMatcher: request.path.startsWith("/") extensions: - name: my-apigee-extension metadata: # The value for `apigee-extension-processor` must match the name of the `ApigeeBackendService` resource that was applied earlier. apigee-extension-processor: my-apigee-backend-service failOpen: false timeout: 1s supportedEvents: - RequestHeaders - ResponseHeaders - ResponseBody backendRef: group: apim.googleapis.com kind: ApigeeBackendService name: my-apigee-backend-service port: 443將
GATEWAY_NAME替換為閘道名稱。將資訊清單套用至叢集:
kubectl apply -f my-apigee-traffic-extension.yaml等待
GCPTrafficExtension狀態變成Programmed:kubectl wait --for=jsonpath='{.status.ancestors[0].conditions[?(@.type=="Programmed")].status}'=True -f my-apigee-traffic-extension.yaml --timeout=5m
使用 API 金鑰傳送通過驗證的要求
如要找出 GKE Inference Gateway 的 IP 位址,請檢查 Gateway 狀態:
GW_IP=$(kubectl get gateway/GATEWAY_NAME -o jsonpath='{.status.addresses[0].value}')將
GATEWAY_NAME替換為閘道名稱。測試未經驗證的要求。這項要求應遭拒:
curl -i ${GW_IP}/v1/completions -H 'Content-Type: application/json' -d '{
"model": "food-review",
"prompt": "Write as if you were a critic: San Francisco",
"max_tokens": 100,
"temperature": 0
}'
畫面會顯示類似以下的回應,表示 Apigee 擴充功能運作正常:
{"fault":{"faultstring":"Raising fault. Fault name : RF-insufficient-request-raise-fault","detail":{"errorcode":"steps.raisefault.RaiseFault"}}}存取 Apigee UI 並建立 API 金鑰。如需相關操作說明,請參閱「建立 API 金鑰」一節。
在 HTTP 要求標頭中傳送 API 金鑰:
curl -i ${GW_IP}/v1/completions -H 'Content-Type: application/json' -H 'x-api-key: API_KEY' -d '{
"model": "food-review",
"prompt": "Write as if you were a critic: San Francisco",
"max_tokens": 100,
"temperature": 0
}'
然後將
API_KEY替換成您的 API 金鑰。
如要進一步瞭解如何設定 Apigee 政策,請參閱「Use API management policies with the Apigee APIM Operator for Kubernetes」(搭配 Kubernetes 適用的 Apigee APIM 運算子使用 API 管理政策)。
設定可觀測性
GKE 推論閘道可深入分析推論工作負載的健康狀態、效能和行為。這有助於找出及解決問題、盡可能提高資源使用率,並確保應用程式的可靠性。
Google Cloud 提供下列 Cloud Monitoring 資訊主頁,可為 GKE Inference Gateway 提供推論觀測功能:
- GKE Inference Gateway 資訊主頁:提供 LLM 服務的黃金指標,例如要求和權杖處理量、延遲時間、錯誤,以及
InferencePool的快取用量。如要查看可用的 GKE Inference Gateway 指標完整清單,請參閱「公開指標」。 - AI/機器學習可觀測性資訊主頁:提供基礎架構用量、DCGM 指標和 vLLM 模型效能指標的資訊主頁。
- 模型伺服器資訊主頁:提供模型伺服器關鍵信號的資訊主頁。您可以藉此監控模型伺服器的負載和效能,例如
KVCache Utilization和Queue length。 - 負載平衡器資訊主頁:回報負載平衡器的指標,例如每秒要求數、端對端要求服務延遲時間,以及要求-回應狀態碼。這些指標有助於瞭解端對端要求服務的效能,並找出錯誤。
- Data Center GPU Manager (DCGM) 指標:提供 DCGM 指標,例如 NVIDIA GPU 的效能和使用率。您可以在 Cloud Monitoring 中設定 DCGM 指標。詳情請參閱「收集及查看 DCGM 指標」。
查看 GKE 推論閘道資訊主頁
如要查看 GKE Inference Gateway 資訊主頁,請按照下列步驟操作:
前往 Google Cloud 控制台的「Monitoring」頁面。
在導覽窗格中,選取「Dashboards」(資訊主頁)。
在「整合」部分中,選取「GMP」。
在「Cloud Monitoring Dashboard Templates」(Cloud Monitoring 資訊主頁範本) 頁面中,搜尋「Gateway」。
查看 GKE 推論閘道資訊主頁。
或者,您也可以按照「監控資訊主頁」中的操作說明進行。
查看 AI/機器學習模型觀測能力資訊主頁
如要查看已部署的模型和資訊主頁,瞭解模型的觀測指標,請按照下列步驟操作:
前往 Google Cloud 控制台的「Deployed Models」(已部署模型) 頁面。
如要查看特定部署作業的詳細資料,包括指標、記錄和資訊主頁,請按一下清單中的模型名稱。
在模型詳細資料頁面中,按一下「可觀測性」分頁標籤,即可查看下列資訊主頁。如果系統提示,請點選「啟用」來啟用資訊主頁。
- 「基礎架構用量」資訊主頁會顯示使用率指標。
- 「DCGM」DCGM資訊主頁會顯示 DCGM 指標。
- 如果您使用 vLLM,系統會提供「模型效能」資訊主頁,並顯示 vLLM 模型效能的指標。
設定模型伺服器觀測資訊主頁
如要從每個模型伺服器收集黃金信號,並瞭解哪些因素會影響 GKE Inference Gateway 效能,您可以為模型伺服器設定自動監控功能。包括下列模型伺服器:
如要查看整合資訊主頁,請先確保您正在從模型伺服器收集指標。然後執行下列步驟:
前往 Google Cloud 控制台的「Monitoring」頁面。
在導覽窗格中,選取「Dashboards」(資訊主頁)。
選取「整合」下方的「GMP」。 系統會顯示相應的整合資訊主頁。
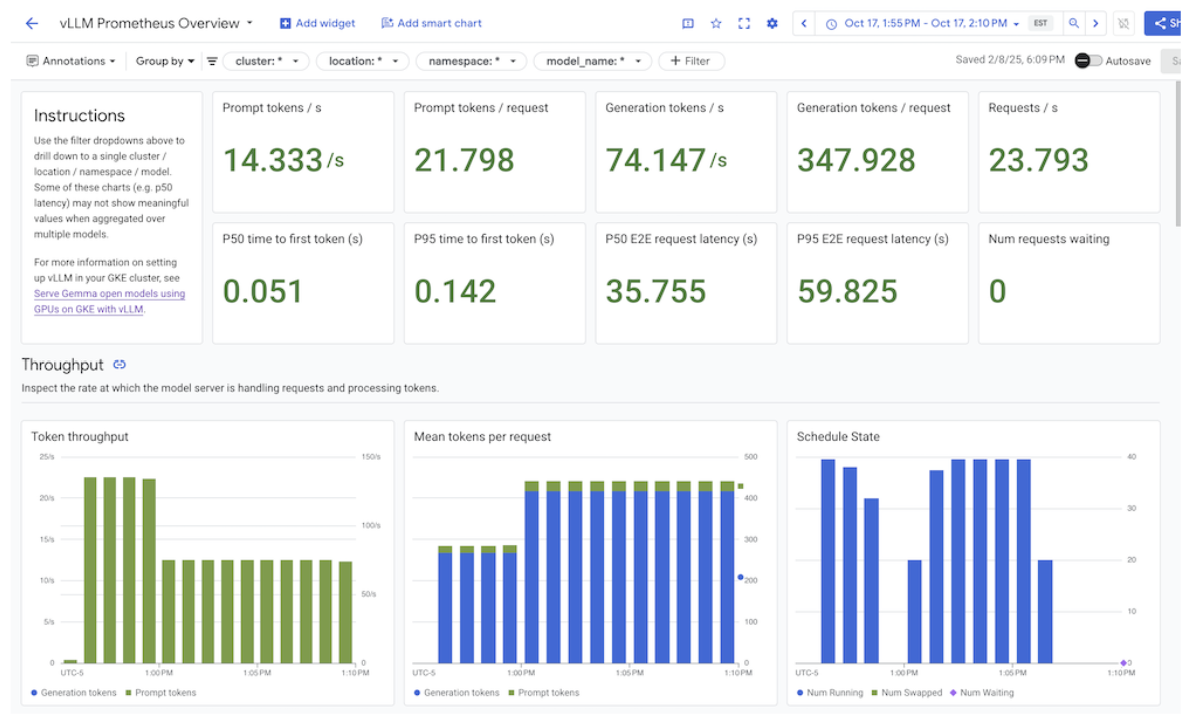
圖: 整合資訊主頁
詳情請參閱「自訂應用程式的監控設定」。
設定 Cloud Monitoring 快訊
如要為 GKE Inference Gateway 設定 Cloud Monitoring 快訊,請完成下列步驟:
將下列範例資訊清單儲存為
alerts.yaml,並視需要修改門檻:groups: - name: gateway-api-inference-extension rules: - alert: HighInferenceRequestLatencyP99 annotations: title: 'High latency (P99) for model {{ $labels.model_name }}' description: 'The 99th percentile request duration for model {{ $labels.model_name }} and target model {{ $labels.target_model_name }} has been consistently above 10.0 seconds for 5 minutes.' expr: histogram_quantile(0.99, rate(inference_model_request_duration_seconds_bucket[5m])) > 10.0 for: 5m labels: severity: 'warning' - alert: HighInferenceErrorRate annotations: title: 'High error rate for model {{ $labels.model_name }}' description: 'The error rate for model {{ $labels.model_name }} and target model {{ $labels.target_model_name }} has been consistently above 5% for 5 minutes.' expr: sum by (model_name) (rate(inference_model_request_error_total[5m])) / sum by (model_name) (rate(inference_model_request_total[5m])) > 0.05 for: 5m labels: severity: 'critical' impact: 'availability' - alert: HighInferencePoolAvgQueueSize annotations: title: 'High average queue size for inference pool {{ $labels.name }}' description: 'The average number of requests pending in the queue for inference pool {{ $labels.name }} has been consistently above 50 for 5 minutes.' expr: inference_pool_average_queue_size > 50 for: 5m labels: severity: 'critical' impact: 'performance' - alert: HighInferencePoolAvgKVCacheUtilization annotations: title: 'High KV cache utilization for inference pool {{ $labels.name }}' description: 'The average KV cache utilization for inference pool {{ $labels.name }} has been consistently above 90% for 5 minutes, indicating potential resource exhaustion.' expr: inference_pool_average_kv_cache_utilization > 0.9 for: 5m labels: severity: 'critical' impact: 'resource_exhaustion'如要建立快訊政策,請執行下列指令:
gcloud alpha monitoring policies migrate --policies-from-prometheus-alert-rules-yaml=alerts.yaml
修改快訊
如要查看最新指標的完整清單,請前往 kubernetes-sigs/gateway-api-inference-extension GitHub 存放區,您也可以使用其他指標,將新快訊附加至資訊清單。
如要修改範例快訊,請參考以下範例:
  - alert: HighInferenceRequestLatencyP99
    annotations:
      title: 'High latency (P99) for model {{ $labels.model_name }}'
      description: 'The 99th percentile request duration for model {{ $labels.model_name }} and target model {{ $labels.target_model_name }} has been consistently above 10.0 seconds for 5 minutes.'
    expr: histogram_quantile(0.99, rate(inference_model_request_duration_seconds_bucket[5m])) > 10.0
    for: 5m
    labels:
      severity: 'warning'
如果要求時間的第 99 個百分位數超過 10 秒,這項快訊就會觸發。您可以修改快訊的 expr 部分,根據需求調整門檻。
設定 GKE Inference Gateway 的記錄功能
設定 GKE Inference Gateway 的記錄功能,可提供要求和回應的詳細資訊,有助於進行疑難排解、稽核和效能分析。HTTP 存取記錄會記錄每個要求和回應,包括標頭、狀態碼和時間戳記。這類詳細資料有助於找出問題、錯誤,以及瞭解推論工作負載的行為。
如要為 GKE Inference Gateway 設定記錄功能,請為每個 InferencePool 物件啟用 HTTP 存取記錄。
將下列範例資訊清單儲存為
logging-backend-policy.yaml:apiVersion: networking.gke.io/v1 kind: GCPBackendPolicy metadata: name: logging-backend-policy namespace: NAMESPACE_NAME spec: default: logging: enabled: true sampleRate: 500000 targetRef: group: inference.networking.x-k8s.io kind: InferencePool name: INFERENCE_POOL_NAME更改下列內容:
NAMESPACE_NAME:部署InferencePool的命名空間名稱。INFERENCE_POOL_NAME:InferencePool的名稱。
將範例資訊清單套用至叢集:
kubectl apply -f logging-backend-policy.yaml
套用這份資訊清單後,GKE Inference Gateway 會為指定的 InferencePool 啟用 HTTP 存取記錄。您可以在 Cloud Logging 中查看這些記錄。記錄檔會詳細列出每項要求和回應的資訊,例如要求網址、標頭、回應狀態碼和延遲時間。
建立記錄指標,查看錯誤詳細資料
您可以使用記錄指標分析負載平衡記錄,並擷取錯誤詳細資料。每個 GKE Gateway 類別 (例如 gke-l7-global-external-managed 和 gke-l7-regional-internal-managed Gateway 類別) 都由不同的負載平衡器支援。詳情請參閱 GatewayClass 功能。
每個負載平衡器都有不同的受監控資源,您在建立以記錄為準的指標時必須使用這些資源。如要進一步瞭解各負載平衡器的受監控資源,請參閱下列文章:
- 區域性外部負載平衡器:外部 HTTP(S) 負載平衡器的記錄檔指標
- 內部負載平衡器:內部 HTTP(S) 負載平衡器的記錄指標
如要建立記錄指標來查看錯誤詳細資料,請按照下列步驟操作:
建立名為
error_detail_metric.json的 JSON 檔案,並加入下列LogMetric定義。這項設定會建立指標,從負載平衡器記錄中擷取proxyStatus欄位。{ "description": "Metric to extract error details from load balancer logs.", "filter": "resource.type=\"MONITORED_RESOURCE\"", "metricDescriptor": { "metricKind": "DELTA", "valueType": "INT64", "labels": [ { "key": "error_detail", "valueType": "STRING", "description": "The detailed error string from the load balancer." } ] }, "labelExtractors": { "error_detail": "EXTRACT(jsonPayload.proxyStatus)" } }將
MONITORED_RESOURCE替換為負載平衡器的受監控資源。開啟 Cloud Shell 或已安裝 gcloud CLI 的本機終端機。
如要建立指標,請執行
gcloud logging metrics create指令並加上--config-from-file旗標:gcloud logging metrics create error_detail_metric \ --config-from-file=error_detail_metric.json
建立指標後,您可以在 Cloud Monitoring 中使用該指標,查看負載平衡器回報的錯誤分布情形。詳情請參閱「建立記錄指標」。
如要進一步瞭解如何根據記錄指標建立快訊,請參閱在計數器指標上建立快訊政策。
設定自動調度資源功能
自動調度資源功能會根據負載變化調整資源分配,並依據需求動態新增或移除 Pod,維持效能和資源效率。如果是 GKE Inference Gateway,這會涉及每個 InferencePool 中 Pod 的水平自動調度資源。GKE 水平 Pod 自動配置器 (HPA) 會根據模型伺服器指標 (例如 KVCache Utilization) 自動調度 Pod。這可確保推論服務能處理不同的工作負載和查詢量,同時有效管理資源用量。
如要設定 InferencePool 執行個體,使其根據 GKE Inference Gateway 產生的指標自動調度資源,請執行下列步驟:
在叢集中部署
PodMonitoring物件,收集 GKE Inference Gateway 產生的指標。詳情請參閱「設定可觀測性」。部署自訂指標 Stackdriver 轉接器,授予 HPA 指標存取權:
將下列範例資訊清單儲存為
adapter_new_resource_model.yaml:apiVersion: v1 kind: Namespace metadata: name: custom-metrics --- apiVersion: v1 kind: ServiceAccount metadata: name: custom-metrics-stackdriver-adapter namespace: custom-metrics --- apiVersion: rbac.authorization.k8s.io/v1 kind: ClusterRoleBinding metadata: name: custom-metrics:system:auth-delegator roleRef: apiGroup: rbac.authorization.k8s.io kind: ClusterRole name: system:auth-delegator subjects: - kind: ServiceAccount name: custom-metrics-stackdriver-adapter namespace: custom-metrics --- apiVersion: rbac.authorization.k8s.io/v1 kind: RoleBinding metadata: name: custom-metrics-auth-reader namespace: kube-system roleRef: apiGroup: rbac.authorization.k8s.io kind: Role name: extension-apiserver-authentication-reader subjects: - kind: ServiceAccount name: custom-metrics-stackdriver-adapter namespace: custom-metrics --- apiVersion: rbac.authorization.k8s.io/v1 kind: ClusterRole metadata: name: custom-metrics-resource-reader rules: - apiGroups: - "" resources: - pods - nodes - nodes/stats verbs: - get - list - watch --- apiVersion: rbac.authorization.k8s.io/v1 kind: ClusterRoleBinding metadata: name: custom-metrics-resource-reader roleRef: apiGroup: rbac.authorization.k8s.io kind: ClusterRole name: custom-metrics-resource-reader subjects: - kind: ServiceAccount name: custom-metrics-stackdriver-adapter namespace: custom-metrics --- apiVersion: apps/v1 kind: Deployment metadata: name: custom-metrics-stackdriver-adapter labels: run: custom-metrics-stackdriver-adapter k8s-app: custom-metrics-stackdriver-adapter spec: replicas: 1 selector: matchLabels: run: custom-metrics-stackdriver-adapter k8s-app: custom-metrics-stackdriver-adapter template: metadata: labels: run: custom-metrics-stackdriver-adapter k8s-app: custom-metrics-stackdriver-adapter kubernetes.io/cluster-service: "true" spec: serviceAccountName: custom-metrics-stackdriver-adapter containers: - image: gcr.io/gke-release/custom-metrics-stackdriver-adapter:v0.15.2-gke.1 imagePullPolicy: Always name: pod-custom-metrics-stackdriver-adapter command: - /adapter - --use-new-resource-model=true - --fallback-for-container-metrics=true resources: limits: cpu: 250m memory: 200Mi requests: cpu: 250m memory: 200Mi --- apiVersion: v1 kind: Service metadata: labels: run: custom-metrics-stackdriver-adapter k8s-app: custom-metrics-stackdriver-adapter kubernetes.io/cluster-service: 'true' kubernetes.io/name: Adapter name: custom-metrics-stackdriver-adapter namespace: custom-metrics spec: ports: - port: 443 protocol: TCP targetPort: 443 selector: run: custom-metrics-stackdriver-adapter k8s-app: custom-metrics-stackdriver-adapter type: ClusterIP --- apiVersion: apiregistration.k8s.io/v1 kind: APIService metadata: name: v1beta1.custom.metrics.k8s.io spec: insecureSkipTLSVerify: true group: custom.metrics.k8s.io groupPriorityMinimum: 100 versionPriority: 100 service: name: custom-metrics-stackdriver-adapter namespace: custom-metrics version: v1beta1 --- apiVersion: apiregistration.k8s.io/v1 kind: APIService metadata: name: v1beta2.custom.metrics.k8s.io spec: insecureSkipTLSVerify: true group: custom.metrics.k8s.io groupPriorityMinimum: 100 versionPriority: 200 service: name: custom-metrics-stackdriver-adapter namespace: custom-metrics version: v1beta2 --- apiVersion: apiregistration.k8s.io/v1 kind: APIService metadata: name: v1beta1.external.metrics.k8s.io spec: insecureSkipTLSVerify: true group: external.metrics.k8s.io groupPriorityMinimum: 100 versionPriority: 100 service: name: custom-metrics-stackdriver-adapter namespace: custom-metrics version: v1beta1 --- apiVersion: rbac.authorization.k8s.io/v1 kind: ClusterRole metadata: name: external-metrics-reader rules: - apiGroups: - "external.metrics.k8s.io" resources: - "*" verbs: - list - get - watch --- apiVersion: rbac.authorization.k8s.io/v1 kind: ClusterRoleBinding metadata: name: external-metrics-reader roleRef: apiGroup: rbac.authorization.k8s.io kind: ClusterRole name: external-metrics-reader subjects: - kind: ServiceAccount name: horizontal-pod-autoscaler namespace: kube-system將範例資訊清單套用至叢集:
kubectl apply -f adapter_new_resource_model.yaml
如要授予轉接程式權限,從專案讀取指標,請執行下列指令:
$ PROJECT_ID=PROJECT_ID
$ PROJECT_NUMBER=$(gcloud projects describe PROJECT_ID --format="value(projectNumber)")
$ gcloud projects add-iam-policy-binding projects/PROJECT_ID \
  --role roles/monitoring.viewer \
  --member=principal://iam.googleapis.com/projects/PROJECT_NUMBER/locations/global/workloadIdentityPools/$PROJECT_ID.svc.id.goog/subject/ns/custom-metrics/sa/custom-metrics-stackdriver-adapter
將
PROJECT_ID替換為您的 Google Cloud 專案 ID。針對每個
InferencePool,部署類似下列的 HPA:apiVersion: autoscaling/v2 kind: HorizontalPodAutoscaler metadata: name: INFERENCE_POOL_NAME namespace: INFERENCE_POOL_NAMESPACE spec: scaleTargetRef: apiVersion: apps/v1 kind: Deployment name: INFERENCE_POOL_NAME minReplicas: MIN_REPLICAS maxReplicas: MAX_REPLICAS metrics: - type: External external: metric: name: prometheus.googleapis.com|inference_pool_average_kv_cache_utilization|gauge selector: matchLabels: metric.labels.name: INFERENCE_POOL_NAME resource.labels.cluster: CLUSTER_NAME resource.labels.namespace: INFERENCE_POOL_NAMESPACE target: type: AverageValue averageValue: TARGET_VALUE更改下列內容:
INFERENCE_POOL_NAME:InferencePool的名稱。INFERENCE_POOL_NAMESPACE:InferencePool的命名空間。CLUSTER_NAME:叢集名稱。MIN_REPLICAS:最低供應量 (基準容量)。InferencePool當用量低於 HPA 目標門檻時,HPA 會維持這個備用資源數量。高可用性工作負載必須將此值設為高於1的值,確保 Pod 中斷期間的持續可用性。MAX_REPLICAS:這個值會限制必須指派給InferencePool中託管工作負載的加速器數量。HPA 不會將備用資源數量增加到超過這個值。在流量高峰期間,請監控副本數量,確保MAX_REPLICAS欄位的值提供足夠的空間,讓工作負載能夠擴充,維持所選工作負載的效能特徵。TARGET_VALUE:代表每個模型伺服器所選目標的KV-Cache Utilization值。這是介於 0 到 100 之間的數字,且高度取決於模型伺服器、模型、加速器和傳入流量特徵。您可以透過負載測試和繪製輸送量與延遲時間的圖表,實驗性地判斷這個目標值。從圖表中選取所選的輸送量和延遲時間組合,並使用對應的KV-Cache Utilization值做為 HPA 目標。您必須調整並密切監控這個值,才能達到所選的價格與效能結果。您可以使用 GKE Inference Quickstart 自動判斷這個值。
後續步驟
- 瞭解 GKE 推論閘道。
- 部署 GKE Inference Gateway。
- 管理 GKE Inference Gateway 推出作業。
- 使用 GKE Inference Gateway 提供服務。