In the Dataflow monitoring interface, the Step info panel shows information about individual steps in a job. A step represents a single transform in your pipeline. Composite transforms contain sub-steps.
The Step info panel displays the following information:
- Metrics for the step.
- Information about the step's input and output collections.
- Which stages correspond to this step.
- Side input metrics
Use the Step info panel to understand how your job performs at each step, and to find steps that can potentially be optimized.
View step information
To view step information, perform the following steps:
In the Google Cloud console, go to the Dataflow > Jobs page.
Select a job.
Click the Job graph tab to view the job graph. The job graph represents each step in the pipeline as a box.
Click a step. Information about the step appears in the Step info panel.
To view substeps for a composite transform, click the Expand node arrow.
Step metrics
The Step info panel shows the following metrics for the step.
System watermark and lag
The system watermark is the latest timestamp for which all event times have been fully processed. The system watermark lag is the maximum time that an item of data has been awaiting processing.
Data watermark and lag
The data watermark is the timestamp that marks the estimated completion time of data input for this step. The data watermark lag is the difference between the latest input event time and the data watermark.
Wall time
Wall time is the total approximate time spent across all threads in all workers on the following actions:
- Initializing the step
- Processing data
- Shuffling data
- Ending the step
For composite steps, wall time equals the sum of time spent in the component steps.
Wall time can help you identify slow steps and diagnose which part of your pipeline is taking more time than required.
Bottleneck status
If Dataflow detects a bottleneck, an alert is shown, along with the cause, if known. For more information, see Troubleshoot bottlenecks.
Maximum operation latency
Maximum operation latency is the maximum time being spent in this step to process incoming messages or window expirations. This metric is measured in aggregate across steps fused into a single stage, so the value represents the entire stage.
Key parallelism
Key parallelism is the approximate number of keys in use for data processing at this step.
Input/output collections
The Step info panel shows the following information about each of the input and output collections in the step:
Throughput chart. This chart shows the throughput for the collection. You can view the chart as elements per second, or as bytes per second. For more information about this metric, see Throughput.
Count of elements added to the collection.
Estimated size of the collection, in bytes.
Optimized stages
A stage represents a single unit of work that is performed by Dataflow. When you select a step in the job graph, the Step info panel shows the names of the stages that perform this step, along with the current status, such as running, stopped, or succeeded.
To view more information about the stages in your job, use the Execution details tab.
Side input metrics
A side input is an additional input that a transform can access each time it processes an element. If a transform creates or consumes a side input, the Side Info panel shows metrics for the side input collection.
If a composite transform creates or consumes a side input, expand the composite transform until you see the specific subtransform that creates or consumes the side input. Select that subtransform to view the side input metrics.
Transforms that create a side input
If a transform creates a side input collection, the Side Input Metrics section displays the name of the collection, along with the following metrics:
- Time spent writing: The time spent writing the side input collection.
- Bytes written: The total number of bytes written to the side input collection.
- Time & bytes read from side input: A table that contains additional metrics for all transforms that consume the side input collection, called side input consumers.
The Time & bytes read from side input table contains the following information for each side input consumer:
- Side input consumer: The transform name of the side input consumer.
- Time spent reading: The time this consumer spent reading the side input collection.
- Bytes read: The number of bytes this consumer read from the side input collection.
The following image shows side input metrics for a transform that creates a side input collection:
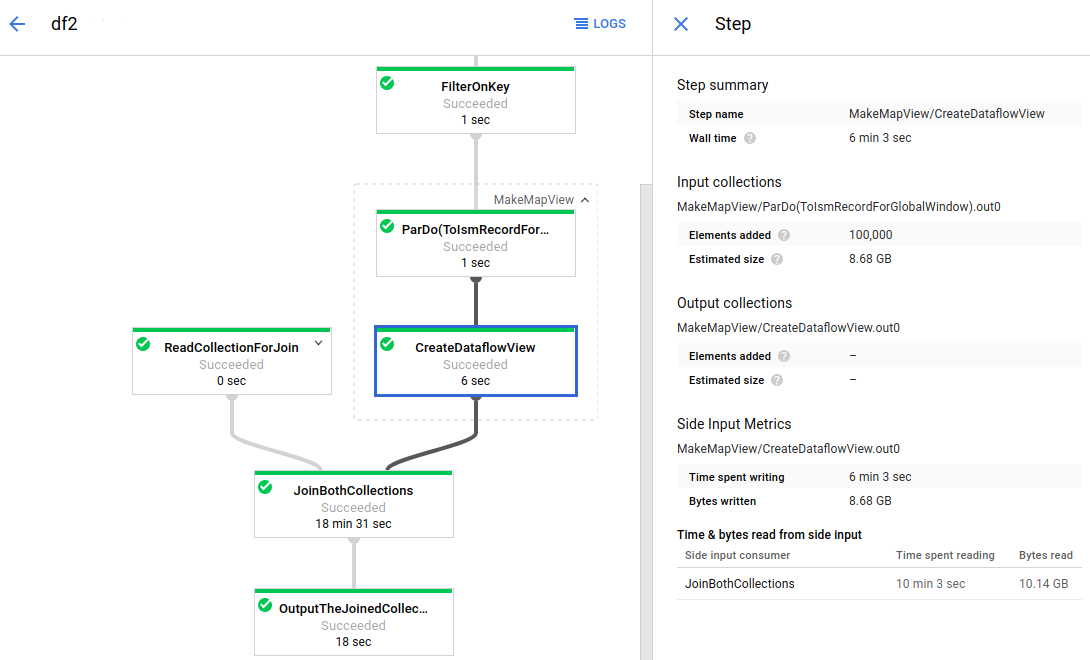
The job graph has an expanded composite transform (MakeMapView). The
subtransform that creates the side input (CreateDataflowView) is selected, and
the side input metrics are visible in the Step info panel.
Transforms that consume side inputs
If a transform consumes one or more side inputs, the Side Input Metrics section displays the Time & bytes read from side input table. This table contains the following information for each side input collection:
- Side input collection: The name of the side input collection.
- Time spent reading: The time the transform spent reading this side input collection.
- Bytes read: The number of bytes the transform read from this side input collection.
The following image shows side input metrics for a transform that reads from a side input collection.
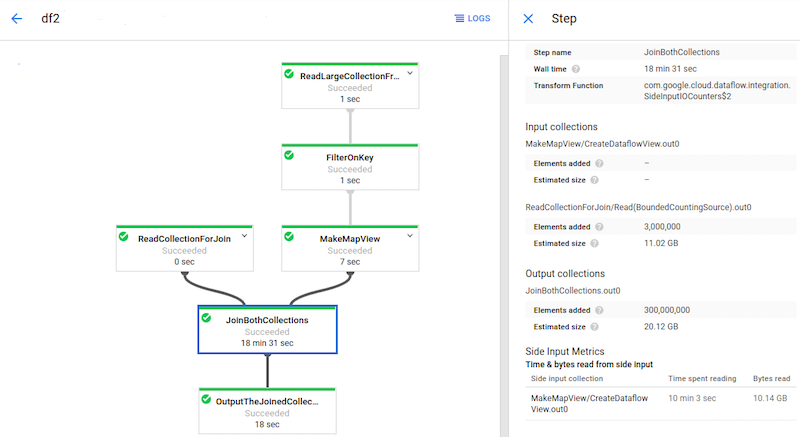
The JoinBothCollections transform reads from a side input collection.
JoinBothCollections is selected in the job graph, and the side input metrics
are visible in the Step info panel.
Identify side input performance issues
Side inputs can affect your pipeline's performance. When your pipeline uses a side input, Dataflow writes the collection to a persistent layer, such as a disk, and your transforms read from this persistent collection. These reads and writes affect your job's run time.
Reiteration is a common side input performance issue. If your side input
PCollection is too large, workers can't cache the entire collection in memory.
As a result, the workers must repeatedly read from the persistent side input
collection.
In the following image, the side input metrics show that the total bytes read from the side input collection are much larger than the collection's size, which is shown as total bytes written. The side input collection is 563 MB, and the sum of the bytes read by consuming transforms is almost 12 GB.
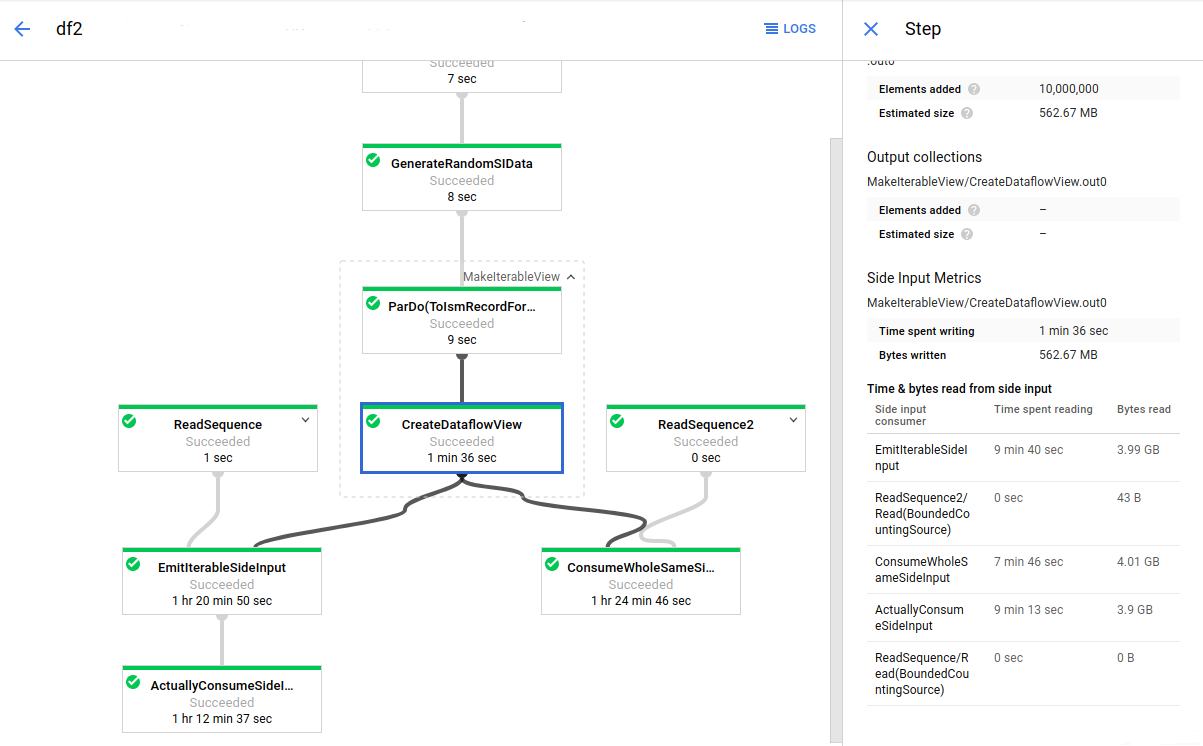
To improve the performance of this pipeline, redesign your algorithm to avoid iterating or refetching the side input data. In this example, the pipeline creates the Cartesian product of two collections. The algorithm iterates through the entire side input collection for each element of the main collection. You can improve the access pattern of the pipeline by batching multiple elements of the main collection together. This change reduces the number of times workers must re-read the side input collection.
Another common performance issue can occur if your pipeline performs a join
by applying a ParDo with one or more large side inputs. In this case, workers
spend a large percentage of the processing time for the join operation reading
from the side input collections.
The following image shows side input metrics for this issue:
The JoinBothCollections transform has a total processing time of more than 18
minutes. Workers spend the majority of the processing time (10 minutes) reading
from the 10 GB side input collection. To improve the performance of this
pipeline, use
CoGroupByKey
instead of side inputs.