This page describes how to use the Execution details tab in the Dataflow monitoring interface.
Overview
When Dataflow runs a job, it converts the steps of the pipeline into stages. Whereas each step represents an individual transform, a stage represents a single unit of work that is performed by Dataflow. To optimize the pipeline, Dataflow might fuse multiple steps into one stage.
The Execution details tab in the Dataflow monitoring interface displays information about the stages of a job. You can use the Execution details tab to troubleshoot performance issues, such as:
- Slow stages that cause performance bottlenecks
- Stuck stages that are not advancing
- Worker VMs that are lagging behind other workers
View execution details
To view the execution details for a job, perform the following steps:
In the Google Cloud console, go to the Dataflow > Jobs page.
Select a job.
Click the Execution details tab.
Select one of the following views:
- Stage progress
- Stage workflow
- Worker progress (batch jobs only)
The following sections describe each of these views.
Stage progress view
The Stage progress view lets you observe the overall progress of the job and compare relative progress between stages. The layout of the Stage progress view differs between batch jobs and streaming jobs.
Stage progress for batch jobs
For batch jobs, the Stage progress view shows the job stages in order of their start times. For each stage, it displays the following elements:
- A bar that shows the stop and end times.
- A line chart that shows the progress of the stage over time as a percentage of the stage's total work.
- The total time spent in the stage.
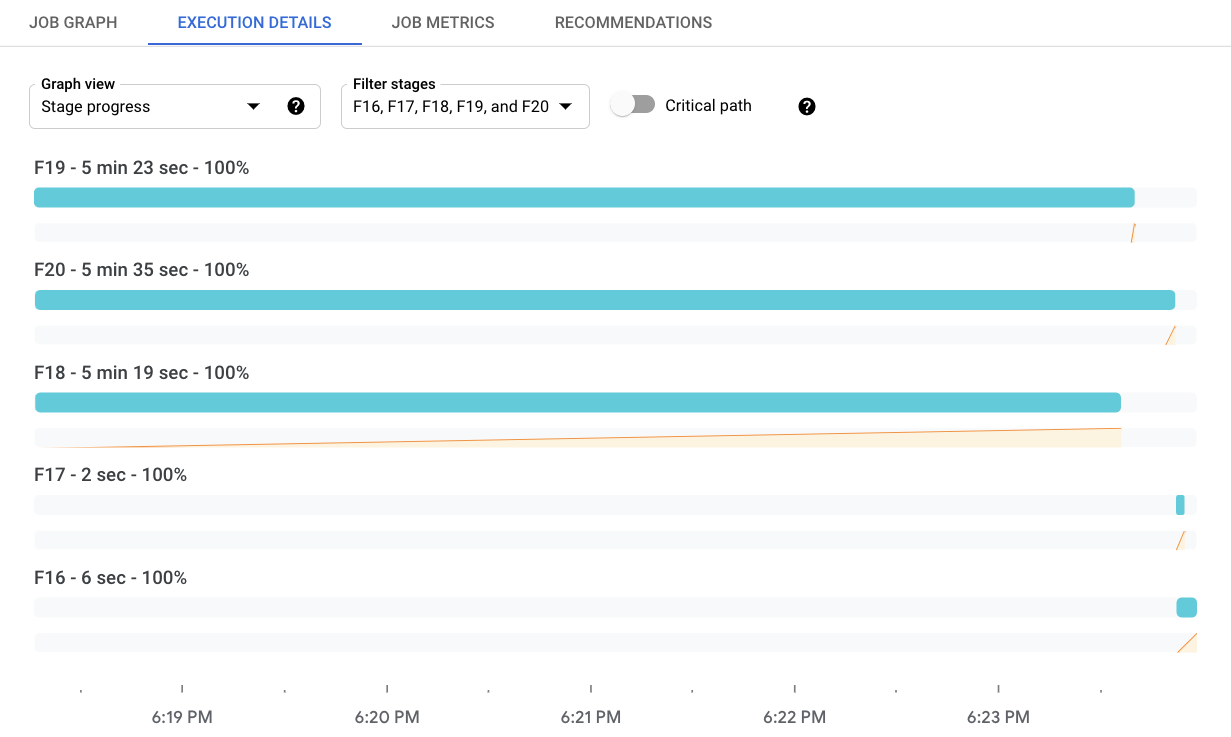
To filter which stages are displayed, click Filter stages. To view the critical path, toggle Critical path. The critical path is the sequence of stages that contribute to the overall job runtime. For example, it excludes branches that finished earlier than the overall job, and inputs that did not delay downstream processing.
The Stage Info panel shows more detailed information about a stage. To view the details for a stage, click the progress bar for that stage. The Stage Info panel shows the following information about a stage:
- Status
- Progress as a percentage
- Start and end times
- The pipeline steps that this stage encompasses
- The slowest steps by wall time
- Details about any stragglers
If the panel is not visible, click Toggle panel "Stage info".
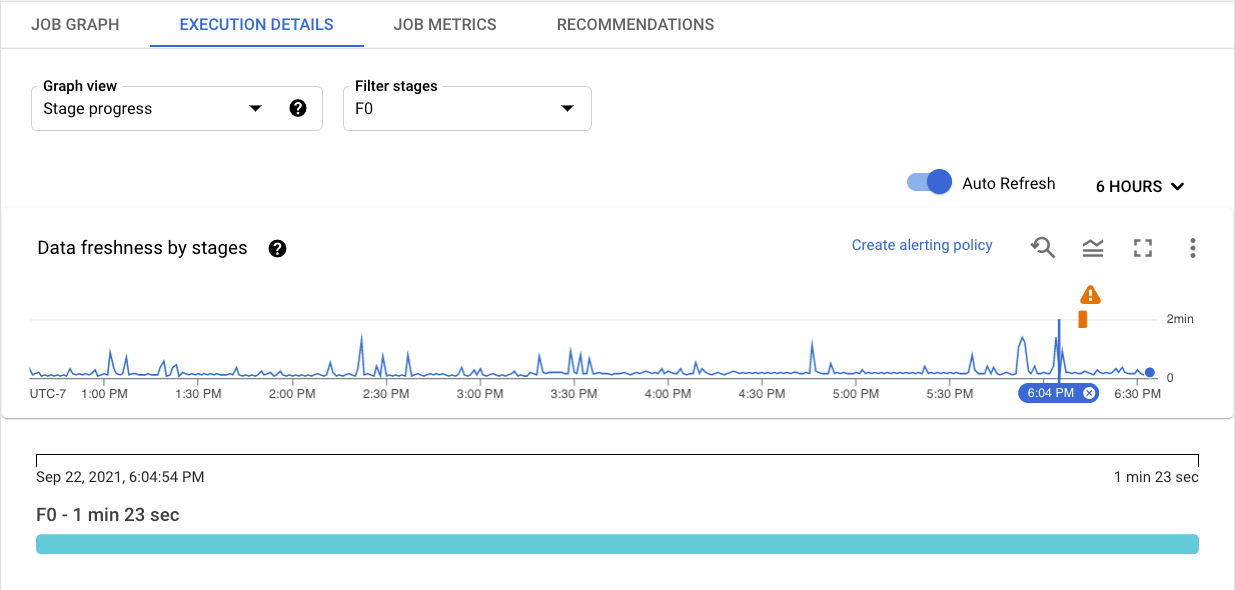
Stage progress for streaming jobs
For streaming jobs, the Stage progress view has two visualizations of data freshness. Data freshness is the difference between a data element's timestamp and the time when the element is processed. Larger values mean the pipeline is taking longer to process the input data.
The first visualization shows data freshness per stage as a line graph. To see the data freshness at a specific instant of time, hold the pointer over the graph. To select the time range, use the time picker or click the graph and drag to select the range. To filter which stages are displayed, click Filter stages.
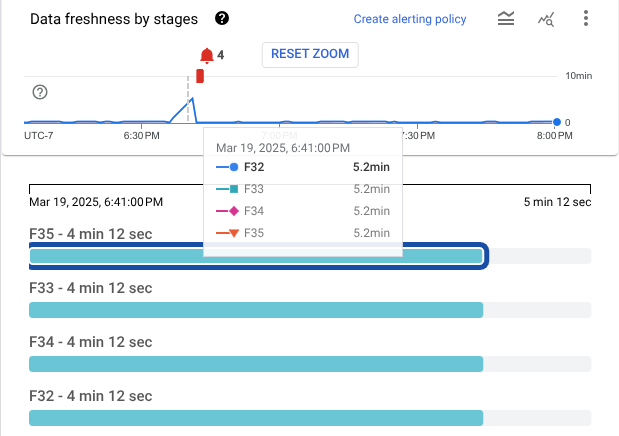
The graph also highlights anomalies in the data:
- Potential slowness: Data freshness exceeds the 95th percentile for the selected time window.
- Potential stuckness: Data freshness exceeds the 99th percentile for the selected time window.
The second visualization shows the stages as a series of bars. The stages are arranged in topological order. Stages with no descendants are shown first, followed by their descendants. The lengths of the bars represent data freshness. To see the data freshness values at a specific point, click the graph. The bars update to show data freshness at the selected time.
The following image shows a job with four stages. At the selected timestamp, the data freshness ranges from 9 seconds to 13 seconds.
The next image shows the same job with a different timestamp selected. At this point, the data freshness for all stages exceeds 4 minutes, signalling that the pipeline might be stuck.
The Stage Info panel shows more detailed information about a stage. To view the details for a stage, click the progress bar for that stage. The Stage Info panel shows the following information about a stage:
- Status
- System lag: The maximum time that an item of data has been awaiting processing
- Data watermark: The estimated completion time of data input for this stage
- Details about any stragglers
- The pipeline steps that this stage encompasses
If the panel is not visible, click Toggle panel "Stage info".
Stage workflow
Stage workflow view shows the job stages as a workflow graph. To view the details for a stage, click the box for that stage.
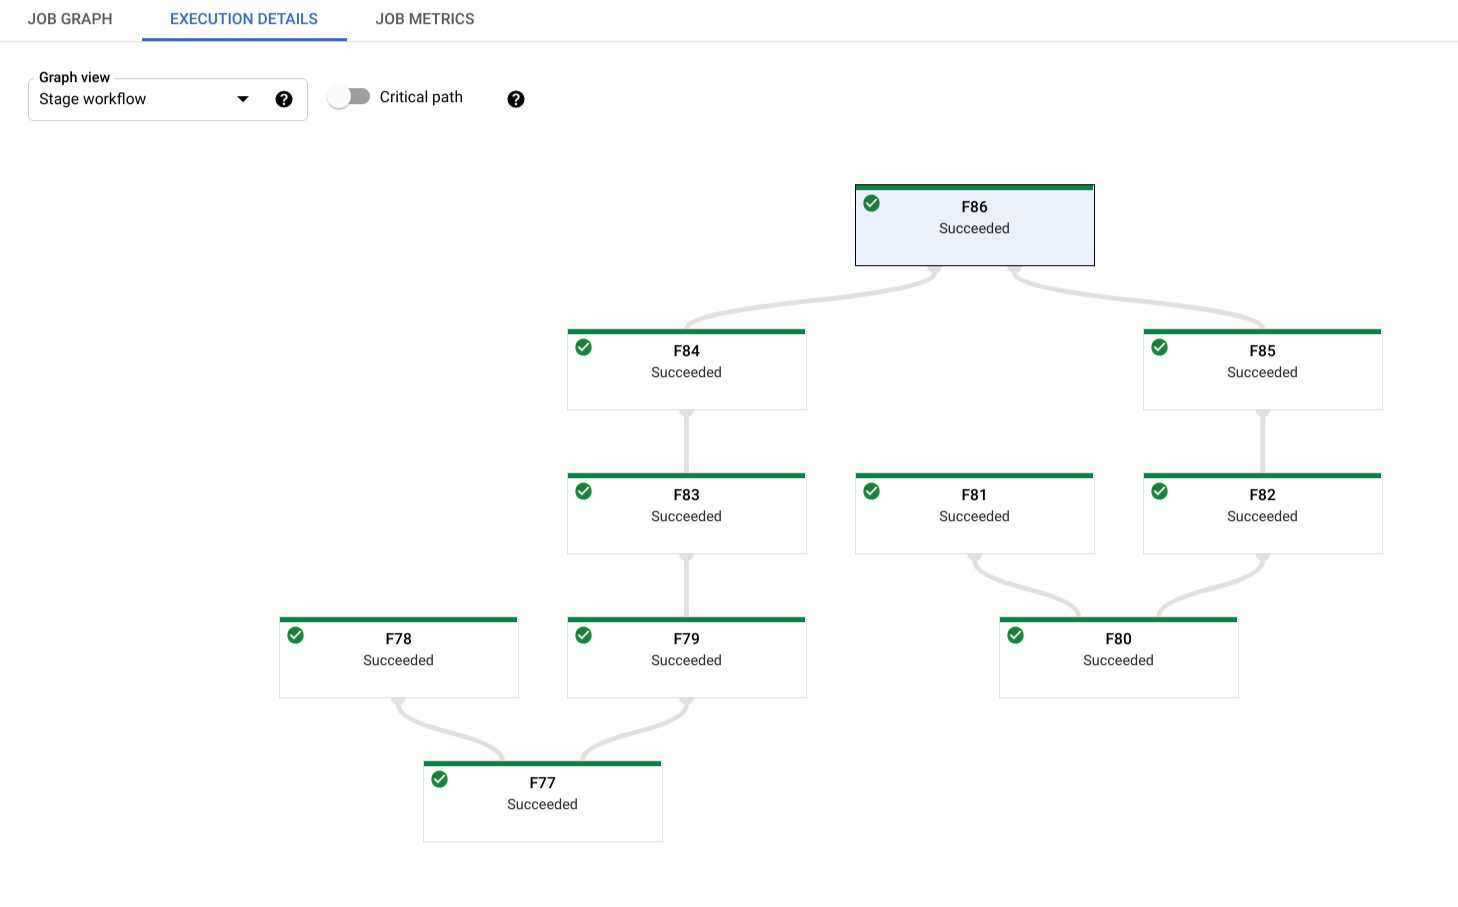
For batch jobs, click Critical path to view only the stages that directly contribute to the job's overall runtime.
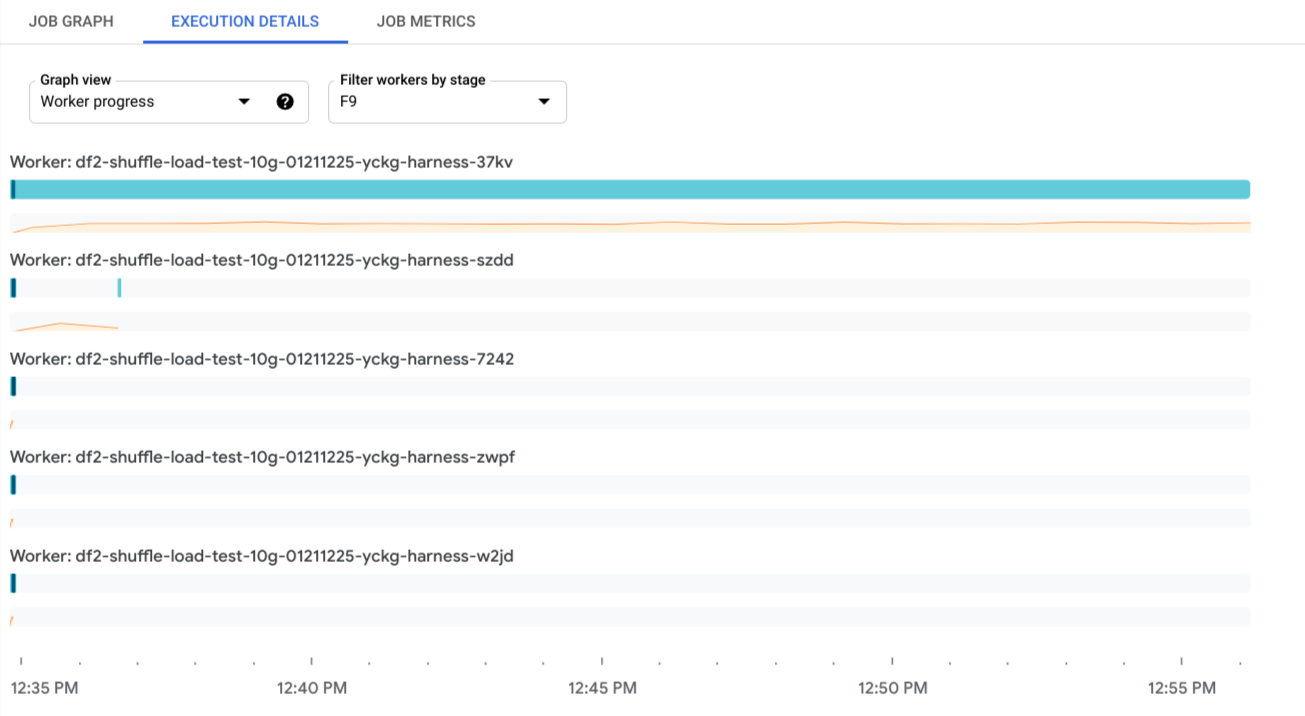
Worker progress
For batch jobs, the Worker progress view shows the workers for a particular stage. This view is not available for streaming jobs. To access this view, select Worker progress and select the stage in Filter workers by stage. Alternatively, you can activate this view from the Stage progress view as follows:
- In the Stage progress view, identify the stage that you want to view.
- Hold the pointer over the bar for that stage.
- In the Stage card, click View workers. The Worker progress view is shown with the stage pre-selected.
Each bar maps to a work item scheduled to a worker. A sparkline that tracks CPU utilization on a worker is located with each worker, making it easier to spot underutilization issues.
What's next
- Learn more about troubleshooting Dataflow pipelines.
- Read about the different components of Dataflow's web-based monitoring user interface.