Cloud Code comes with the Cloud Run Explorer; an easy way of monitoring your existing Cloud Run services and revisions, without having to leave your IDE.
Viewing service status with the Cloud Run Explorer
You can view the status of your Cloud Run services and revisions using the Cloud Run Explorer:
Navigate to the Cloud Run Explorer. It can be accessed from the side panel on the right.
The available general Cloud Run Explorer actions, accessible via their icons in the Explorer, are:
- Creating a new Cloud Run application from a sample

- Refreshing the Explorer

- Opening the Cloud Code Cloud Run documentation in a web browser

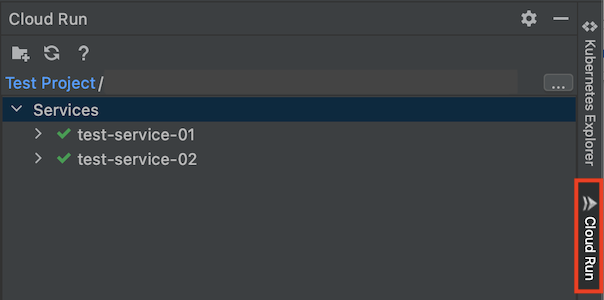
- Creating a new Cloud Run application from a sample
Click on a service or a revision in the explorer to display its properties.
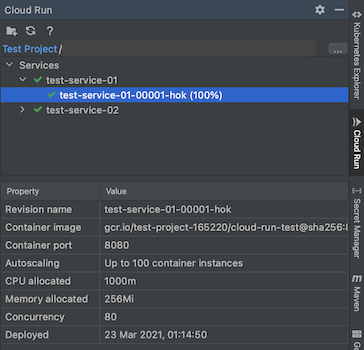
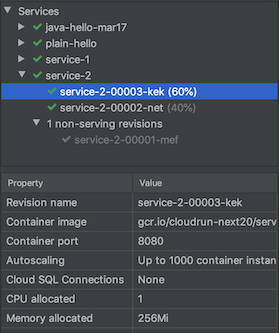
Within a service, active revisions with allocated traffic are displayed next to the revision name. Inactive revisions are grouped separately.
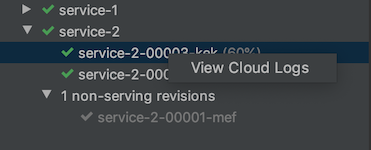
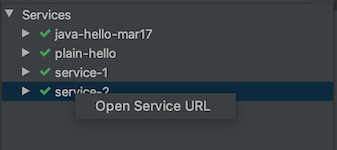
Additionally, you can right click an active resource within the Cloud Run Explorer and choose to:
Open its corresponding URL (for a service)
View logs (for a revision)
