This document describes how to view the dashboards that Application Monitoring creates for your App Hub applications, services, and workloads. These dashboards can help you understand how your application's resources are performing and to diagnose issues.
The Application Monitoring dashboards display the following:
- Log and metric data that is generated by supported infrastructure.
- OpenTelemetry-defined golden signals for traffic, latency, and error rate, when a workload runs on Google Kubernetes Engine. To learn more, see Instrument for Application Monitoring.
- Open incidents for alerting policies associated with an App Hub application.
- Information about the application, including the location, criticality, and criticality.
- For service and workload dashboards, information about the infrastructure.
To determine what data to display on the dashboards, Application Monitoring uses application-specific labels that are attached to telemetry generated by supported infrastructure. These labels identify the application. You can use these labels to filter the displayed data.
Application Monitoring dashboards don't display trace data. However, you can explore your application's trace data by using the Trace Explorer. For more information, see the Explore trace data section of this document.
Application-specific labels
This section lists the App Hub-specific labels and attributes that might be attached to your log, metric, and trace data. These labels let Google Cloud Observability construct the hierarchy of dashboards and to filter the displayed telemetry to that for a service or workload. You can also use these labels to filter your log, metric, and trace data.
In this section, interpret a.b.{x,y} as a.b.x and a.b.y.
Log labels
Log entries from Google Cloud infrastructure contain an apphub field that lists
the labels for the application and for a service or workload. The following illustrates the
format of this data:
apphub: {
  application: {
    container: "projects/my-project"
    id: "my-app"
    location: "my-app-location"
  }
  workload: {
    criticalityType: "MEDIUM"
    environmentType: "STAGING"
    id: "my-workload-id"
  }
}
Metric labels
Metric data from Google Cloud infrastructure includes the following metadata labels:
metadata.system_labels.apphub_application_{container,id,location}metadata.system_labels.apphub_{workload,service}_{criticality_type,environment_type,id}
Metric data from instrumentation you added to your applications can include the following metric labels:
metric.labels.apphub_application_{container,id,location}metric.labels.apphub_workload_{criticality_type,environment_type,id}
Trace resource attributes
Trace spans generated by instrumentation you added to your applications can include the following resource attributes:
gcp.apphub.application.{container,id,location}gcp.apphub.{workload,service}.{criticality_type,environment_type,id}
Alerting policy labels
Service and workload labels aren't automatically attached to alerting policies. However, you can associate an alerting policy with a specific workload or service by attaching all of the following labels with the following keys to the alerting policy:
apphub_application_locationapphub_application_idapphub_service_idorapphub_workload_id
When an alerting policy includes the previous keys, incidents for the policy are shown on the Application Monitoring dashboards.
For more information, see Associate an alerting policy with a service or workload.
Google Cloud console navigation when using an app-enabled folder
App Hub supports two configurations: app-enabled folder and App Hub host projects. This section applies only when you use an app-enabled folder.
When you use an app-enabled folder, the Google Cloud console automatically resets the resource picker from an app-enabled folder to the folder's management project when you navigate to an Google Cloud Observability page. If you navigate to another page in the Google Cloud console, you the resource picker is reset to the app-enabled folder.
Cloud Logging supports folders as a resource. For example, you can
create log sinks and log buckets in a folder resource. Similarly, folders
contain _Default and _Required log buckets, and you might want to view
their contents. To access the folder resource, use the resource picker and
manually select the app-enabled folder.
Before you begin
Before you can use Application Monitoring, make sure that you configure your App Hub host project or management project . This is the project that you use to view your application's telemetry data:
-
To get the permissions that you need to view log and metric data, and to create alerting policies and customize dashboards, ask your administrator to grant you the following IAM roles:
-
Logs Viewer (
roles/logging.viewer) on your App Hub host project or management project and any other projects listed its default log scope. This role grants access to most log entries in the_Defaultlog bucket. For more information, see Logging roles. -
Logs View Accessor (
roles/logging.viewAccessor) on the log views listed in the default log scope of your App Hub host project or management project . To learn more about granting access to a log view, see Control access to a log view. -
Monitoring Editor (
roles/monitoring.editor) on your App Hub host project or management project . For principals who don't need to create or modify alerting policies or dashboards, consider granting the Monitoring Viewer role (roles/monitoring.viewer). -
Cloud Trace User (
roles/cloudtrace.user) on your App Hub host project or management project , and the projects in the default trace scope. -
App Hub viewer (
roles/apphub.viewer) on your App Hub host project or management project . For more information, see App Hub roles and permissions.
For more information about granting roles, see Manage access to projects, folders, and organizations.
You might also be able to get the required permissions through custom roles or other predefined roles.
-
Logs Viewer (
Make sure that you've configured the observability scope of your App Hub host project or management project . For more information, see Set up Application Monitoring.
The observability scope controls which data is available to your App Hub host project or management project . The default settings for these scopes might not let you view all log or metric data.
Update the alerting policies that monitor your application data to include application-specific labels. For more information, see Associate an alerting policy with a service or workload.
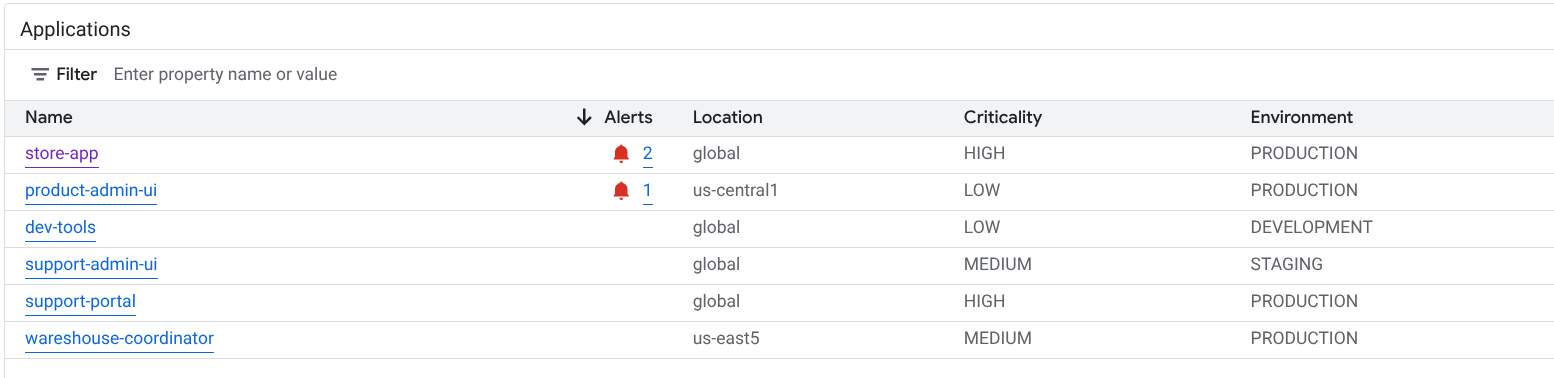
View summary of all applications
The top-level Application Monitoring dashboard provides a concise summary of the state of your registered applications. For each application, this page lists the number of open incidents and information about the location, criticality, and environment.
The following screenshot illustrates the summary dashboard:
To open the top-level dashboard, which lists summary information for your applications registered with App Hub, do the following:
-
In the Google Cloud console, go to the Application monitoring page:
If you use the search bar to find this page, then select the result whose subheading is Monitoring.
In the toolbar of the Google Cloud console, select your App Hub host project or management project .
Optional: To open an application in App Hub, click more_vert More, and select Manage in AppHub.
To open the dashboard for an application, select the application. The next section provides guidance on how to explore or interpret the telemetry.
Explore application telemetry, topology, and incidents
When you select an application listed on the Application monitoring page, the top-level overview for the application is opened. From here, you can access data that can help you understand the health of your application.
For example, you can identify a service with an active incident, and quickly determine the status of its traffic by inspecting the destination, error rate, and latency.
This page contains the following tabs:
The Overview tab, which displays summary information about your App Hub application.
The Dashboard tab, which displays golden signals, log data, and information about open incidents. For more information, see the View application telemetry section.
The Topology tab (preview), which displays a dynamic view of your application's services and dashboards, incidents, and traffic. This document doesn't describe how to view and interpret the topology map. For more information about viewing the application topology map, see View application topology.
The remainder of this document describes how to view the telemetry that is shown on the overview and dashboard tabs.
View application telemetry
To open an application's dashboard, do the following:
-
In the Google Cloud console, go to the Application monitoring page:
If you use the search bar to find this page, then select the result whose subheading is Monitoring.
- In the toolbar of the Google Cloud console, select your App Hub host project or management project .
On the Application monitoring page, select the name of an application.
The dashboard for the application opens with the Overview tab selected. This tab lists each service and workload, along with the number of open incidents and values for the golden signals:
- Traffic: Incoming request rates on the service or workload over the selected time period.
- Server error rate: Average percentage of incoming requests that generate or map to 5xx HTTP response codes over the selected time period.
- P95 latency: 95th percentile of latency for a request served over the selected time period, in milliseconds.
- Saturation: Measures how full your service or workload is. For example, for managed instance groups (MIGs), Cloud Run, and Google Kubernetes Engine deployments, this field shows the CPU utilization.
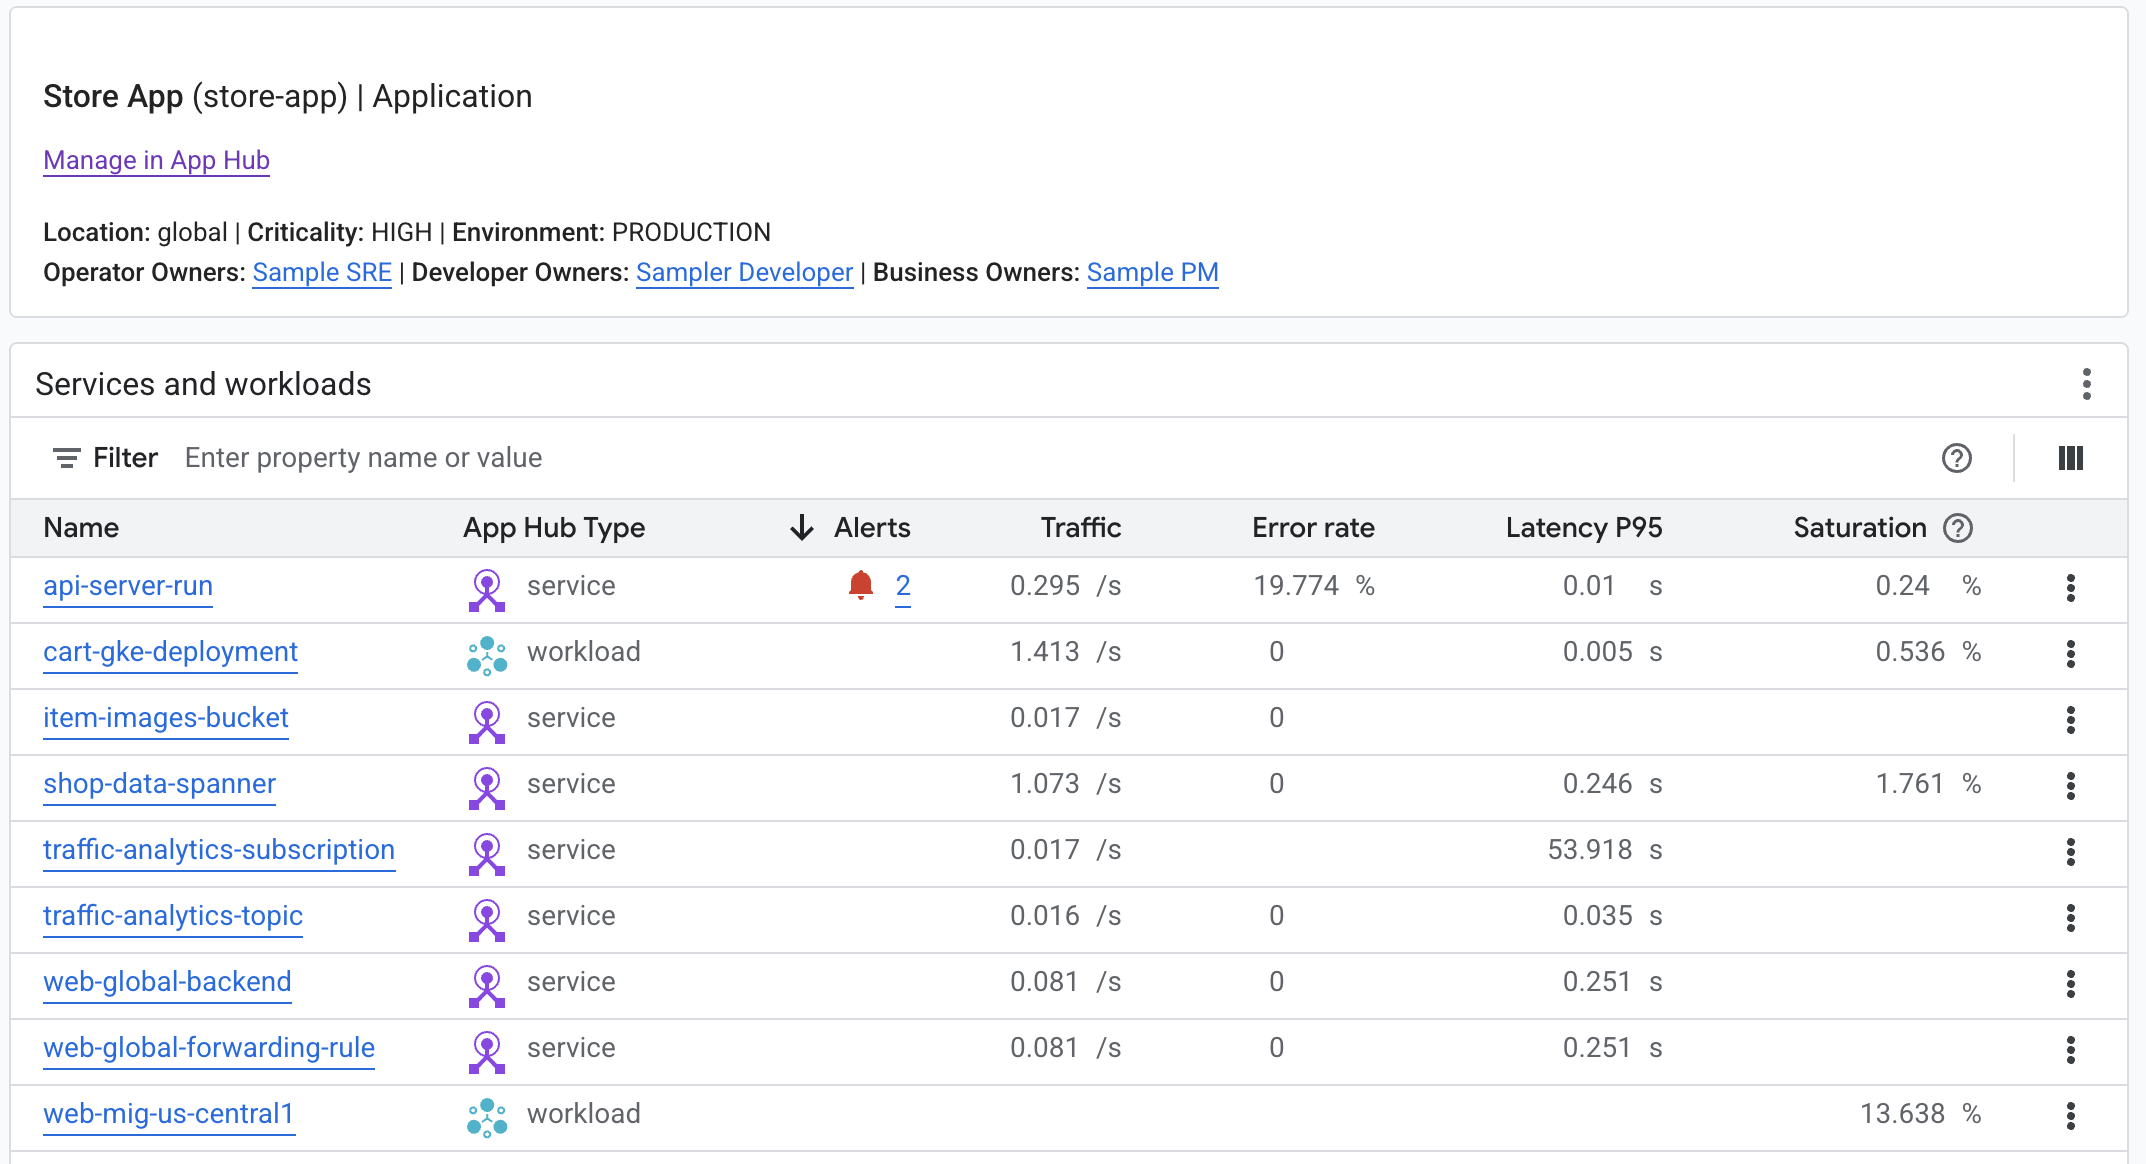
In the Overview tab, you can do all of the following:
- Reset the time range. When you open the dashboard, the time range is set to the most recent hour.
- View information about the application, like operator, developer, and business owners.
- Open the application, a service, or a workload in App Hub.
- Open the dashboard for a service or workload.
To view application telemetry and information about open incidents, select the Dashboard tab.
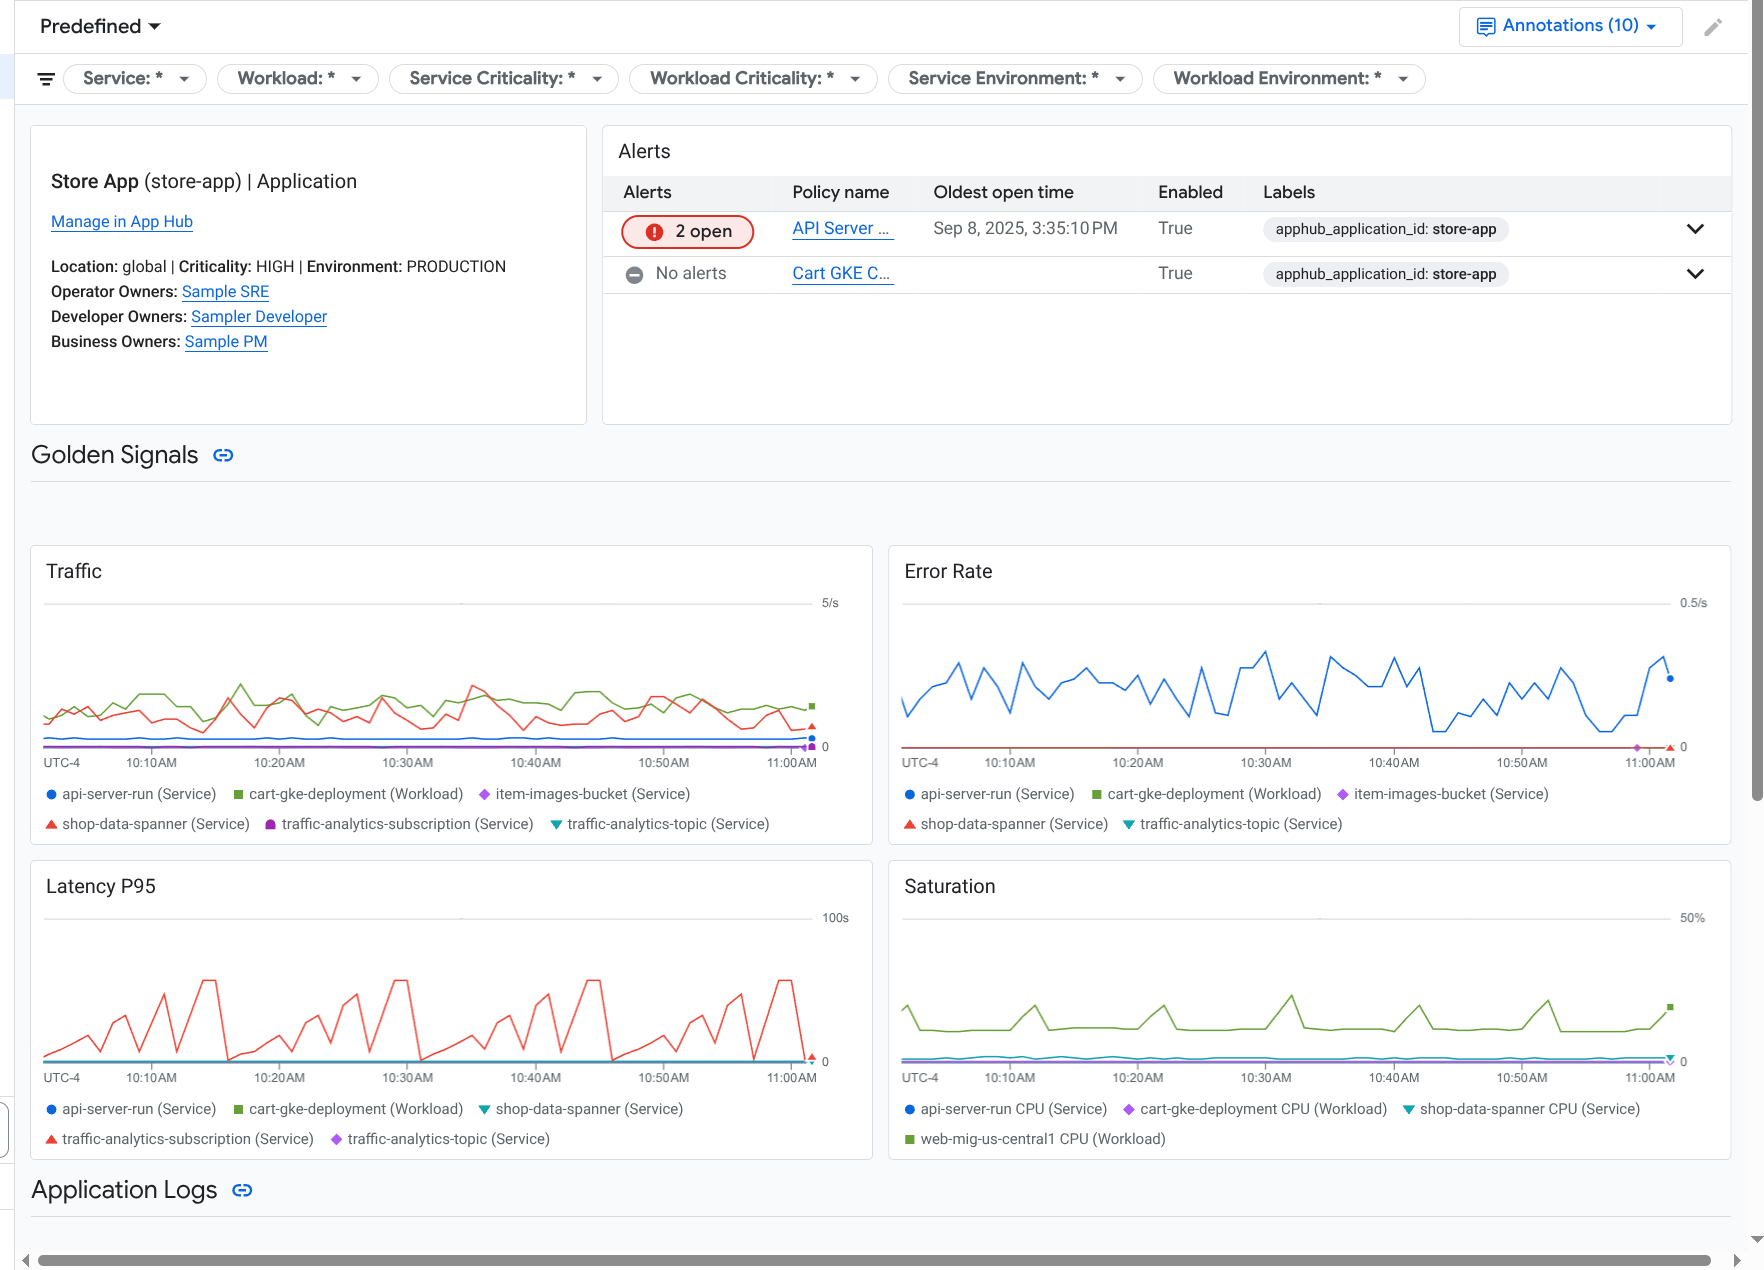
The Dashboard tab displays log, metric, and incident information. The tab is configured to overlay event annotations on your charts. Annotations can help you correlate data from different sources when you are troubleshooting an issue. To view which annotations are enabled, in the toolbar, click
 Annotations.
The tab also contains filters, which you can use to restrict what data the tab displays. For more information about how to explore the data shown on this tab, see the following sections of this document:
Filter a dashboard
The Dashboard tab displays data for services and workloads in an application. However, you can filter this dashboard to a specific service or to a set of services.
For example, the toolbar on the Dashboard tab
contains a filter like apphub_service_id: *.
If you want to view data for specific services, then
click arrow_drop_down Menu, and then select those services from the
list.
Explore log data
If you are viewing the Dashboard tab of an application dashboard, then your log data is shown in the Application Logs section. Otherwise, your data data is shown in the Logs section.
The Application Logs and Logs sections of a dashboard display log entries that match a filter and are stored by the resources listed in the default log scope of your App Hub host project or management project . For applications, the filter is similar to the following:
-- Application logs
(apphub_application_location=global)
(apphub_application_id=my-app)
For services and workloads, the filter contains additional clauses. To view the filter applied to your log data, click Show query.
If you want to write queries, then you can either open a flyout or open the Logs Explorer page. Both options let you write and run queries, and to change scope. However, the flyout retains your current context and lets you save your exploration results to a custom dashboard:
To open a flyout, click query_stats Explore data.
When your exploration is complete, click Cancel to close the flyout and discard your changes. If you want to save your changes to a custom dashboard, then click Save to dashboard and complete the dialog. You can't save your changes to the dashboard you were viewing when you opened the flyout.
The flyout doesn't list the filters shown by the Show query button. Those filters are applied at the dashboard level and can't be removed.
To open the Logs Explorer page in a new browser tab, click View in Logs Explorer.
The query is preconfigured to show log entries that match specific application labels and that are in the time range specified by the dashboard. When you close the browser tab, your changes are discarded.
For more information about how to explore your logs, see the following documents:
Explore metric data
The charts and tables on your dashboard display golden signals and other metric data that is relevant for the resources used by your application, service, or workload. The displayed data can be stored in any project listed by the metrics scope of the your App Hub host project or management project .
View chart configuration
For any chart or table that displays metric data, you can view details like the metric type and the aggregation options. To view this information, go to the toolbar of a chart or table, and then click infoInformation.
Explore data
To explore a chart or table in more detail, you can either open a flyout or open the Metrics Explorer page. Both options let you try different chart settings and save the results to a custom dashboard. However, the flyout retains your current context:
To open a flyout, click query_stats Explore data.
When your exploration is complete, click Cancel to close the flyout and discard your changes. If you want to save your changes to a custom dashboard, then click Save to dashboard and complete the dialog. You can't save your changes to the dashboard you were viewing when you opened the flyout.
To view the chart or table in the Metrics Explorer, go to the toolbar, click more_vert More, and then select View in Metrics Explorer.
You now have a temporary chart that you can modify and explore. For example, you might change the aggregation options or change the display style. To save your chart to a custom dashboard, click Save to dashboard and complete the
Correlate metric and log data
When you view a chart, you might want to explore log data that was written against the same resource as the charted metric data. For example, if you see a spike or a dip in a chart, then you might want to explore log entries so that you can get additional information about the system.
One way you can correlate your metric and log data, is to use chart options to open a flyout that displays both the chart and selected log entries. You can then use the toolbars and menus in the flyout to explore your metric and log data. For example, you might add filters to the metric query, modify the logging query, or expand and explore log entries.
The following screenshot illustrates the flyout:
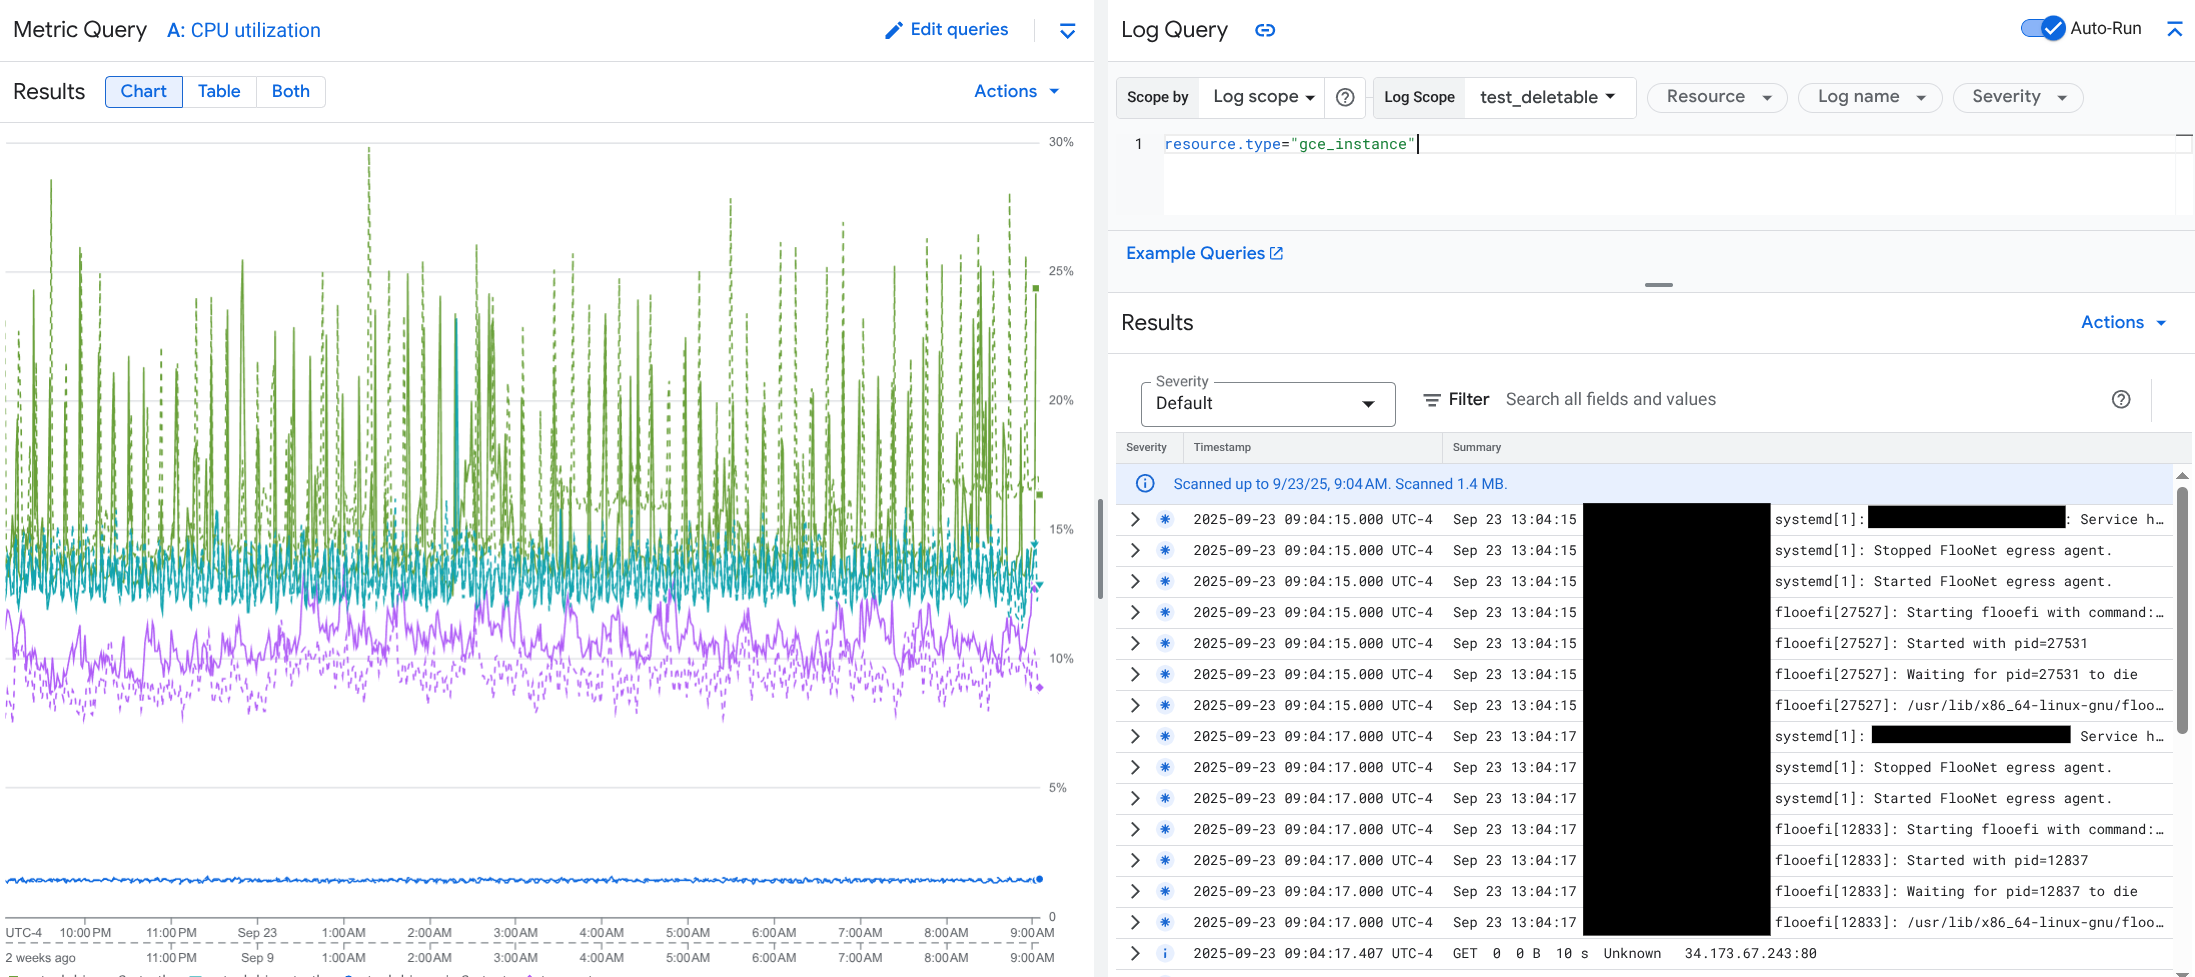
The flyout doesn't display all log entries that match the dashboard's time-range selector. Instead, the system creates a logging query that is based on the metric query. The logging query includes any applicable variables, but it doesn't include dashboard-level filters.
View metric and log data
You can correlate metric and log data when a chart displays any metric type except a log-based metric or a Prometheus metric. When a chart displays a log-based metric, a Prometheus metric, or when it doesn't display metric data, you can't correlate metric and log data.
To open the flyout that displays both metric and log data, do one of the following:
To filter log data only by the resource type and applicable variables, in the chart's toolbar, click more_vert More chart options, and then select Inspect related logs.
To show log entries that correlate with a specific time series, in the chart, use your pointer to select a point on the time series, and then go to the tooltip and select Inspect related logs.
In this mode, the flyout modifies the time-range selector to be five minutes before and after the timestamp of the selected point.
If your chart doesn't display an Inspect related logs option, then it doesn't support metric and log correlation.
Save your changes
You can save the chart or logs panel shown in the flyout, including any changes that you make, to a custom dashboard. If you save the chart to the same dashboard from which you opened the flyout, then a new chart is created on the dashboard.
To save the chart or logs panel to a custom dashboard, open the widget's Actions menu, select Save to dashboard, and then complete the dialog. You can select an existing custom dashboard or you can create a dashboard and then save the widget.
Close the flyout
To close the flyout, in the toolbar, click Cancel.
Explore incidents
The Incidents section of dashboards lists recent incidents for alerting policies that are associated with a service or workload. These alerting policies must be stored in your App Hub host project or management project .
If you don't see any entries in the Incidents section, then you don't have any alerting policies associated with a service or workload. To create this association, add labels to the policy. For more information, see Associate an alerting policy with a service or workload.
To get more information about your incidents and alerting policies, do the following:
To find details about the alerting policy that caused the incident, click the policy name. The dashboard that opens displays detailed information about the alerting policy, including a chart that displays the monitored data and the labels.
To view all alerting policies associated with the application, go to the toolbar and click query_stats Explorer data. A flyout opens that lists all policies. To return to the dashboard, click Cancel.
Explore trace data
The Application Monitoring dashboards don't show trace data. However, you can view the trace data for an application, service, or workload by using the Trace Explorer page. When you open this page, the trace data stored in the projects listed by the default trace scope is retrieved from storage. The displayed data depends on your IAM roles on those projects, the time-range setting, and the filters you apply. For information about when your trace data contains application attributes, see Trace resource attributes.
To view your application's trace data, do the following:
-
In the Google Cloud console, go to the Trace explorer page:
You can also find this page by using the search bar.
- In the toolbar of the Google Cloud console, select your App Hub host project or management project .
Apply filters to restrict the trace data:
- To filter by application, use the App Hub application span filter.
- To filter by service, use the App Hub service span filter.
- To filter by workload, use the App Hub workload span filter.
- To add a custom filter, in the toolbar, select Add filter,
select Add attribute filter, and then complete the dialog.
The syntax for the Key field must match the syntax for the key of
an attribute on a span. For example, to filter by the host identifier,
enter
host.id.
For information about how to use the trace interface, see Find and explore traces.
Explore service or workload telemetry and incidents
Application Monitoring creates a dashboard for each service and workload. These dashboards display log, metric, and incident information, and they can help you understand the health of a specific service or workload. You can explore the data on these dashboards similarly to exploring the data shown on an application's Dashboard tab.
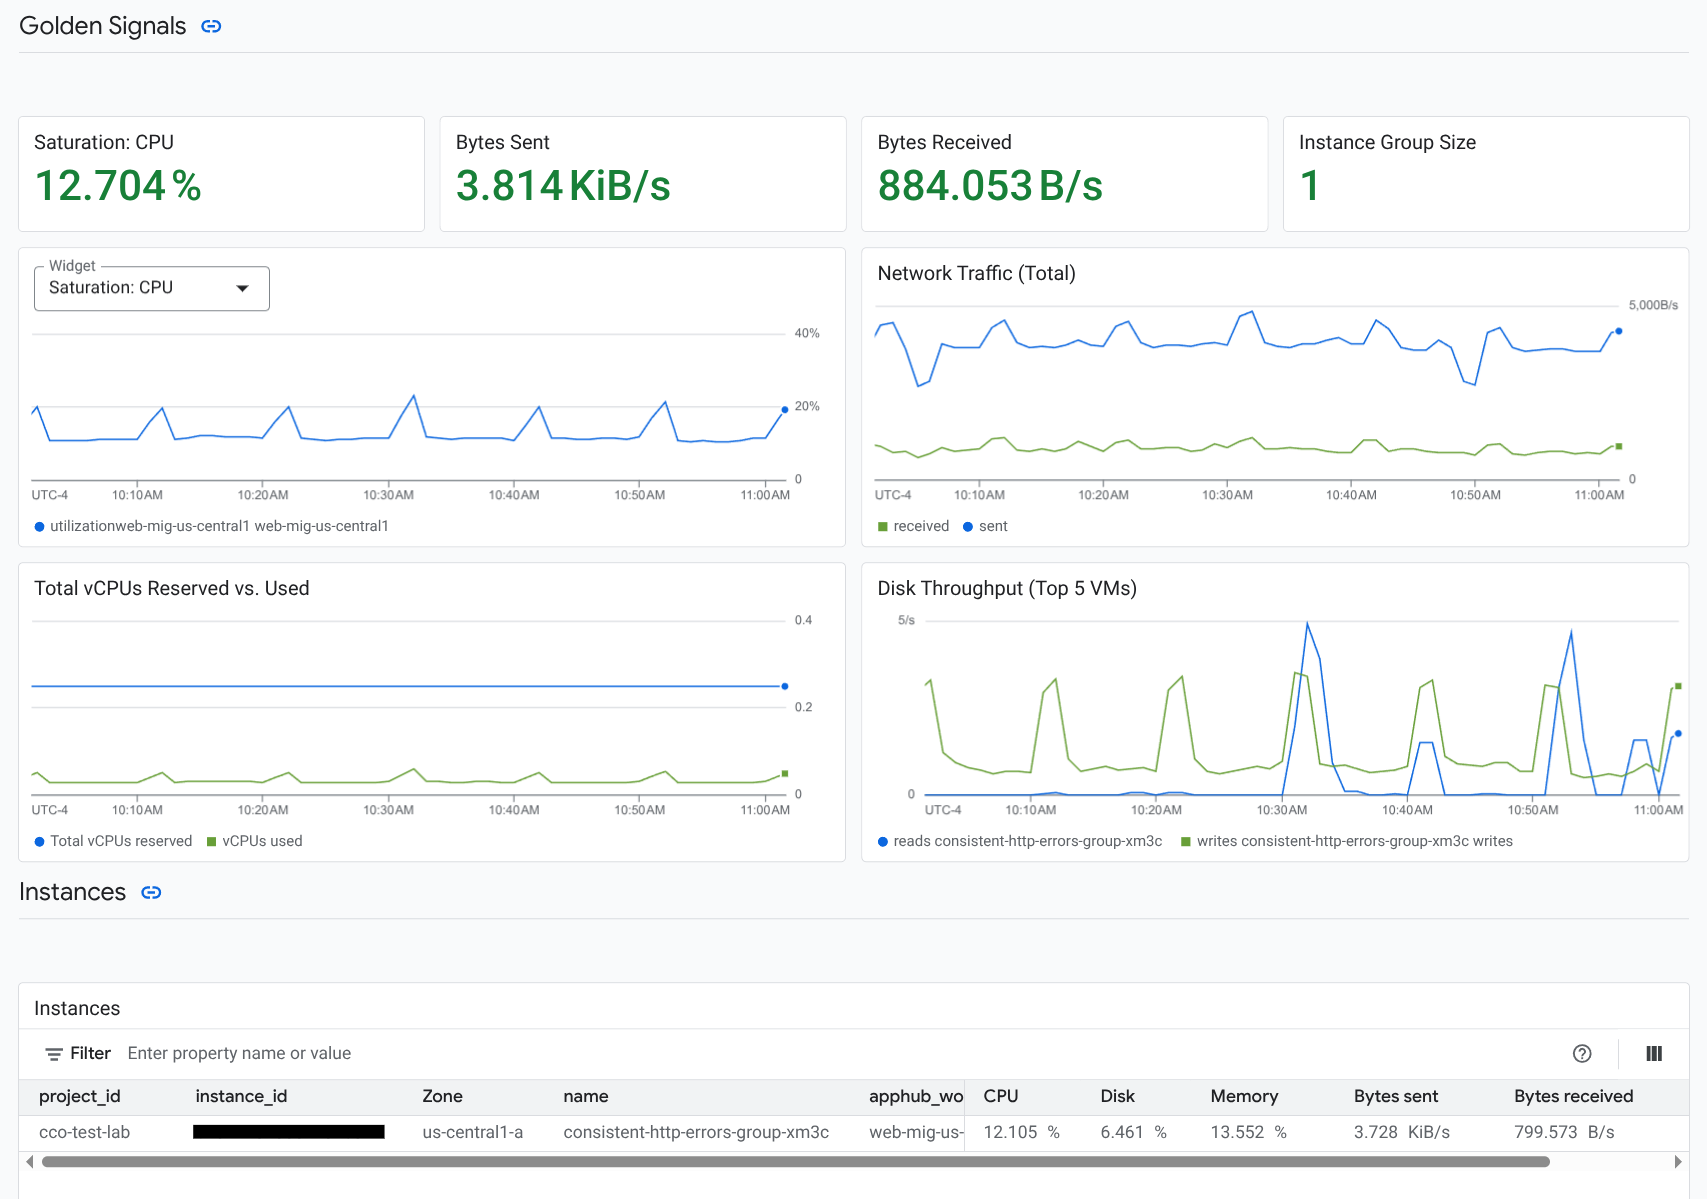
The following screenshot, illustrates the dashboard for a workload:
To open the Application Monitoring dashboard for a service or workload, do the following:
-
In the Google Cloud console, go to the Application monitoring page:
If you use the search bar to find this page, then select the result whose subheading is Monitoring.
- In the toolbar of the Google Cloud console, select your App Hub host project or management project .
On the Application monitoring page, select the name of an application, and then select a service or workload.
A dashboard displays the log, metric, and incident information for the service or workload you selected. For workloads, the dashboard is configured to overlay event annotations on your charts. Annotations can help you correlate data from different sources when you are troubleshooting an issue. To view which annotations are enabled, in the toolbar, click
Annotations.The summary card displays general information and the infrastructure type. When the infrastructure type can't be identified, this field displays generic text like App Hub Service. For more information, see Application Monitoring supported infrastructure.
For information about how to explore the data on a service or workload dashboard, see the following sections of this document:
Create a custom dashboard
Google Cloud Observability supports the creation of custom dashboards, which let you have full control over the content of the dashboard. Custom dashboards are listed in the Dashboards page of the Google Cloud console, and they can be copied, edited, and deleted. They can also be the destination where you save a dashboard widget that you've configured. For example, if you are exploring a chart on an application dashboard, then you can save that chart to a custom dashboard by going to the toolbar and selecting Save to dashboard.
If you plan to create a custom dashboard for an application, service, or workload, then the following might be helpful:
The Dashboards overview document provides a summary of widget types and it includes links to task-based guidance.
You can add dashboard-level filters to a custom dashboard. Using these filters might be more efficient, and more flexible, than adding filters to individual widgets. Filters are based on labels. For a list of labels, see the Application-specific labels section of this document.
Consider whether an existing template might have most of the content that you want. For more information, including a link to the GitHub repository that stores templates, see Install a dashboard template.
Associate an alerting policy with an App Hub application
You associate an alerting policy with a service or workload by adding application-specific labels to the alerting policy. When you add these labels, they are listed in the alerting policy and also included in any incidents. To learn more about labels, see Annotate incidents with labels.
To associate an alerting policy with a workload or service by using the Google Cloud console, do the following:
-
In the Google Cloud console, go to the notifications Alerting page:
If you use the search bar to find this page, then select the result whose subheading is Monitoring.
- In the toolbar of the Google Cloud console, select your App Hub host project or management project .
- Find the alerting policy, click more_vert View more, select Edit, and then go to the Notifications and name section.
- In the Application labels section, select your application and then select your workload or service.
- Click Save policy.
After you complete these steps, labels with the following keys are attached to your alerting policy. These labels identify your application and your service or workload:
apphub_application_locationapphub_application_idapphub_service_idorapphub_workload_id
You can also add user labels to an alerting policy by using the Google Cloud CLI, Terraform, or the Cloud Monitoring API. However, you must use the label keys shown in the previous example. For more information, see the following:
Troubleshoot
For information that might help you understand what data you are viewing, or why a dashboard doesn't display data, see Troubleshoot Application Monitoring.