This document explains how to instrument an AI agent that was built with the Agent Development Kit (ADK) framework. The ADK framework includes OpenTelemetry instrumentation that collects telemetry from agent's key actions. When you enable the built-in instrumentation, that instrumentation sends information like text prompts and agent responses to your Google Cloud project. This document outlines the required changes and and provides a link to a sample application.
Applications that use ADK can also collect multimodal prompts and responses. This document describes how to collect text prompts and responses. If you want to collect multimodal data, then additional configuration is required. For more information, see Collect and view multimodal prompts and responses.
The default observability provided by ADK might not be sufficient for your application's use case. You can add additional instrumentation libraries by using OpenTelemetry to capture telemetry from other pieces of your app, or your own custom instrumentation to capture application-specific data to get more fine-grained observability. For example, in your application you could write instrumentation code to:
- Track resource consumption of agent-invoked tools.
- Track application-specific validation failures, business rule violations, or custom error recovery mechanisms.
- Track quality scores for agent responses based on your domain-specific criteria.
Instrument your generative AI application to collect telemetry
To instrument your AI agent to collect log, metric, and trace data, do the following:
The remainder of this section describes the previous steps.
Install OpenTelemetry packages
Add the following OpenTelemetry instrumentations and exporter packages:
pip install 'google-adk>=1.17.0' \
  'opentelemetry-instrumentation-google-genai>=0.4b0' \
  'opentelemetry-instrumentation-sqlite3' \
  'opentelemetry-exporter-gcp-logging' \
  'opentelemetry-exporter-gcp-monitoring' \
  'opentelemetry-exporter-otlp-proto-grpc' \
  'opentelemetry-instrumentation-vertexai>=2.0b0'
Log and metric data is sent to your Google Cloud project by using the
Cloud Logging API or the Cloud Monitoring API. The
opentelemetry-exporter-gcp-logging and
opentelemetry-exporter-gcp-monitoring libraries invoke
endpoints in those APIs.
Trace data is sent to Google Cloud by using the
Telemetry (OTLP) API, which implements the
OpenTelemetry OTLP Protocol.
The opentelemetry-exporter-otlp-proto-grpc library
invokes the Telemetry (OTLP) API endpoint.
Your trace data is stored in a format that is generally consistent with the proto files defined by the OpenTelemetry OTLP Protocol. However, fields might be converted from an OpenTelemetry-specific data type to a JSON data type before storage. To learn more about the storage format, see Schema for trace data.
Configure your ADK environment
ADK framework versions 1.17.0 and higher include built-in support for OpenTelemetry and sending OpenTelemetry telemetry data to Google Cloud Observability. To enable this, you configure your ADK environment:
When you run your application with
adk webCLI command, include the--otel_to_cloudflag.In your
opentelemetry.envfile, set the following environment variables:OTEL_SERVICE_NAME=adk-sql-agent OTEL_PYTHON_LOGGING_AUTO_INSTRUMENTATION_ENABLED=true OTEL_INSTRUMENTATION_GENAI_CAPTURE_MESSAGE_CONTENT=trueWe recommend that you also add the following environment variable to your
opentelemetry.envfile:ADK_CAPTURE_MESSAGE_CONTENT_IN_SPANS=falseThis environment variable does the following:
- Prevents the ADK instrumentation from attaching span attributes that exceed the attribute size limit.
- Prevents personally identifiable information (PII) from being attached to spans as attributes.
Download and run the sample application
This sample code implements a generative AI agent that is built using ADK. The agent is instrumented with OpenTelemetry, configured to send metrics, traces and logs to your Google Cloud project. The telemetry sent to your project includes generative AI prompts and responses.
ADK agent persona
The generative AI agent is defined as a SQL expert that has full access to an ephemeral SQLite database. The agent is built with the Agent Development Kit and accesses a database using the SQLDatabaseToolkit. The database is initially empty.
Before you begin
- Sign in to your Google Cloud account. If you're new to Google Cloud, create an account to evaluate how our products perform in real-world scenarios. New customers also get $300 in free credits to run, test, and deploy workloads.
-
Install the Google Cloud CLI.
-
If you're using an external identity provider (IdP), you must first sign in to the gcloud CLI with your federated identity.
-
To initialize the gcloud CLI, run the following command:
gcloud init -
Create or select a Google Cloud project.
Roles required to select or create a project
- Select a project: Selecting a project doesn't require a specific IAM role—you can select any project that you've been granted a role on.
-
Create a project: To create a project, you need the Project Creator
(
roles/resourcemanager.projectCreator), which contains theresourcemanager.projects.createpermission. Learn how to grant roles.
-
Create a Google Cloud project:
gcloud projects create PROJECT_ID
Replace
PROJECT_IDwith a name for the Google Cloud project you are creating. -
Select the Google Cloud project that you created:
gcloud config set project PROJECT_ID
Replace
PROJECT_IDwith your Google Cloud project name.
-
Verify that billing is enabled for your Google Cloud project.
-
Enable the Vertex AI, Telemetry, Cloud Logging, Cloud Monitoring, and Cloud Trace APIs:
Roles required to enable APIs
To enable APIs, you need the Service Usage Admin IAM role (
roles/serviceusage.serviceUsageAdmin), which contains theserviceusage.services.enablepermission. Learn how to grant roles.gcloud services enable aiplatform.googleapis.com
telemetry.googleapis.com logging.googleapis.com monitoring.googleapis.com cloudtrace.googleapis.com -
Install the Google Cloud CLI.
-
If you're using an external identity provider (IdP), you must first sign in to the gcloud CLI with your federated identity.
-
To initialize the gcloud CLI, run the following command:
gcloud init -
Create or select a Google Cloud project.
Roles required to select or create a project
- Select a project: Selecting a project doesn't require a specific IAM role—you can select any project that you've been granted a role on.
-
Create a project: To create a project, you need the Project Creator
(
roles/resourcemanager.projectCreator), which contains theresourcemanager.projects.createpermission. Learn how to grant roles.
-
Create a Google Cloud project:
gcloud projects create PROJECT_ID
Replace
PROJECT_IDwith a name for the Google Cloud project you are creating. -
Select the Google Cloud project that you created:
gcloud config set project PROJECT_ID
Replace
PROJECT_IDwith your Google Cloud project name.
-
Verify that billing is enabled for your Google Cloud project.
-
Enable the Vertex AI, Telemetry, Cloud Logging, Cloud Monitoring, and Cloud Trace APIs:
Roles required to enable APIs
To enable APIs, you need the Service Usage Admin IAM role (
roles/serviceusage.serviceUsageAdmin), which contains theserviceusage.services.enablepermission. Learn how to grant roles.gcloud services enable aiplatform.googleapis.com
telemetry.googleapis.com logging.googleapis.com monitoring.googleapis.com cloudtrace.googleapis.com If you run the sample in the Cloud Shell, on Google Cloud resources, or on a local development environment, then the permissions listed in this section are sufficient. For production applications, typically a service account provides the credentials to write log, metric, and trace data.
To get the permissions that you need to for the sample application to write log, metric, and trace data, ask your administrator to grant you the following IAM roles on your project:
-
Cloud Telemetry Traces Writer (
roles/telemetry.tracesWriter) -
Logs Writer (
roles/logging.logWriter) -
Monitoring Metric Writer (
roles/monitoring.metricWriter) -
Vertex AI User (
roles/aiplatform.user)
-
Cloud Telemetry Traces Writer (
Launch the application
To launch the sample application, do the following:
In the Cloud Shell, issue the following command:
git clone https://github.com/GoogleCloudPlatform/opentelemetry-operations-python.gitGo to the sample directory:
cd opentelemetry-operations-python/samples/adk-sql-agentCreate a virtual environment and run the sample:
python -m venv venv/
source venv/bin/activate
pip install -r requirements.txt
env $(cat opentelemetry.env | xargs) adk web --otel_to_cloud
The application displays a message similar to the following:
Appplication startup complete
Uvicorn running on http://0.0.0.0:8080
To interact with the agent, select the URL shown in the output of the previous step.
Expand Select an agent and select
sql_agentfrom the list of agents.
Engage with the agent
To engage with the agent, ask it a question or give it a command. For example, you might ask the question:
What can you do for me ?
Similarly, since the sql_agent has the persona of a SQL expert, you might ask
it to create tables for your applications and write queries to operate on the
created tables. The agent can only create ephemeral database that is backed by a
.db file that is created on the machine running the application.
The following illustrates a sample interaction between the sql_agent and the
user:
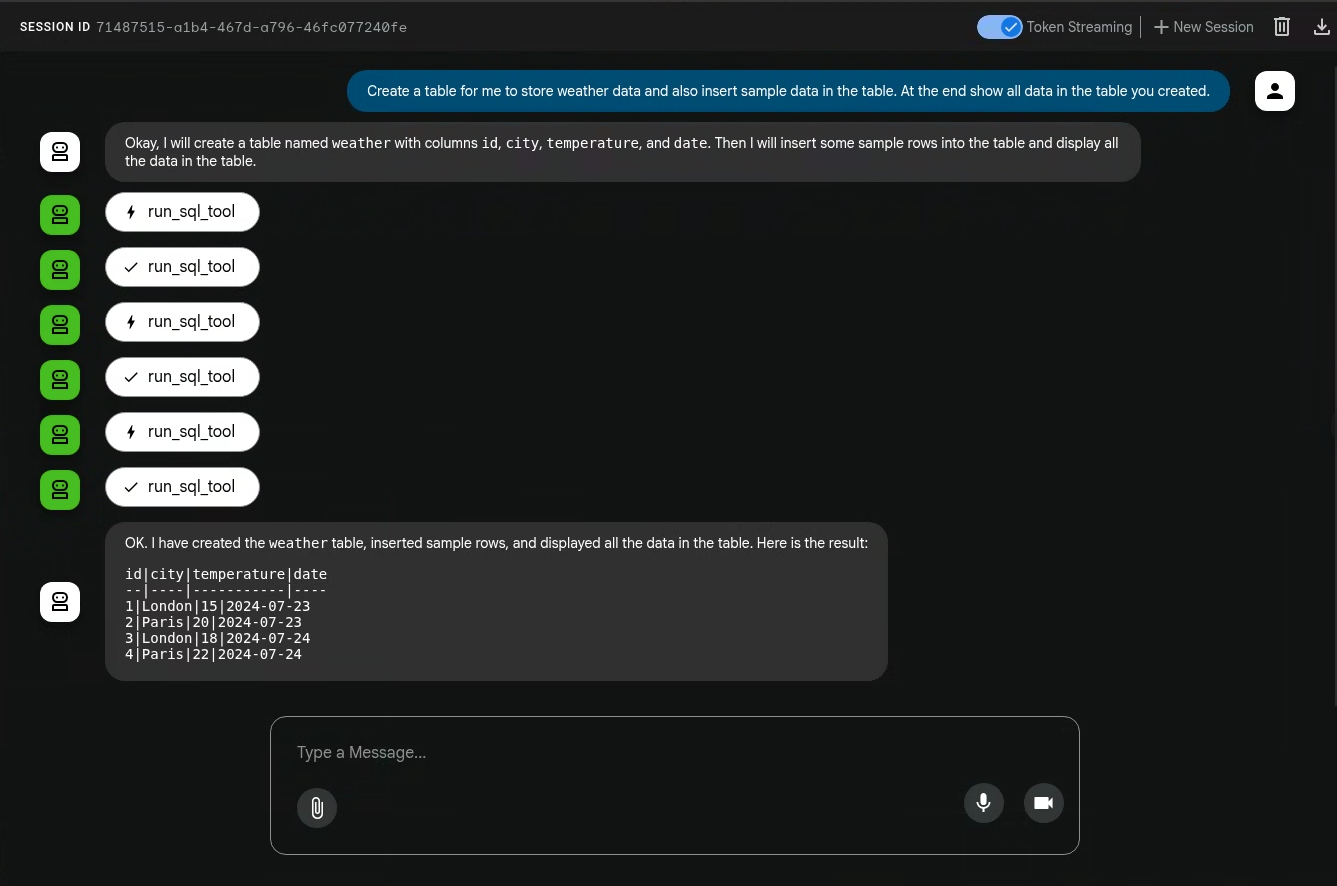
The actions performed by generative AI agents aren't deterministic, so you might see a different response for the same prompt.
Exit the application
To exit the application, enter Ctrl-C on the shell used to launch the
application.
View the traces, metrics, and logs
This section describes how can view generative AI events.
Before you begin
To get the permissions that you need to view your log, metric, and trace data, ask your administrator to grant you the following IAM roles on your project:
-
Logs Viewer (
roles/logging.viewer) -
Monitoring Viewer (
roles/monitoring.viewer) -
Cloud Trace User (
roles/cloudtrace.user)
For more information about granting roles, see Manage access to projects, folders, and organizations.
You might also be able to get the required permissions through custom roles or other predefined roles.
View telemetry
To view the generative AI events created by the application, use the Trace Explorer page:
-
In the Google Cloud console, go to the Trace explorer page:
You can also find this page by using the search bar.
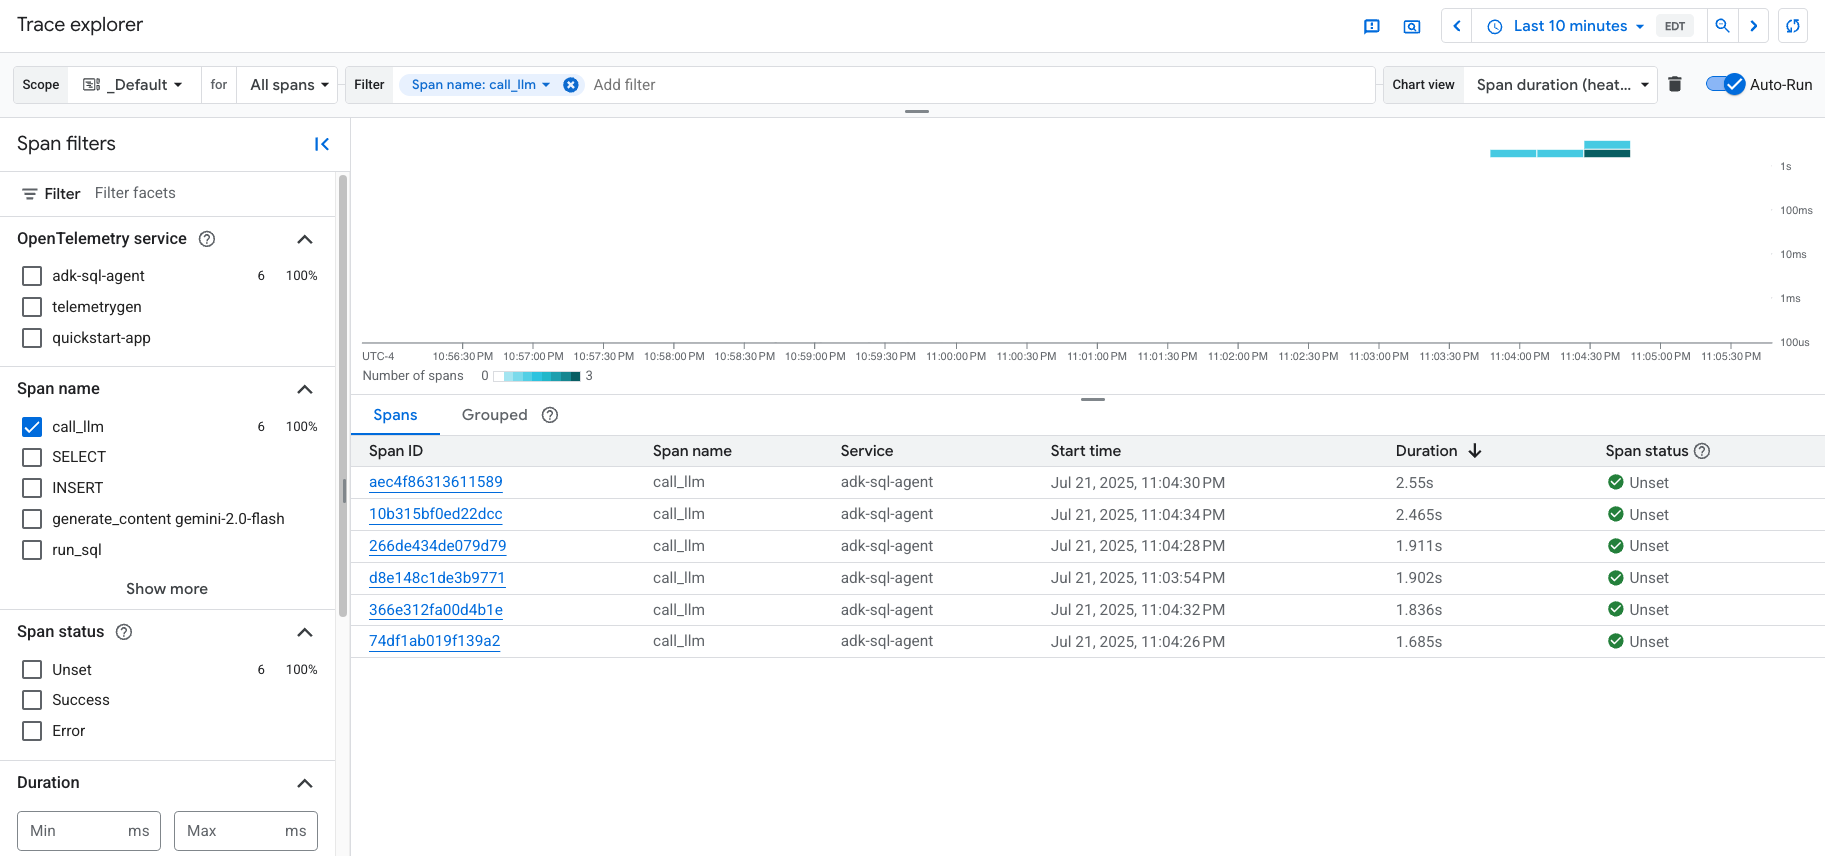
In the toolbar, select Add filter, select Span name, and then select
call_llm.The following illustrates the Trace Explorer page after filtering the data:
If you've never used Cloud Trace before, then Google Cloud Observability needs to create a database to store your trace data. The creation of the database can take a few minutes and during that period, no trace data is available to view.
To explore your span and log data, in the Spans table, select a span.
The Details page opens. This page displays the associated trace and its spans. The table on the page displays detailed information for the span you selected. This information includes the following:
The Inputs/Outputs tab displays events for generative AI agents. To learn more about these events, see View generative AI events.
The following screenshot illustrates a trace, where one span has the name
call_llm. That span invokes the LLM (Large Language Model) powering this agent. For this sample, it is Gemini. The Gemini span includes generative AI events: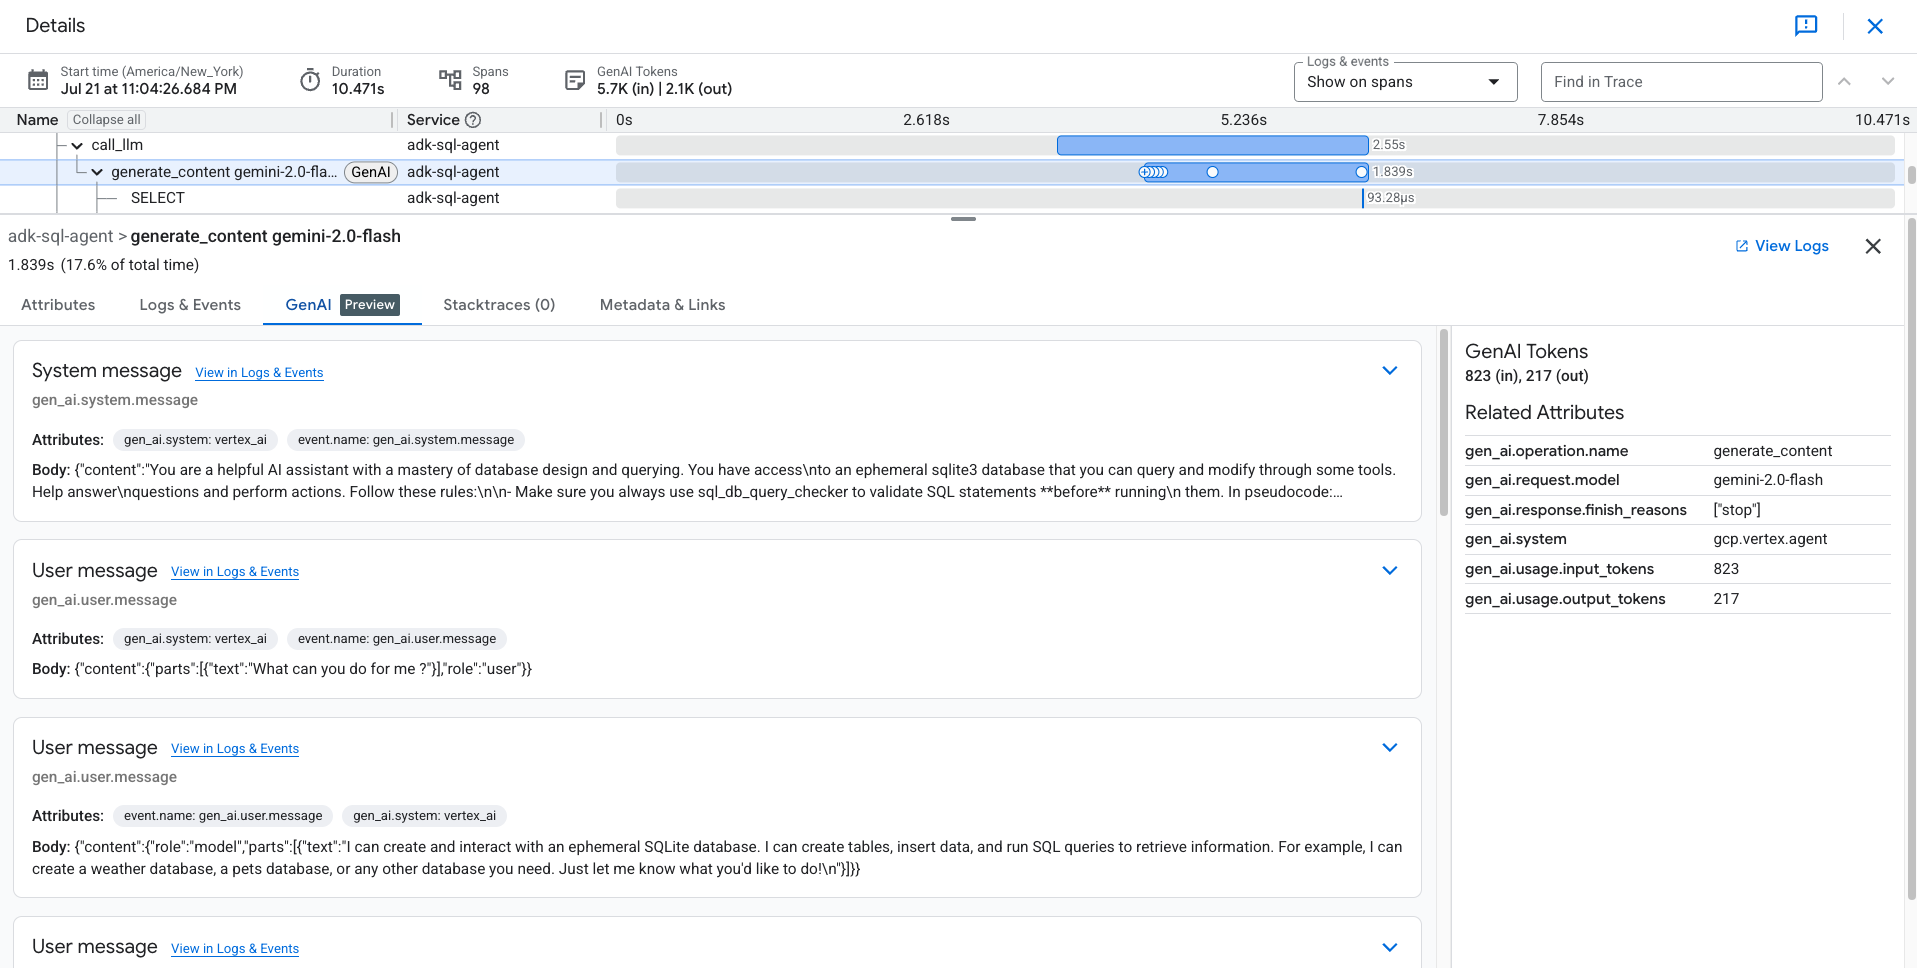
The Logs & Events tab lists log entries and events that are associated with the span. If you want to view the log data in the Logs Explorer, then in the toolbar of this tab, select View logs.
The log data includes the response of the
sql_agent. For example, for the sample run, the JSON payload includes the following content:{ "logName": "projects/my-project/logs/otel_python_inprocess_log_name_temp", "jsonPayload": { "content": { "parts": [ 0: { "text": "Now I can create the table." } 1: {1} ], "role": "model" } }, ... }
The sample is instrumented to send metric data to your Google Cloud project, but it doesn't generate any metrics.