本文說明如何設定 Google Cloud Managed Service for Prometheus 的代管收集作業。這個設定是最低限度的擷取作業範例,使用 Prometheus 部署作業監控範例應用程式,並將收集到的指標儲存在 Monarch 中。
本文將說明如何執行下列操作:
- 設定環境和指令列工具。
- 為叢集設定代管集合。
- 設定資源,以抓取目標並擷取指標。
- 遷移現有的 prometheus-operator 自訂資源。
建議您使用受管理集合,因為這樣可降低部署、擴充、分片、設定及維護收集器的複雜度。GKE 和所有其他 Kubernetes 環境都支援代管收集功能。
代管收集作業會以 Daemonset 形式執行 Prometheus 型收集器,並只抓取共置節點上的目標,確保可擴充性。您可以使用輕量型自訂資源設定收集器,透過提取收集功能擷取匯出工具,然後收集器會將擷取的資料推送至中央資料儲存庫 Monarch。 Google Cloud 絕不會直接存取叢集來提取或擷取指標資料;收集器會將資料推送至Google Cloud。如要進一步瞭解代管和自行部署的資料收集作業,請參閱「使用 Managed Service for Prometheus 收集資料」和「使用代管和自行部署的收集作業擷取及查詢資料」。
事前準備
本節說明執行本文所述工作所需的設定。
設定專案和工具
如要使用 Google Cloud Managed Service for Prometheus,您需要下列資源:
已啟用 Cloud Monitoring API 的 Google Cloud 專案。
如果您沒有 Google Cloud 專案,請執行下列步驟:
前往 Google Cloud 控制台的「New Project」(新增專案):
在「Project Name」(專案名稱) 欄位中輸入專案名稱,然後按一下「Create」(建立)。
前往「帳單」:
如果尚未在頁面頂端選取您剛建立的專案,請立即選取。
系統會提示您選擇現有的付款資料或是建立新的付款資料。
新專案預設會啟用 Monitoring API。
如果您已有 Google Cloud 專案,請確認已啟用 Monitoring API:
前往「API 和服務」:
選取專案。
點選「啟用 API 和服務」。
搜尋「監控」。
在搜尋結果中,按一下「Cloud Monitoring API」。
如果畫面未顯示「API enabled」(API 已啟用),請按一下「Enable」(啟用) 按鈕。
Kubernetes 叢集。如果您沒有 Kubernetes 叢集,請按照 GKE 快速入門導覽課程中的操作說明進行。
您還需要下列指令列工具:
gcloudkubectl
gcloud 和 kubectl 工具是 Google Cloud CLI 的一部分。如要瞭解如何安裝這些元件,請參閱「管理 Google Cloud CLI 元件」。如要查看已安裝的 gcloud CLI 元件,請執行下列指令:
gcloud components list
設定環境
為避免重複輸入專案 ID 或叢集名稱,請執行下列設定:
請依下列方式設定指令列工具:
設定 gcloud CLI,以參照Google Cloud 專案的 ID:
gcloud config set project PROJECT_ID
將
kubectlCLI 設為使用叢集:kubectl config set-cluster CLUSTER_NAME
如要進一步瞭解這些工具,請參閱下列說明:
設定命名空間
為您建立的資源建立 NAMESPACE_NAME Kubernetes 命名空間,做為範例應用程式的一部分:
kubectl create ns NAMESPACE_NAME
設定代管集合
您可以在 GKE 和非 GKE Kubernetes 叢集上使用代管收集。
啟用代管收集功能後,叢集內元件會開始運作,但尚未產生任何指標。這些元件需要 PodMonitoring 或 ClusterPodMonitoring 資源,才能正確擷取指標端點。您必須部署這些資源並提供有效的指標端點,或是啟用其中一個代管指標套件 (例如 GKE 內建的 Kube 狀態指標)。如需疑難排解資訊,請參閱「擷取端問題」。
啟用代管集合後,系統會在叢集中安裝下列元件:
gmp-operator部署作業,用於部署 Managed Service for Prometheus 的 Kubernetes 運算子。rule-evaluatorDeployment,用於設定及執行警報和記錄規則。collectorDaemonSet,只會從與每個收集器在相同節點上執行的 Pod 擷取指標,藉此水平調整收集作業。alertmanagerStatefulSet,設定為將觸發的快訊傳送至偏好的通知管道。
如需 Managed Service for Prometheus 運算子參考說明文件,請參閱資訊清單頁面。
啟用代管集合:GKE
下列項目預設會啟用代管集合:
GKE Autopilot 叢集,執行 GKE 1.25 以上版本。
執行 GKE 1.27 以上版本的 GKE Standard 叢集。建立叢集時,您可以覆寫這項預設值;詳情請參閱「停用受管理收集作業」。
如果您在 GKE 環境中執行,但系統預設未啟用代管收集功能,請參閱「手動啟用代管收集功能」。
發布新的叢集內元件版本時,GKE 上的受管理集合會自動升級。
GKE 上的受管理集合會使用授予預設 Compute Engine 服務帳戶的權限。如果您有政策會修改預設節點服務帳戶的標準權限,可能需要新增 Monitoring Metric Writer 角色才能繼續。
手動啟用代管集合
如果您在 GKE 環境中執行,且該環境預設未啟用代管收集功能,則可以使用下列項目啟用代管收集功能:
- Cloud Monitoring 中的「Managed Prometheus Bulk Cluster Enablement」(大量啟用 Managed Prometheus 叢集) 資訊主頁。
- Google Cloud 控制台的「Kubernetes Engine」頁面。
- Google Cloud CLI。如要使用 gcloud CLI,必須執行 GKE 1.21.4-gke.300 以上版本。
Google Kubernetes Engine 適用的 Terraform。如要使用 Terraform 啟用 Managed Service for Prometheus,您必須執行 1.21.4-gke.300 以上版本的 GKE。
「Managed Prometheus Bulk Cluster Enablement」(大量啟用 Managed Prometheus 叢集) 資訊主頁
您可以在 Cloud Monitoring 中使用「Managed Prometheus Bulk Cluster Enablement」(大量啟用 Managed Prometheus 叢集) 資訊主頁執行下列操作:
- 判斷叢集是否已啟用 Managed Service for Prometheus,以及您使用的是代管或自行部署的收集作業。
- 在專案中為叢集啟用代管集合。
- 查看叢集的其他資訊。
如要查看「Managed Prometheus Bulk Cluster Enablement」(大量啟用 Managed Prometheus 叢集) 資訊主頁,請按照下列步驟操作:
-
在 Google Cloud 控制台中,前往「Dashboards」(資訊主頁)
 頁面:
頁面:
如果您是使用搜尋列尋找這個頁面,請選取子標題為「Monitoring」的結果。
在篩選列中搜尋「Managed Prometheus Bulk Cluster Enablement」項目,然後選取該項目。
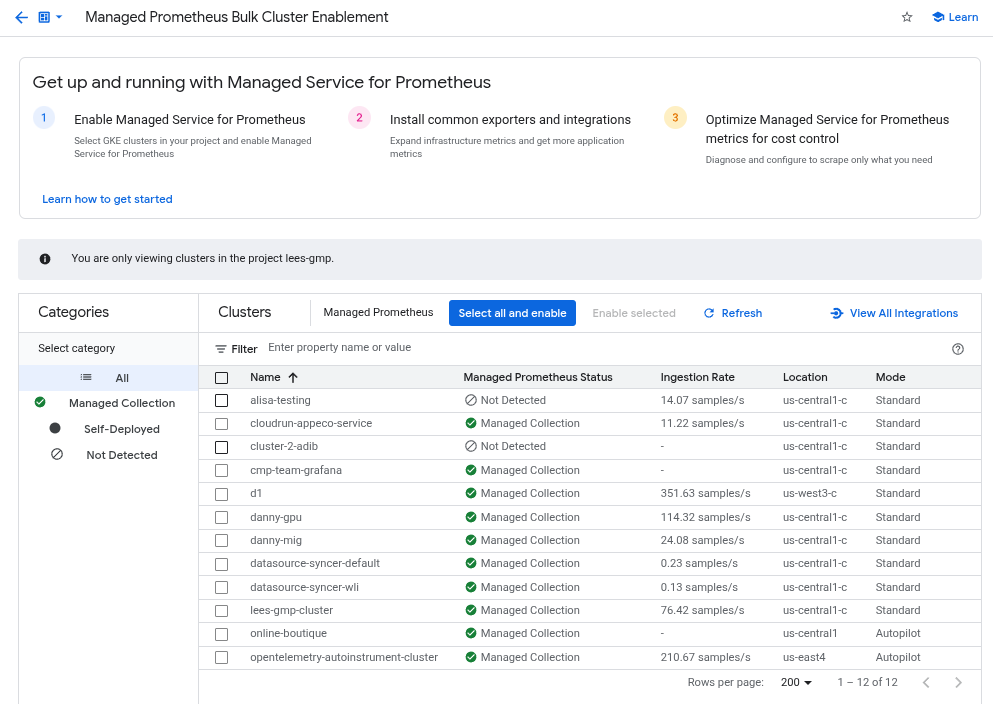
如要使用「大量啟用 Managed Prometheus 叢集」資訊主頁,在一或多個 GKE 叢集上啟用代管收集功能,請按照下列步驟操作:
找出您要啟用代管集合的所有 GKE 叢集,然後勾選相應的核取方塊。
選取「啟用所選項目」。
Kubernetes Engine 使用者介面
您可以使用 Google Cloud 控制台執行下列操作:
- 在現有 GKE 叢集上啟用代管集合。
- 建立啟用代管集合的新 GKE 叢集。
如要更新現有叢集,請按照下列步驟操作:
-
在 Google Cloud 控制台中,前往「Kubernetes clusters」(Kubernetes 叢集) 頁面:
前往「Kubernetes clusters」(Kubernetes 叢集)
如果您是使用搜尋列尋找這個頁面,請選取子標題為「Kubernetes Engine」的結果。
按一下叢集名稱。
在「Features」(功能) 清單中,找到「Managed Service for Prometheus」選項。如果顯示為已停用,請按一下「編輯」edit,然後選取「啟用 Managed Service for Prometheus」。
按一下 [儲存變更]。
如要建立啟用代管收集功能的叢集,請按照下列步驟操作:
-
在 Google Cloud 控制台中,前往「Kubernetes clusters」(Kubernetes 叢集) 頁面:
前往「Kubernetes clusters」(Kubernetes 叢集)
如果您是使用搜尋列尋找這個頁面,請選取子標題為「Kubernetes Engine」的結果。
點選「建立」。
按一下「Standard」(標準) 選項的「Configure」(設定)。
在導覽面板中,按一下「功能」。
在「Operations」(作業) 部分,選取「Enable Managed Service for Prometheus」(啟用 Prometheus 代管服務)。
按一下 [儲存]。
gcloud CLI
您可以使用 gcloud CLI 執行下列操作:
- 在現有 GKE 叢集上啟用代管集合。
- 建立啟用代管集合的新 GKE 叢集。
這些指令最多可能需要 5 分鐘才能完成。
首先,請設定專案:
gcloud config set project PROJECT_ID
如要更新現有叢集,請根據叢集是區域還是地區,執行下列其中一個 update 指令:
gcloud container clusters update CLUSTER_NAME --enable-managed-prometheus --zone ZONE
gcloud container clusters update CLUSTER_NAME --enable-managed-prometheus --region REGION
如要建立啟用代管收集功能的叢集,請執行下列指令:
gcloud container clusters create CLUSTER_NAME --zone ZONE --enable-managed-prometheus
GKE Autopilot
根據預設,搭載 GKE 1.25 以上版本的 GKE Autopilot 叢集會啟用代管集合。您無法關閉控管型集合。
如果叢集在升級至 1.25 時無法自動啟用受管理集合,您可以執行 gcloud CLI 區段中的更新指令,手動啟用這項功能。
Terraform
如需瞭解如何使用 Terraform 設定受管理集合,請參閱 google_container_cluster 的 Terraform 登錄檔。
如要瞭解如何搭配使用 Google Cloud 與 Terraform,請參閱「Terraform with Google Cloud」。
停用代管集合
如要停用叢集的代管收集功能,可以使用下列任一方法:
Kubernetes Engine 使用者介面
您可以使用 Google Cloud 控制台執行下列操作:
- 在現有 GKE 叢集中停用代管集合。
- 建立執行 GKE 1.27 以上版本的新 GKE Standard 叢集時,覆寫代管收集器的自動啟用設定。
如要更新現有叢集,請按照下列步驟操作:
-
在 Google Cloud 控制台中,前往「Kubernetes clusters」(Kubernetes 叢集) 頁面:
前往「Kubernetes clusters」(Kubernetes 叢集)
如果您是使用搜尋列尋找這個頁面,請選取子標題為「Kubernetes Engine」的結果。
按一下叢集名稱。
在「功能」部分中,找出「Managed Service for Prometheus」選項。按一下「編輯」edit,然後取消勾選「啟用 Managed Service for Prometheus」。
按一下 [儲存變更]。
如要在建立新的 GKE Standard 叢集 (版本 1.27 以上) 時,覆寫自動啟用受管理集合的設定,請按照下列步驟操作:
-
在 Google Cloud 控制台中,前往「Kubernetes clusters」(Kubernetes 叢集) 頁面:
前往「Kubernetes clusters」(Kubernetes 叢集)
如果您是使用搜尋列尋找這個頁面,請選取子標題為「Kubernetes Engine」的結果。
點選「建立」。
按一下「Standard」(標準) 選項的「Configure」(設定)。
在導覽面板中,按一下「功能」。
在「Operations」部分,取消勾選「Enable Managed Service for Prometheus」(啟用 Managed Service for Prometheus)。
按一下 [儲存]。
gcloud CLI
您可以使用 gcloud CLI 執行下列操作:
- 在現有 GKE 叢集中停用代管集合。
- 建立執行 GKE 1.27 以上版本的新 GKE Standard 叢集時,覆寫代管收集器的自動啟用設定。
這些指令最多可能需要 5 分鐘才能完成。
首先,請設定專案:
gcloud config set project PROJECT_ID
如要停用現有叢集的代管收集功能,請根據叢集是區域還是地區,執行下列其中一個 update 指令:
gcloud container clusters update CLUSTER_NAME --disable-managed-prometheus --zone ZONE
gcloud container clusters update CLUSTER_NAME --disable-managed-prometheus --region REGION
如要在建立新的 GKE Standard 叢集 (版本 1.27 以上) 時,覆寫自動啟用代管集合的設定,請執行下列指令:
gcloud container clusters create CLUSTER_NAME --zone ZONE --no-enable-managed-prometheus
GKE Autopilot
如果 GKE Autopilot 叢集執行 GKE 1.25 以上版本,您就無法關閉代管收集功能。
Terraform
如要停用受管理集合,請將 managed_prometheus 設定區塊中的 enabled 屬性設為 false。如要進一步瞭解這個設定區塊,請參閱 google_container_cluster 的 Terraform 登錄檔。
如要瞭解如何搭配使用 Google Cloud 與 Terraform,請參閱「Terraform with Google Cloud」。
啟用代管集合:非 GKE Kubernetes
如果您在非 GKE 環境中執行,可以使用下列指令啟用代管收集功能:
kubectlCLI。內部部署的 VMware 或裸機,執行 1.12 以上版本。
kubectl CLI
如果您使用非 GKE Kubernetes 叢集,請執行下列指令,安裝設定和運算子資訊清單,以便安裝代管收集器:
kubectl apply -f https://raw.githubusercontent.com/GoogleCloudPlatform/prometheus-engine/v0.15.3/manifests/setup.yaml

kubectl apply -f https://raw.githubusercontent.com/GoogleCloudPlatform/prometheus-engine/v0.15.3/manifests/operator.yaml
地端部署
如要瞭解如何為地端叢集設定受管理集合,請參閱發行版本的說明文件:
部署範例應用程式
範例應用程式會在 metrics 連接埠上發出 example_requests_total 計數器指標和 example_random_numbers 直方圖指標 (以及其他指標)。應用程式的資訊清單定義了三個備用資源。
如要部署範例應用程式,請執行下列指令:
kubectl -n NAMESPACE_NAME apply -f https://raw.githubusercontent.com/GoogleCloudPlatform/prometheus-engine/v0.15.3/examples/example-app.yaml
設定 PodMonitoring 資源
如要擷取範例應用程式發出的指標資料,Managed Service for Prometheus 會使用目標抓取作業。設定抓取目標和擷取指標作業時,會使用 Kubernetes 自訂資源,代管服務會使用 PodMonitoring 自訂資源 (CR)。
PodMonitoring CR 只會擷取 CR 部署所在命名空間中的目標。
如要擷取多個命名空間中的目標,請在每個命名空間中部署相同的 PodMonitoring CR。您可以執行 kubectl get podmonitoring -A,確認 PodMonitoring 資源是否已安裝在預期命名空間中。
如需所有 Managed Service for Prometheus CR 的參考說明文件,請參閱 prometheus-engine/doc/api reference。
下列資訊清單會在 NAMESPACE_NAME 命名空間中定義 PodMonitoring 資源 prom-example。資源會使用 Kubernetes 標籤選取器,找出命名空間中所有具有標籤 app.kubernetes.io/name 且值為 prom-example 的 Pod。系統會每隔 30 秒,在 /metrics HTTP 路徑上,透過名為 metrics 的通訊埠,擷取相符的 Pod。
apiVersion: monitoring.googleapis.com/v1
kind: PodMonitoring
metadata:
  name: prom-example
spec:
  selector:
    matchLabels:
      app.kubernetes.io/name: prom-example
  endpoints:
  - port: metrics
    interval: 30s
如要套用這項資源,請執行下列指令:
kubectl -n NAMESPACE_NAME apply -f https://raw.githubusercontent.com/GoogleCloudPlatform/prometheus-engine/v0.15.3/examples/pod-monitoring.yaml
受管理收集器現在會擷取相符的 Pod。您可以啟用目標狀態功能,查看擷取目標的狀態。
如要設定適用於所有命名空間中一系列 Pod 的水平集合,請使用 ClusterPodMonitoring 資源。ClusterPodMonitoring 資源提供的介面與 PodMonitoring 資源相同,但不會將探索到的 Pod 限制在特定命名空間。
如果您在 GKE 上執行,可以採取下列做法:
- 如要在 Cloud Monitoring 中使用 PromQL 查詢範例應用程式擷取的指標,請參閱「使用 Cloud Monitoring 查詢」。
- 如要使用 Grafana 查詢範例應用程式擷取的指標,請參閱「使用 Grafana 或任何 Prometheus API 消費者查詢」。
- 如要瞭解如何篩選匯出的指標,以及調整 prom-operator 資源,請參閱受管理收集功能的其他主題。
如果您在 GKE 以外的環境執行作業,則需要建立服務帳戶並授權該帳戶寫入指標資料,詳情請參閱下節。
明確提供憑證
在 GKE 上執行時,收集 Prometheus 伺服器會根據節點的服務帳戶,自動從環境中擷取憑證。在非 GKE Kubernetes 叢集中,必須透過 gmp-public 命名空間中的 OperatorConfig 資源明確提供憑證。
將環境設為目標專案:
gcloud config set project PROJECT_ID
建立服務帳戶:
gcloud iam service-accounts create gmp-test-sa
將必要權限授予服務帳戶:
gcloud projects add-iam-policy-binding PROJECT_ID\
  --member=serviceAccount:gmp-test-sa@PROJECT_ID.iam.gserviceaccount.com \
  --role=roles/monitoring.metricWriter
建立並下載服務帳戶的金鑰:
gcloud iam service-accounts keys create gmp-test-sa-key.json \
  --iam-account=gmp-test-sa@PROJECT_ID.iam.gserviceaccount.com
將金鑰檔案新增為非 GKE 叢集的密鑰:
kubectl -n gmp-public create secret generic gmp-test-sa \
  --from-file=key.json=gmp-test-sa-key.json
開啟 OperatorConfig 資源進行編輯:
kubectl -n gmp-public edit operatorconfig config
將以粗體顯示的文字新增至資源:
apiVersion: monitoring.googleapis.com/v1 kind: OperatorConfig metadata: namespace: gmp-public name: config collection: credentials: name: gmp-test-sa key: key.jsonrules部分, 以便進行受管理規則評估。儲存檔案並關閉編輯器。套用變更後,系統會重新建立 Pod,並開始使用指定的服務帳戶向指標後端進行驗證。
受管理集合的其他主題
本節說明如何執行下列操作:
- 啟用目標狀態功能,方便進行偵錯。
- 使用 Terraform 設定目標擷取作業。
- 篩選要匯出至代管服務的資料。
- 擷取 Kubelet 和 cAdvisor 指標。
- 轉換現有的 prom-operator 資源,以便搭配代管服務使用。
- 在 GKE 外部執行代管集合。
啟用目標狀態功能
Managed Service for Prometheus 提供方法,可檢查收集器是否正確探索及擷取目標。這份目標狀態報告旨在協助您偵錯嚴重問題。強烈建議您只在調查當下問題時啟用這項功能。如果大型叢集啟用目標狀態回報功能,可能會導致運算子記憶體不足,並進入當機迴圈。
如要查看 PodMonitoring 或 ClusterPodMonitoring 資源中的目標狀態,請將 OperatorConfig 資源中的
features.targetStatus.enabled值設為true,如下所示:apiVersion: monitoring.googleapis.com/v1 kind: OperatorConfig metadata: namespace: gmp-public name: config features: targetStatus: enabled: true設定完成後,每個有效的 PodMonitoring 或 ClusterPodMonitoring 資源都會在幾秒後顯示
Status.Endpoint Statuses欄位。如果您有名為
prom-example的 PodMonitoring 資源,且位於NAMESPACE_NAME命名空間中,則可以執行下列指令來檢查狀態:kubectl -n NAMESPACE_NAME describe podmonitorings/prom-example
輸出內容如下:
API Version:  monitoring.googleapis.com/v1
Kind:         PodMonitoring
...
Status:
  Conditions:
    ...
    Status:                True
    Type:                  ConfigurationCreateSuccess
  Endpoint Statuses:
    Active Targets:       3
    Collectors Fraction:  1
    Last Update Time:     2023-08-02T12:24:26Z
    Name:                 PodMonitoring/custom/prom-example/metrics
    Sample Groups:
      Count:  3
      Sample Targets:
        Health:  up
        Labels:
          Cluster:                     CLUSTER_NAME
          Container:                   prom-example
          Instance:                    prom-example-589ddf7f7f-hcnpt:metrics
          Job:                         prom-example
          Location:                    REGION
          Namespace:                   NAMESPACE_NAME
          Pod:                         prom-example-589ddf7f7f-hcnpt
          project_id:                  PROJECT_ID
        Last Scrape Duration Seconds:  0.020206416
        Health:                        up
        Labels:
          ...
        Last Scrape Duration Seconds:  0.054189485
        Health:                        up
        Labels:
          ...
        Last Scrape Duration Seconds:  0.006224887
輸出內容包含下列狀態欄位:
Status.Conditions.Status為 true 時,表示 Managed Service for Prometheus 已確認並處理 PodMonitoring 或 ClusterPodMonitoring。Status.Endpoint Statuses.Active Targets會顯示 Managed Service for Prometheus 在這個 PodMonitoring 資源的所有收集器上計算的抓取目標數量。在範例應用程式中,prom-example部署作業有三個副本,且只有一個指標目標,因此值為3。如有不健康的目標,系統會顯示Status.Endpoint Statuses.Unhealthy Targets欄位。- 如果 Managed Service for Prometheus 可以連上所有代管收集器,
Status.Endpoint Statuses.Collectors Fraction會顯示1值 (表示 100%)。 Status.Endpoint Statuses.Last Update Time顯示上次更新時間。如果上次更新時間明顯長於您想要的擷取間隔時間,這兩者之間的差異可能表示目標或叢集有問題。Status.Endpoint Statuses.Sample Groups欄位會顯示依收集器插入的常見目標標籤分組的樣本目標。如果系統未探索到目標,這個值有助於進行偵錯。如果所有目標都正常且正在收集資料,則Health欄位的預期值為up,而Last Scrape Duration Seconds欄位的值為一般目標的正常時間長度。
如要進一步瞭解這些欄位,請參閱 Managed Service for Prometheus API 說明文件。
如果出現下列任一情況,可能表示設定有問題:
- PodMonitoring 資源中沒有
Status.Endpoint Statuses欄位。 Last Scrape Duration Seconds欄位的值過舊。- 您看到的目標太少。
Health欄位的值表示目標為down。
如要進一步瞭解如何偵錯目標探索問題,請參閱疑難排解說明文件中的「擷取端問題」。
設定授權的擷取端點
如果擷取目標需要授權,您可以設定收集器,使用正確的授權類型並提供任何相關密鑰。
Google Cloud Managed Service for Prometheus 支援下列授權類型:
mTLS
mTLS 通常會在零信任環境中設定,例如 Istio 服務網格或 Cloud Service Mesh。
如要啟用使用 mTLS 保護的端點,請將 PodMonitoring 資源中的
Spec.Endpoints[].Scheme欄位設為https。雖然不建議這麼做,但您可以將 PodMonitoring 資源中的Spec.Endpoints[].tls.insecureSkipVerify欄位設為true,略過驗證憑證授權單位。或者,您也可以設定 Managed Service for Prometheus,從密鑰資源載入憑證和金鑰。舉例來說,下列 Secret 資源包含用戶端 (
cert)、私密金鑰 (key) 和憑證授權單位 (ca) 憑證的金鑰:kind: Secret metadata: name: secret-example stringData: cert: ******** key: ******** ca: ********
授予 Managed Service for Prometheus 收集器存取該 Secret 資源的權限:
apiVersion: rbac.authorization.k8s.io/v1
kind: Role
metadata:
  name: secret-example-read
rules:
- resources:
  - secrets
  apiGroups: [""]
  verbs: ["get", "list", "watch"]
  resourceNames: ["secret-example"]
---
apiVersion: rbac.authorization.k8s.io/v1
kind: RoleBinding
metadata:
  name: gmp-system:collector:secret-example-read
  namespace: default
roleRef:
  name: secret-example-read
  kind: Role
  apiGroup: rbac.authorization.k8s.io
subjects:
- name: collector
  namespace: gmp-system
  kind: ServiceAccount
在 GKE Autopilot 叢集上,這看起來會像這樣:
apiVersion: rbac.authorization.k8s.io/v1
kind: Role
metadata:
  name: secret-example-read
rules:
- resources:
  - secrets
  apiGroups: [""]
  verbs: ["get", "list", "watch"]
  resourceNames: ["secret-example"]
---
apiVersion: rbac.authorization.k8s.io/v1
kind: RoleBinding
metadata:
  name: gmp-system:collector:secret-example-read
  namespace: default
roleRef:
  name: secret-example-read
  kind: Role
  apiGroup: rbac.authorization.k8s.io
subjects:
- name: collector
  namespace: gke-gmp-system
  kind: ServiceAccount
如要設定使用先前 Secret 資源的 PodMonitoring 資源,請修改資源以新增
scheme和tls區段:apiVersion: monitoring.googleapis.com/v1 kind: PodMonitoring metadata: name: prom-example spec: selector: matchLabels: app.kubernetes.io/name: prom-example endpoints: - port: metrics interval: 30s scheme: https tls: ca: secret: name: secret-example key: ca cert: secret: name: secret-example key: cert key: secret: name: secret-example key: key如需所有 Managed Service for Prometheus mTLS 選項的參考說明文件,請參閱 API 參考說明文件。
BasicAuth
如要啟用使用 BasicAuth 保護的端點,請在 PodMonitoring 資源中設定
Spec.Endpoints[].BasicAuth欄位,並提供使用者名稱和密碼。如要瞭解其他 HTTP 授權標頭類型,請參閱「HTTP 授權標頭」。舉例來說,下列 Secret 資源包含用於儲存密碼的金鑰:
kind: Secret
metadata:
  name: secret-example
stringData:
  password: ********
授予 Managed Service for Prometheus 收集器存取該 Secret 資源的權限:
apiVersion: rbac.authorization.k8s.io/v1
kind: Role
metadata:
  name: secret-example-read
rules:
- resources:
  - secrets
  apiGroups: [""]
  verbs: ["get", "list", "watch"]
  resourceNames: ["secret-example"]
---
apiVersion: rbac.authorization.k8s.io/v1
kind: RoleBinding
metadata:
  name: gmp-system:collector:secret-example-read
  namespace: default
roleRef:
  name: secret-example-read
  kind: Role
  apiGroup: rbac.authorization.k8s.io
subjects:
- name: collector
  namespace: gmp-system
  kind: ServiceAccount
在 GKE Autopilot 叢集上,這看起來會像這樣:
apiVersion: rbac.authorization.k8s.io/v1
kind: Role
metadata:
  name: secret-example-read
rules:
- resources:
  - secrets
  apiGroups: [""]
  verbs: ["get", "list", "watch"]
  resourceNames: ["secret-example"]
---
apiVersion: rbac.authorization.k8s.io/v1
kind: RoleBinding
metadata:
  name: gmp-system:collector:secret-example-read
  namespace: default
roleRef:
  name: secret-example-read
  kind: Role
  apiGroup: rbac.authorization.k8s.io
subjects:
- name: collector
  namespace: gke-gmp-system
  kind: ServiceAccount
如要設定使用先前 Secret 資源和
foo使用者名稱的 PodMonitoring 資源,請修改資源以新增basicAuth區段:apiVersion: monitoring.googleapis.com/v1 kind: PodMonitoring metadata: name: prom-example spec: selector: matchLabels: app.kubernetes.io/name: prom-example endpoints: - port: metrics interval: 30s basicAuth: username: foo password: secret: name: secret-example key: password如需所有 Managed Service for Prometheus BasicAuth 選項的參考說明文件,請參閱 API 參考說明文件。
HTTP 授權標頭
如要啟用使用 HTTP 授權標頭保護的端點,請在 PodMonitoring 資源中設定
Spec.Endpoints[].Authorization欄位,並提供類型和憑證。如果是 BasicAuth 端點,請改用BasicAuth 設定。舉例來說,下列 Secret 資源包含儲存憑證的金鑰:
kind: Secret
metadata:
  name: secret-example
stringData:
  credentials: ********
授予 Managed Service for Prometheus 收集器存取該 Secret 資源的權限:
apiVersion: rbac.authorization.k8s.io/v1
kind: Role
metadata:
  name: secret-example-read
rules:
- resources:
  - secrets
  apiGroups: [""]
  verbs: ["get", "list", "watch"]
  resourceNames: ["secret-example"]
---
apiVersion: rbac.authorization.k8s.io/v1
kind: RoleBinding
metadata:
  name: gmp-system:collector:secret-example-read
  namespace: default
roleRef:
  name: secret-example-read
  kind: Role
  apiGroup: rbac.authorization.k8s.io
subjects:
- name: collector
  namespace: gmp-system
  kind: ServiceAccount
在 GKE Autopilot 叢集上,這看起來會像這樣:
apiVersion: rbac.authorization.k8s.io/v1
kind: Role
metadata:
  name: secret-example-read
rules:
- resources:
  - secrets
  apiGroups: [""]
  verbs: ["get", "list", "watch"]
  resourceNames: ["secret-example"]
---
apiVersion: rbac.authorization.k8s.io/v1
kind: RoleBinding
metadata:
  name: gmp-system:collector:secret-example-read
  namespace: default
roleRef:
  name: secret-example-read
  kind: Role
  apiGroup: rbac.authorization.k8s.io
subjects:
- name: collector
  namespace: gke-gmp-system
  kind: ServiceAccount
如要設定使用先前 Secret 資源和
Bearer類型的 PodMonitoring 資源,請修改資源以新增authorization區段:apiVersion: monitoring.googleapis.com/v1 kind: PodMonitoring metadata: name: prom-example spec: selector: matchLabels: app.kubernetes.io/name: prom-example endpoints: - port: metrics interval: 30s authorization: type: Bearer credentials: secret: name: secret-example key: credentials如需所有 Managed Service for Prometheus HTTP 授權標頭選項的參考說明文件,請參閱 API 參考說明文件。
OAuth 2
如要啟用使用 OAuth 2 保護的擷取端點,請在 PodMonitoring 資源中設定
Spec.Endpoints[].OAuth2欄位。舉例來說,下列 Secret 資源包含用於儲存用戶端密鑰的金鑰:
kind: Secret
metadata:
  name: secret-example
stringData:
  clientSecret: ********
授予 Managed Service for Prometheus 收集器存取該 Secret 資源的權限:
apiVersion: rbac.authorization.k8s.io/v1
kind: Role
metadata:
  name: secret-example-read
rules:
- resources:
  - secrets
  apiGroups: [""]
  verbs: ["get", "list", "watch"]
  resourceNames: ["secret-example"]
---
apiVersion: rbac.authorization.k8s.io/v1
kind: RoleBinding
metadata:
  name: gmp-system:collector:secret-example-read
  namespace: default
roleRef:
  name: secret-example-read
  kind: Role
  apiGroup: rbac.authorization.k8s.io
subjects:
- name: collector
  namespace: gmp-system
  kind: ServiceAccount
在 GKE Autopilot 叢集上,這看起來會像這樣:
apiVersion: rbac.authorization.k8s.io/v1
kind: Role
metadata:
  name: secret-example-read
rules:
- resources:
  - secrets
  apiGroups: [""]
  verbs: ["get", "list", "watch"]
  resourceNames: ["secret-example"]
---
apiVersion: rbac.authorization.k8s.io/v1
kind: RoleBinding
metadata:
  name: gmp-system:collector:secret-example-read
  namespace: default
roleRef:
  name: secret-example-read
  kind: Role
  apiGroup: rbac.authorization.k8s.io
subjects:
- name: collector
  namespace: gke-gmp-system
  kind: ServiceAccount
如要設定使用先前 Secret 資源的 PodMonitoring 資源,並將用戶端 ID 設為
foo,權杖網址設為example.com/token,請修改資源以新增oauth2區段:apiVersion: monitoring.googleapis.com/v1 kind: PodMonitoring metadata: name: prom-example spec: selector: matchLabels: app.kubernetes.io/name: prom-example endpoints: - port: metrics interval: 30s oauth2: clientID: foo clientSecret: secret: name: secret-example key: password tokenURL: example.com/token如需所有 Managed Service for Prometheus OAuth 2 選項的參考說明文件,請參閱 API 參考說明文件。
使用 Terraform 設定目標擷取
您可以使用
kubernetes_manifestTerraform 資源類型或kubectl_manifestTerraform 資源類型,自動建立及管理 PodMonitoring 和 ClusterPodMonitoring 資源,這兩種資源類型都可讓您指定任意自訂資源。如需搭配 Terraform 使用 Google Cloud 的一般資訊,請參閱「Terraform 與 Google Cloud」。
篩選匯出的指標
如果您收集大量資料,可能需要避免將某些時間序列傳送至 Managed Service for Prometheus,以降低成本。如要這麼做,請使用 Prometheus 重新標記規則,並針對允許清單使用
keep動作,或針對拒絕清單使用drop動作。如果是代管型收集,這項規則會放在 PodMonitoring 或 ClusterPodMonitoring 資源的metricRelabeling區段中。舉例來說,下列指標重新標記規則會篩除開頭為
foo_bar_、foo_baz_或foo_qux_的任何指標:metricRelabeling: - action: drop regex: foo_(bar|baz|qux)_.+ sourceLabels: [__name__]Cloud Monitoring 的「指標管理」頁面提供相關資訊,可協助您控管可計費指標的支出金額,同時不影響可觀測性。「指標管理」頁面會回報下列資訊:
- 以位元組和樣本為準的計費方式,在指標網域和個別指標的擷取量。
- 指標的標籤和基數相關資料。
- 每個指標的讀取次數。
- 在警告政策和自訂資訊主頁中使用指標。
- 指標寫入錯誤率。
您也可以使用「指標管理」頁面排除不必要的指標,藉此省下擷取這些指標的費用。如要進一步瞭解「指標管理」頁面,請參閱「查看及管理指標用量」。
如需更多降低費用的建議,請參閱「費用控管和歸因」。
擷取 Kubelet 和 cAdvisor 指標
Kubelet 會公開自身的指標,以及節點上執行容器的 cAdvisor 指標。您可以編輯 OperatorConfig 資源,設定受管理收集作業來擷取 Kubelet 和 cAdvisor 指標。如需操作說明,請參閱 Kubelet 和 cAdvisor 的匯出工具說明文件。
轉換現有的 prometheus-operator 資源
您通常可以將現有的 prometheus-operator 資源轉換為 Managed Service for Prometheus 代管收集作業 PodMonitoring 和 ClusterPodMonitoring 資源。
舉例來說,ServiceMonitor 資源會定義一組服務的監控作業。PodMonitoring 資源會提供 ServiceMonitor 資源提供的部分欄位。您可以對應欄位,將 ServiceMonitor CR 轉換為 PodMonitoring CR,如下表所示:
monitoring.coreos.com/v1
ServiceMonitor相容性
monitoring.googleapis.com/v1
PodMonitoring.ServiceMonitorSpec.Selector相同 .PodMonitoringSpec.Selector.ServiceMonitorSpec.Endpoints[].TargetPort對應至.Port
.Path:相容
.Interval:相容
.Timeout:相容.PodMonitoringSpec.Endpoints[].ServiceMonitorSpec.TargetLabelsPodMonitor 必須指定:
.FromPod[].FromPod 標籤
.FromPod[].To目標標籤.PodMonitoringSpec.TargetLabels以下是 ServiceMonitor CR 的範例;粗體字內容會在轉換時替換,斜體字內容則會直接對應:
apiVersion: monitoring.coreos.com/v1
kind: ServiceMonitor
metadata:
  name: example-app
spec:
  selector:
    matchLabels:
      app: example-app
  endpoints:
  - targetPort: web
    path: /stats
    interval: 30s
  targetLabels:
  - foo
假設您的服務及其 Pod 都標有
app=example-app,以下是類似的 PodMonitoring CR。如果這項假設不適用,則需要使用基礎 Service 資源的標籤選取器。轉換中已取代粗體字型內容:
apiVersion: monitoring.googleapis.com/v1 kind: PodMonitoring metadata: name: example-app spec: selector: matchLabels: app: example-app endpoints: - port: web path: /stats interval: 30s targetLabels: fromPod: - from: foo # pod label from example-app Service pods. to: foo您隨時可以繼續使用現有的 prometheus-operator 資源和部署設定,方法是使用自行部署的收集器,而非代管收集器。您可以查詢從這兩種收集器類型傳送的指標,因此您可能會想為現有的 Prometheus 部署項目使用自行部署的收集器,同時為新的 Prometheus 部署項目使用代管收集器。
保留標籤
Managed Service for Prometheus 會自動將下列標籤新增至所有收集的指標。這些標籤用於在 Monarch 中明確識別資源:
project_id:與指標相關聯的 Google Cloud 專案 ID。location:資料儲存的實體位置 (Google Cloud 區域)。這個值通常是 GKE 叢集的區域。如果資料是從 AWS 或內部部署環境收集而來,則值可能是最接近的 Google Cloud 區域。cluster:與指標相關聯的 Kubernetes 叢集名稱。namespace:與指標相關聯的 Kubernetes 命名空間名稱。job:Prometheus 目標的工作標籤 (如已知);規則評估結果可能為空白。instance:Prometheus 目標的執行個體標籤 (如果已知);規則評估結果可能為空白。
雖然不建議在 Google Kubernetes Engine 上執行時覆寫
project_id、location和cluster標籤,但您可以將這些標籤新增為operator.yaml內 Deployment 資源的args,藉此覆寫標籤。如果您使用任何保留標籤做為指標標籤,Managed Service for Prometheus 會自動重新標記,並加上exported_前置字元。這項行為與上游 Prometheus 處理保留標籤衝突的方式相符。壓縮設定
如果 PodMonitoring 資源數量眾多,ConfigMap 空間可能會用盡。 如要修正這個問題,請在 OperatorConfig 資源中啟用
gzip壓縮功能:apiVersion: monitoring.googleapis.com/v1 kind: OperatorConfig metadata: namespace: gmp-public name: config features: config: compression: gzip為代管集合啟用垂直 Pod 自動調度資源功能 (VPA)
如果叢集中的收集器 Pod 發生記憶體不足 (OOM) 錯誤,或收集器的預設資源要求和限制不符合您的需求,則可以使用垂直 Pod 自動調度功能動態分配資源。
設定
OperatorConfig資源的scaling.vpa.enabled: true欄位時,運算子會在叢集中部署VerticalPodAutoscaler資訊清單,根據用量自動設定收集器 Pod 的資源要求和限制。如要為 Managed Service for Prometheus 中的收集器 Pod 啟用 VPA,請執行下列指令:
kubectl -n gmp-public patch operatorconfig/config -p '{"scaling":{"vpa":{"enabled":true}}}' --type=merge如果指令順利完成,運算子會為收集器 Pod 設定垂直 Pod 自動調度。記憶體不足錯誤會導致資源限制立即增加。如果沒有 OOM 錯誤,通常會在 24 小時內首次調整收集器 Pod 的資源要求和限制。
嘗試啟用 VPA 時,你可能會收到這則錯誤訊息:
vertical pod autoscaling is not available - install vpa support and restart the
operator
如要解決這項錯誤,請先在叢集層級啟用垂直 Pod 自動調度資源功能:
前往Google Cloud 控制台的「Kubernetes Engine - Clusters」(Kubernetes Engine - 叢集) 頁面。
在 Google Cloud 控制台中,前往「Kubernetes clusters」(Kubernetes 叢集) 頁面:
前往「Kubernetes clusters」(Kubernetes 叢集)
如果您是使用搜尋列尋找這個頁面,請選取子標題為「Kubernetes Engine」的結果。
選取要修改的叢集。
在「Automation」(自動化) 區段中,編輯「Vertical Pod Autoscaling」(垂直自動調度 Pod 資源) 選項的值。
勾選「Enable Vertical Pod Autoscaling」(啟用垂直 Pod 自動調度資源) 核取方塊,然後按一下「Save changes」(儲存變更)。這項變更會重新啟動叢集。在此程序中,運算子會重新啟動。
請重試下列指令:
kubectl -n gmp-public patch
operatorconfig/config -p '{"scaling":{"vpa":{"enabled":true}}}'
--type=merge
,為 Managed Service for Prometheus 啟用 VPA。
如要確認
OperatorConfig資源是否已成功編輯,請使用kubectl -n gmp-public edit operatorconfig config指令開啟該資源。如果成功,OperatorConfig會包含以下粗體部分:apiVersion: monitoring.googleapis.com/v1 kind: OperatorConfig metadata: namespace: gmp-public name: config scaling: vpa: enabled: true如果您已在叢集層級啟用垂直自動調度 Pod 資源功能,但仍看到
vertical pod autoscaling is not available - install vpa support and restart the operator錯誤,則gmp-operatorPod 可能需要重新評估叢集設定。如果您執行的是標準叢集,請執行下列指令重新建立 Pod:kubectl -n gmp-system rollout restart deployment/gmp-operator
gmp-operatorPod 重新啟動後,請再次按照上述步驟修補OperatorConfig。如果您執行的是 Autopilot 叢集,請與支援團隊聯絡,尋求重新啟動叢集的協助。
垂直 pod 自動調度資源功能最適合用於擷取穩定數量的樣本,並平均分配到各個節點。如果指標負載不規律或有尖峰,或指標負載在節點間差異很大,VPA 可能不是有效率的解決方案。
詳情請參閱「GKE 中的垂直自動調度 Pod 資源功能」。
設定 statsd_exporter 和其他集中回報指標的匯出工具
如果您使用 Prometheus 的 statsd_exporter、Istio 的 Envoy、SNMP exporter、Prometheus Pushgateway、kube-state-metrics,或是其他類似的 exporter,代表環境中執行的其他資源中介並回報指標,則需要對 exporter 進行一些小變更,才能搭配 Managed Service for Prometheus 使用。
如需設定這些匯出工具的操作說明,請參閱「疑難排解」一節中的這則附註。
拆解
如要停用透過
gcloud或 GKE 使用者介面部署的受管理收集功能,請採取下列任一做法:執行下列指令:
gcloud container clusters update CLUSTER_NAME --disable-managed-prometheus
使用 GKE 使用者介面:
在 Google Cloud 控制台中選取「Kubernetes Engine」,然後選取「Clusters」(叢集)。
找出要停用代管集合的叢集,然後按一下叢集名稱。
在「詳細資料」分頁中,向下捲動至「功能」,然後使用編輯按鈕將狀態變更為「已停用」。
如要停用使用 Terraform 部署的代管集合,請在
google_container_cluster資源的managed_prometheus區段中指定enabled = false。如要停用透過
kubectl部署的代管收集功能,請執行下列指令:kubectl delete -f https://raw.githubusercontent.com/GoogleCloudPlatform/prometheus-engine/v0.15.3/manifests/operator.yaml
停用代管收集作業後,叢集就不會再將新資料傳送至 Managed Service for Prometheus。這項操作不會刪除系統中已儲存的任何現有指標資料。
停用受管理集合也會刪除
gmp-public命名空間和其中的所有資源,包括安裝在該命名空間中的任何匯出工具。在 GKE 以外執行代管集合
在 GKE 環境中,您可以執行代管收集,無須進一步設定。在其他 Kubernetes 環境中,您需要明確提供憑證、包含指標的
project-id值、指標儲存位置的location值 (Google Cloud region),以及儲存收集器執行所在叢集名稱的cluster值。由於
gcloud無法在 Google Cloud 環境以外運作,因此您需要改用 kubectl 部署。與gcloud不同,使用kubectl部署代管集合時,系統不會在推出新版本時自動升級叢集。請記得查看版本頁面,瞭解新版本並重新執行kubectl指令,手動升級至新版本。如要提供服務帳戶金鑰,請修改
operator.yaml中的 OperatorConfig 資源,詳情請參閱「明確提供憑證」。您可以在operator.yaml內將project-id、location和cluster值新增為 Deployment 資源中的args。建議根據讀取作業的預定多房客模型選擇
project-id。根據您日後使用指標範圍整理讀取作業的方式,選擇要儲存指標的專案。如果您不在意,可以將所有內容放在同一個專案中。對於
location,建議您選擇最靠近部署作業的 Google Cloud 區域。所選 Google Cloud 區域與部署位置的距離越遠,寫入延遲時間就越長,也越容易受到潛在網路問題影響。建議您參閱這份跨多個雲端的區域清單。如果您不在意,可以將所有內容放在一個 Google Cloud 區域。你無法使用global做為位置資訊。建議您為
cluster選擇部署運算子的叢集名稱。正確設定後,OperatorConfig 應如下所示:
    apiVersion: monitoring.googleapis.com/v1
    kind: OperatorConfig
    metadata:
      namespace: gmp-public
      name: config
    collection:
      credentials:
        name: gmp-test-sa
        key: key.json
    rules:
      credentials:
        name: gmp-test-sa
        key: key.json
Deployment 資源應如下所示:
apiVersion: apps/v1
kind: Deployment
...
spec:
  ...
  template:
    ...
    spec:
      ...
      containers:
      - name: operator
        ...
        args:
        - ...
        - "--project-id=PROJECT_ID"
        - "--cluster=CLUSTER_NAME"
        - "--location=REGION"
這個範例假設您已將
REGION變數設為us-central1等值。在 Google Cloud 以外執行 Managed Service for Prometheus 會產生資料傳輸費用。將資料移轉至 Google Cloud會產生費用,從其他雲端移出資料也可能產生費用。您可以透過 OperatorConfig 啟用透過網路的 gzip 壓縮,盡量降低這些費用。將以粗體顯示的文字新增至資源:
    apiVersion: monitoring.googleapis.com/v1
    kind: OperatorConfig
    metadata:
      namespace: gmp-public
      name: config
    collection:
      compression: gzip
      ...
延伸閱讀:受管理集合自訂資源
如要參閱所有 Managed Service for Prometheus 自訂資源的參考說明文件,請參閱 prometheus-engine/doc/api reference。
後續步驟