Cookbook mendapatkan hasil maksimal dari visualisasi Looker: Penyesuaian tooltip
Tetap teratur dengan koleksi
Simpan dan kategorikan konten berdasarkan preferensi Anda.
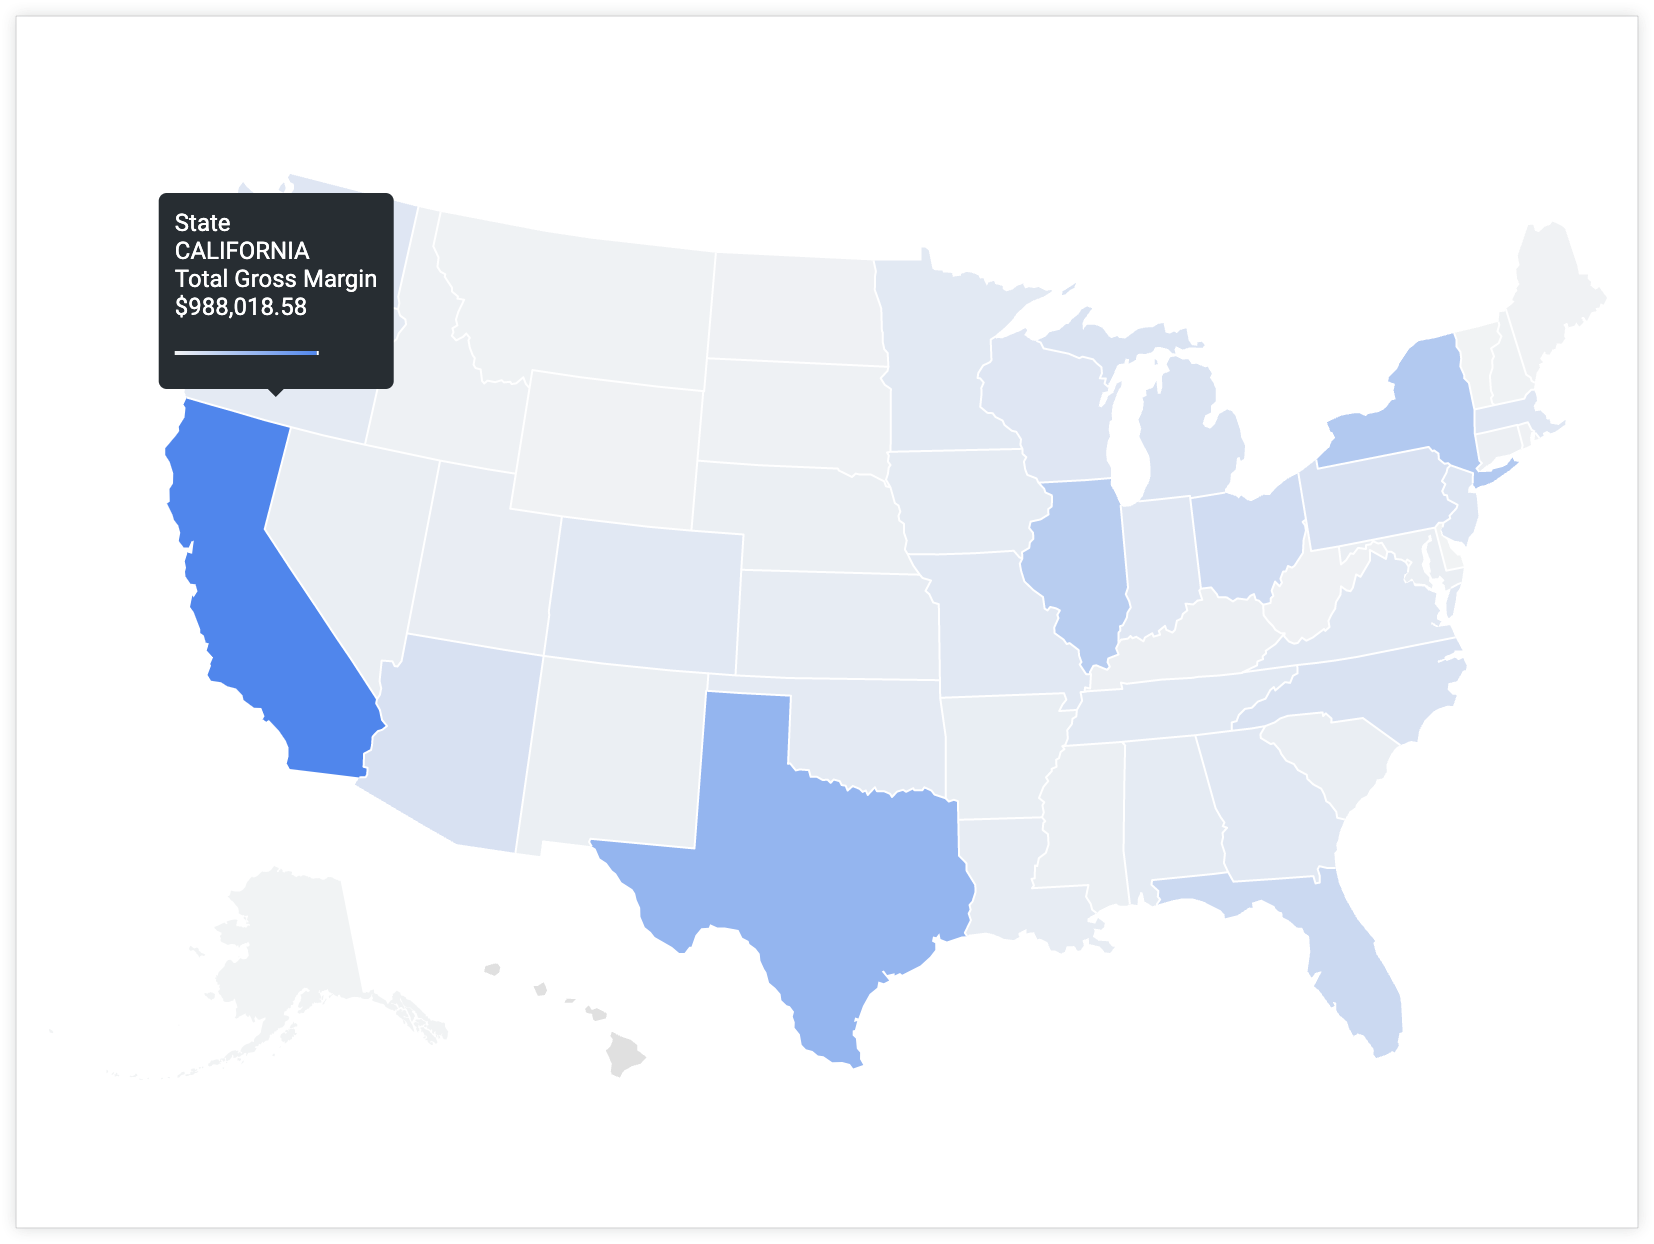
Tooltip visualisasi menampilkan nilai dimensi dan ukuran yang dipilih secara default dan dapat membantu pengguna memahami signifikansi satu titik data.
Misalnya, tooltip untuk visualisasi peta yang didasarkan pada Total Margin Kotor yang dikelompokkan menurut Negara Bagian akan menampilkan nilai untuk kedua kolom saat pengguna mengarahkan kursor ke negara bagian California.
Namun, bagaimana jika Anda ingin menyertakan kolom selain kolom default di tooltip sehingga pengguna dapat mendapatkan informasi atau konteks selengkapnya tentang titik data tanpa perlu mencari di tempat lain?
Anda dapat menyesuaikan tooltip untuk menampilkan nilai dari beberapa kolom yang ditentukan — termasuk kolom yang tidak ada dalam kueri Jelajahi.
Bahan
Variabel liquid — Variabel liquid merender nilai kolom lain bersama dengan kueri Jelajahi yang ada.
Parameter html — Kolom yang ditentukan dalam parameter html dari suatu ukuran akan dirender di tooltip saat pengguna mengarahkan kursor ke visualisasi.
Visualisasi — Tooltip akan muncul saat pengguna mengarahkan kursor ke titik data dalam jenis visualisasi tertentu.
Pengetahuan dasar tentang penggunaan Liquid di Looker dan coding HTML. Buka bagian Menggunakan variabel Liquid dalam parameter html di halaman dokumentasi html untuk mengetahui informasi latar belakang yang diperlukan.
Izin untuk menyimpan konten (jika Anda ingin menyimpan visualisasi sebagai Tampilan atau dasbor)
Pertimbangan untuk penyesuaian tooltip
Penting untuk mempertimbangkan hal berikut saat Anda menyesuaikan tooltip:
Nilai dalam parameter html menjadi sumbu y visualisasi.
Nilai yang ingin Anda tampilkan pada sumbu y harus berupa nilai dalam parameter sql pengukuran.
Saat Anda menggunakan pengukuran berformat (pengukuran type: percent_of_total atau pengukuran dengan parameter value_format_name atau value_format), pastikan untuk menggunakan sintaksis Liquid untuk nilai yang dirender {{ field_name._rendered_value }} (dengan field_name adalah nama sebenarnya dari pengukuran atau dimensi).
Contoh
Secara default, tooltip untuk titik data visualisasi akan menyertakan nilai untuk Total Margin Kotor dan Status. Namun, bagaimana jika Anda ingin memberi pengguna informasi tambahan yang tidak ditunjukkan di peta atau disertakan dalam kueri Jelajahi? Bagaimana jika Anda ingin menyertakan nilai untuk kolom yang disebut Persentase Total Margin Kotor, bukan Status? Menyertakan Persentase Total Margin Kotor akan membantu pengguna memahami perbandingan nilai Total Margin Kotor untuk setiap titik data dengan total margin kotor di seluruh set data.
Untuk menyesuaikan tooltip, ikuti langkah-langkah berikut:
measure: total_gross_margin {
  type: sum
  value_format_name: decimal_2
  sql: ${gross_margin} ;;
  html: {{ rendered_value }} | {{percent_of_gross_margin._rendered_value }} of total ;;
}
Di Mode Pengembangan, buka definisi LookML untuk kolom yang ingin Anda sesuaikan.
Anda dapat langsung membuka definisi LookML kolom dari Jelajah.
Tentukan kolom dan nilai yang ingin Anda sertakan dalam tooltip selain kolom asli. Misalnya, Persentase dari Total Margin Kotor.
Tambahkan parameter html ke ukuran asli yang dirujuk dalam kueri Jelajah dan ditampilkan di tooltip. Dalam hal ini, ukuran yang saat ini ada dalam kueri Jelajahi dan ditampilkan di tooltip adalah Total Margin Kotor.
Di parameter html, buat ekspresi dengan variabel Liquid yang menambahkan kolom tambahan ke nilai pengukuran yang ada.
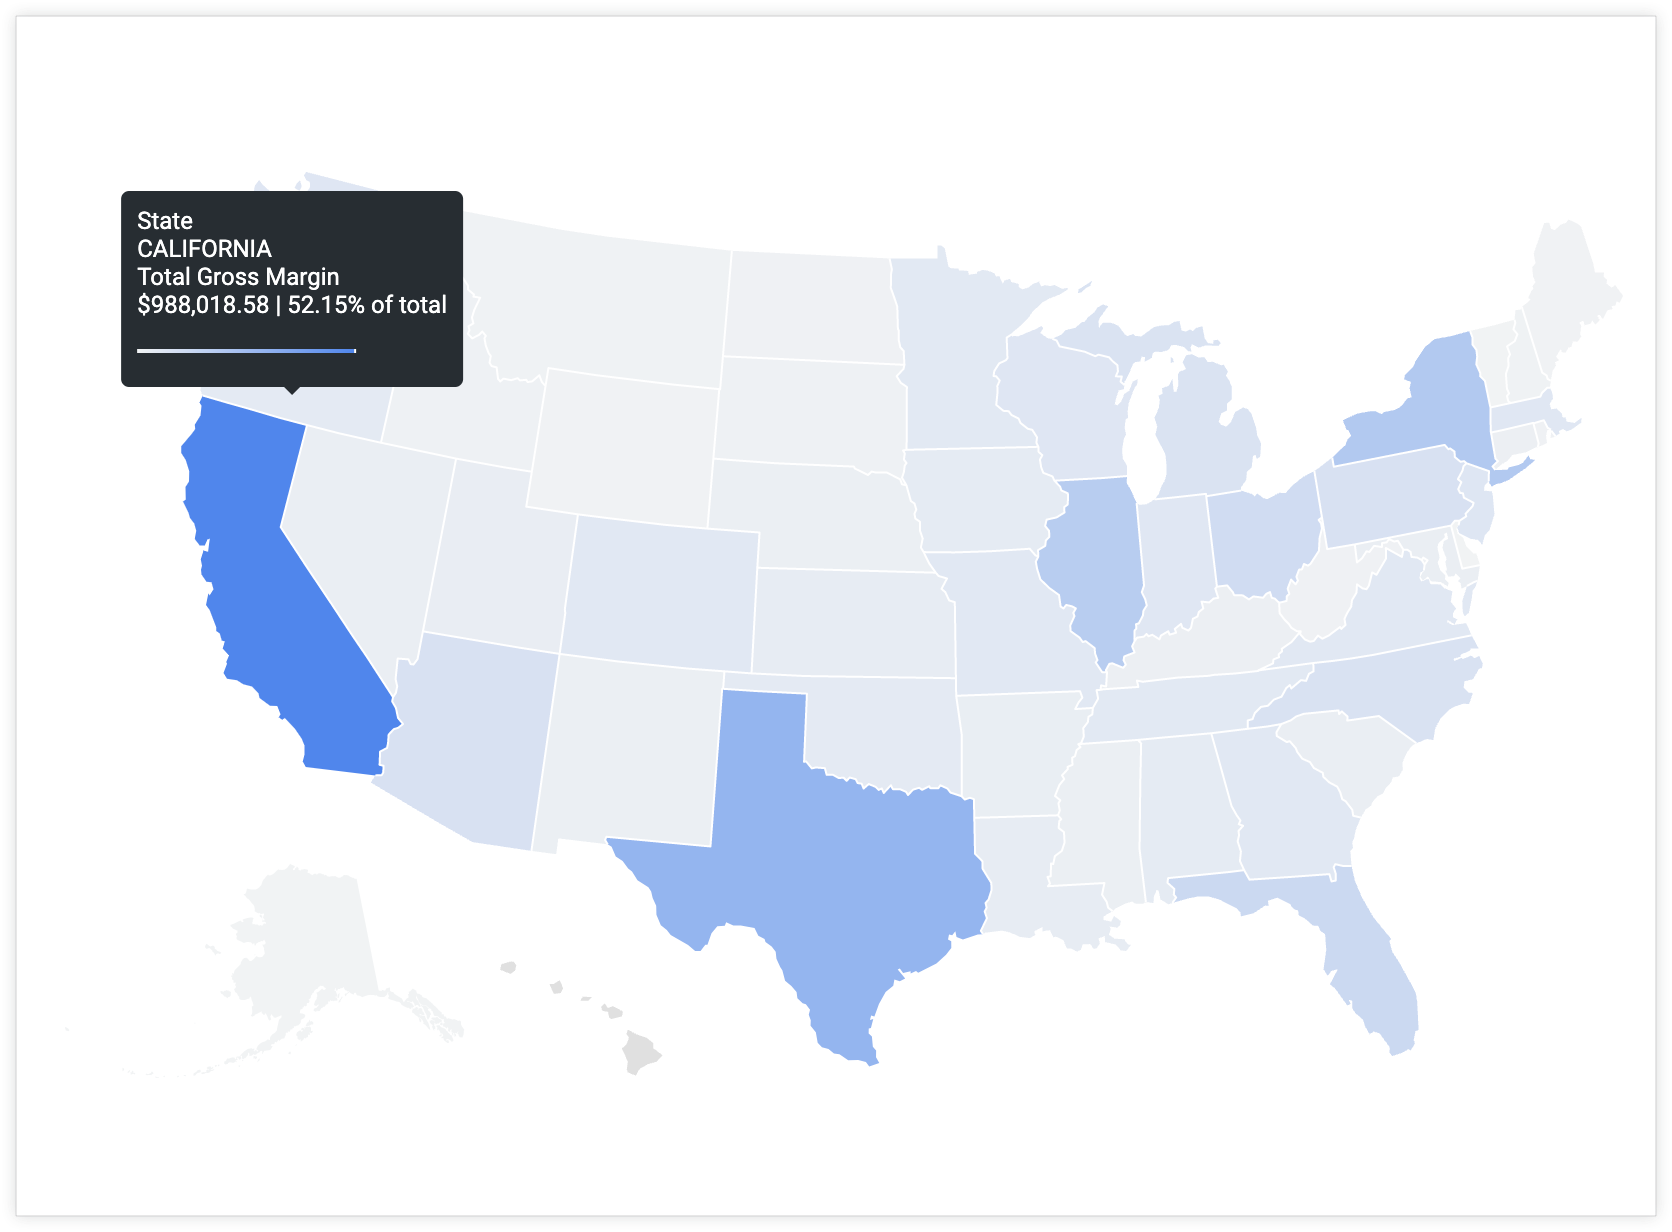
Contoh ini menggunakan variabel Liquid _rendered_value untuk menampilkan nilai berformat Looker. Misalnya, total_gross_margin menggunakan format Looker untuk dua desimal, dan percent_of_total_gross_margin menggunakan format Looker untuk persentase dengan dua desimal.
Anda dapat menggunakan karakter pipa,|, untuk memisahkan nilai untuk kolom yang berbeda.
Anda juga dapat menambahkan kata lain yang mungkin memperjelas arti nilai lain yang dirender di tooltip. Dalam hal ini, of total ditambahkan untuk memperjelas arti nilai persentase.
Simpan, validasi, dan kirim kode Anda ke produksi setelah memverifikasi bahwa kode tersebut berfungsi seperti yang diharapkan.
Tooltip kini akan menampilkan dua nilai saat pengguna mengarahkan kursor ke titik data dengan tooltip: nilai total_gross_margin titik data, dan nilai percent_of_total_gross_margin yang sesuai.
Langkah berikutnya
Setelah membuat visualisasi dengan tooltip yang disesuaikan, Anda dapat membagikannya kepada orang lain:
[[["Mudah dipahami","easyToUnderstand","thumb-up"],["Memecahkan masalah saya","solvedMyProblem","thumb-up"],["Lainnya","otherUp","thumb-up"]],[["Sulit dipahami","hardToUnderstand","thumb-down"],["Informasi atau kode contoh salah","incorrectInformationOrSampleCode","thumb-down"],["Informasi/contoh yang saya butuhkan tidak ada","missingTheInformationSamplesINeed","thumb-down"],["Masalah terjemahan","translationIssue","thumb-down"],["Lainnya","otherDown","thumb-down"]],["Terakhir diperbarui pada 2025-07-31 UTC."],[],[],null,["# Getting the most out of Looker visualizations cookbook: Tooltip customization\n\n| **Note:** This page is part of the [Looker cookbook: Getting the most out of Looker visualizations](/looker/docs/best-practices/cookbook-visualizations-in-looker).\n| **Tip:** Starting in Looker 24.0, you can use the [Chart Config Editor](/looker/docs/chart-config-editor#customize_tooltip_color) to further customize tooltip style and color.\n\nThe [visualization tooltip](/looker/docs/creating-visualizations#the_visualization_tooltip) displays the value of the selected dimensions and measures by default and can help users understand the significance of a single point of data.\n\nFor example, a tooltip for a map visualization that is based on **Total Gross Margin** grouped by **State** will display values for both fields when a user hovers over the state of California.\n\nHowever, what if you want to include fields *other* than the default in the tooltip so that users can get more information or context about a datapoint without needing to look elsewhere?\n\nYou can customize the tooltip to display values from multiple specified fields --- including fields that are not in the Explore query.\n| **Caution:** HTML formatting only renders in [table](/looker/docs/table-options), [table (legacy)](/looker/docs/legacy-table-options), and [single value](/looker/docs/single-value-options) chart visualizations and in visualization tooltips when multiple fields are combined. Any interactive content that is placed in a [map chart's](/looker/docs/map-options#viewing_map_charts_in_the_new_dashboard_experience) tooltip with the `html` parameter will not be accessible on dashboards that use the [new dashboard experience](/looker/docs/viewing-dashboards), although the content will be accessible on Looks and Explores.\n\nIngredients\n-----------\n\n- [Liquid variables](/looker/docs/liquid-variable-reference) --- Liquid variables render the values of other fields in conjunction with the existing Explore query.\n- [`html` parameter](/looker/docs/reference/param-field-html) --- The fields that are defined in the `html` parameter of a measure will render in the tooltip when a user hovers over a visualization.\n- Visualization --- The tooltip will appear when a user hovers their cursor over a datapoint in certain visualization types.\n - [Cartesian charts](/looker/docs/visualization-guide#cartesian_charts)\n - [Pie or donut charts](/looker/docs/visualization-guide#pie_and_donut_charts)\n - [Progression charts](/looker/docs/visualization-guide#progression_charts)\n - [Map charts](/looker/docs/visualization-guide#maps)\n\nPrerequisites\n-------------\n\nCustomizing the tooltip requires the following:\n\n- Permissions to [create Explores](/looker/docs/admin-panel-users-roles#explore) and permissions to [develop LookML](/looker/docs/admin-panel-users-roles#develop).\n- Knowledge of SQL and LookML development.\n- A basic knowledge of using Liquid in Looker and HTML coding. Visit the [Using Liquid variables in the `html` parameter](/looker/docs/reference/param-field-html#using_liquid_variables_in_the_html_parameter) section of the [`html`](/looker/docs/reference/param-field-html) documentation page for necessary background information.\n- Permissions to [save content](/looker/docs/admin-panel-users-roles#save_content) (if you want to save the visualization as a Look or a dashboard)\n\nConsiderations for tooltip customization\n----------------------------------------\n\nIt is important to consider the following when you're customizing a tooltip:\n\n- The values in the `html` parameter become the y-axis of a visualization.\n- The value that you want to display on the y-axis should be the value in the `sql` parameter of the measure.\n- When you're using any formatted measure (a measure of `type: percent_of_total` or a measure with a `value_format_name` or `value_format` parameter), make sure to use the Liquid syntax for the rendered value `{{ field_name._rendered_value }}` (where `field_name` is the actual name of the measure or dimension).\n\nExample\n-------\n\n| **Note:** The example in this section extrapolates upon the example map **Total Gross Margin** grouped by **State** introduced earlier on this page.\n\nBy default, the tooltip for the visualization data points will include the values for **Total Gross Margin** and **State** . However, what if you wanted to provide users with additional information that is not indicated on the map or included in the Explore query? What if you wanted to include the value for a field called **Percent of Total Gross Margin** instead of **State** ? Including **Percent of Total Gross Margin** will help users understand how the **Total Gross Margin** value for an individual data point compares to the total gross margin across the data set.\n\nTo customize the tooltip, follow these steps: \n\n measure: total_gross_margin {\n type: sum\n value_format_name: decimal_2\n sql: ${gross_margin} ;;\n html: {{ rendered_value }} | {{percent_of_gross_margin._rendered_value }} of total ;;\n }\n\n1. In [**Development Mode**](/looker/docs/dev-mode-prod-mode#development_mode), navigate to the LookML definition for the field that you want to customize.\n\n You can navigate directly to a field's LookML definition [from an Explore](/looker/docs/creating-and-editing-explores#features_for_developers).\n2. Determine the fields and values that you want to include in the tooltip in addition to the original field. For example, **Percent of Total Gross Margin**.\n\n3. Add an `html` parameter to the original measure that is referenced in the Explore query and displayed in the tooltip. In this case, the measure that is currently in the Explore query and displayed in the tooltip is **Total Gross Margin**.\n\n4. In the `html` parameter, create an expression with Liquid variables that appends the additional fields to the existing measure's value.\n\n - This example uses the Liquid variable `_rendered_value` to display [Looker formatted values](/looker/docs/reference/param-field-value-format-name). For example, `total_gross_margin` uses Looker formatting for two decimals, and `percent_of_total_gross_margin` uses Looker formatting for percentage with two decimals.\n - You can use a pipe character,`|`, to separate the values for different fields.\n - You can also append other words that might clarify the meaning of the other values that are rendered in the tooltip. In this case, `of total` is added to clarify what the percentage value means.\n5. Save, validate, and push your code to production after verifying that it works as expected.\n\n| **Note:** The input of the `html` parameter only impacts how the value is rendered to users. It does *not* change the underlying value in the database.\n\nThe tooltip will now display two values when a user hovers over a data point with the tooltip: the `total_gross_margin` value of the data point, and the corresponding `percent_of_total_gross_margin` value.\n\nNext steps\n----------\n\nOnce you have created your visualization with a customized tooltip, you can share it with others:\n\n- [Save your Explore as a Look](/looker/docs/saving-and-editing-looks)\n- [Add the Explore to a dashboard](/looker/docs/creating-user-defined-dashboards#adding_query_tiles_from_an_explore)\n- [Share the Explore with a URL](/looker/docs/sharing-urls)"]]