This document provides you with an overview of the Logs Explorer in the Google Cloud console, which you can use to retrieve, view, and analyze log entries that are stored in log buckets. Viewing and analyzing individual log entries and a sequence of log entries can help you troubleshoot problems. You can also read log data by using the Logging API and the Google Cloud CLI.
To perform aggregate operations on your log entries, like counting the number of log entries that contain a specific pattern, upgrade the log bucket to use Log Analytics, and then run queries from the Log Analytics page of the Google Cloud console. You can continue to use the Logs Explorer to view logs in log buckets that have been upgraded to use Log Analytics. For more information, see Log Analytics overview.
The remainder of this document describes how to use the Logs Explorer.
Before you begin
To get the permissions that you need to use the Logs Explorer to view log entries, ask your administrator to grant you the following IAM roles:
-
To view log entries in the
_Requiredbucket and those in the_Defaultview on the_Defaultbucket, or to select a log scope: Logs Viewer (roles/logging.viewer) on your project, folder, or organization. -
To view all log entries in the
_Requiredand_Defaultbuckets: Private Logs Viewer (roles/logging.privateLogViewer) on your project, folder, or organization. -
To view restricted
LogEntryfields in a log bucket: Log Field Accessor (roles/logging.fieldAccessor) on the project, folder, or organization that stores the log bucket. For information about how to restrict access toLogEntryfields, see Configure field-level access. -
To view and download log entries stored in a log view on a log bucket:
Logs View Accessor (
roles/logging.viewAccessor) on the project, folder, or organization that contains the log bucket. For information about how to get access only to a specific log view, see Control access to a log view
For more information about granting roles, see Manage access to projects, folders, and organizations.
You might also be able to get the required permissions through custom roles or other predefined roles.
Get started
To begin using the Logs Explorer, do the following:
-
In the Google Cloud console, go to the Logs Explorer page:
If you use the search bar to find this page, then select the result whose subheading is Logging.
Select a Google Cloud project, folder, or organization. For App Hub configurations, select the App Hub host project or management project.
The log entries displayed by the Logs Explorer page depend on the following:
- The resources searched for log entries.
- The time-range setting.
- Your Identity and Access Management (IAM) roles on the searched resources.
- Your query filters the search results.
For example, adding the query
severity>=ERRORresults in the display listing only those log entries with a severity level of at leastERROR.
By default, the Logs Explorer page searches the resources listed in the default log scope for log entries. When the default log scope isn't accessible, the page searches for the log entries that originate in your selected project, folder, or organization. For projects, the search results include the log entries that are routed to the project by a sink in another project, and then stored in a log bucket.
After the Logs Explorer page opens, you can select which resources are searched for log entries by the Logs Explorer. However, your selection applies only to your current session.
Logs Explorer interface
The Logs Explorer interface lets you display log entries, parse and analyze them, and specify query parameters. The Logs Explorer contains the following sections, which are detailed on this page:
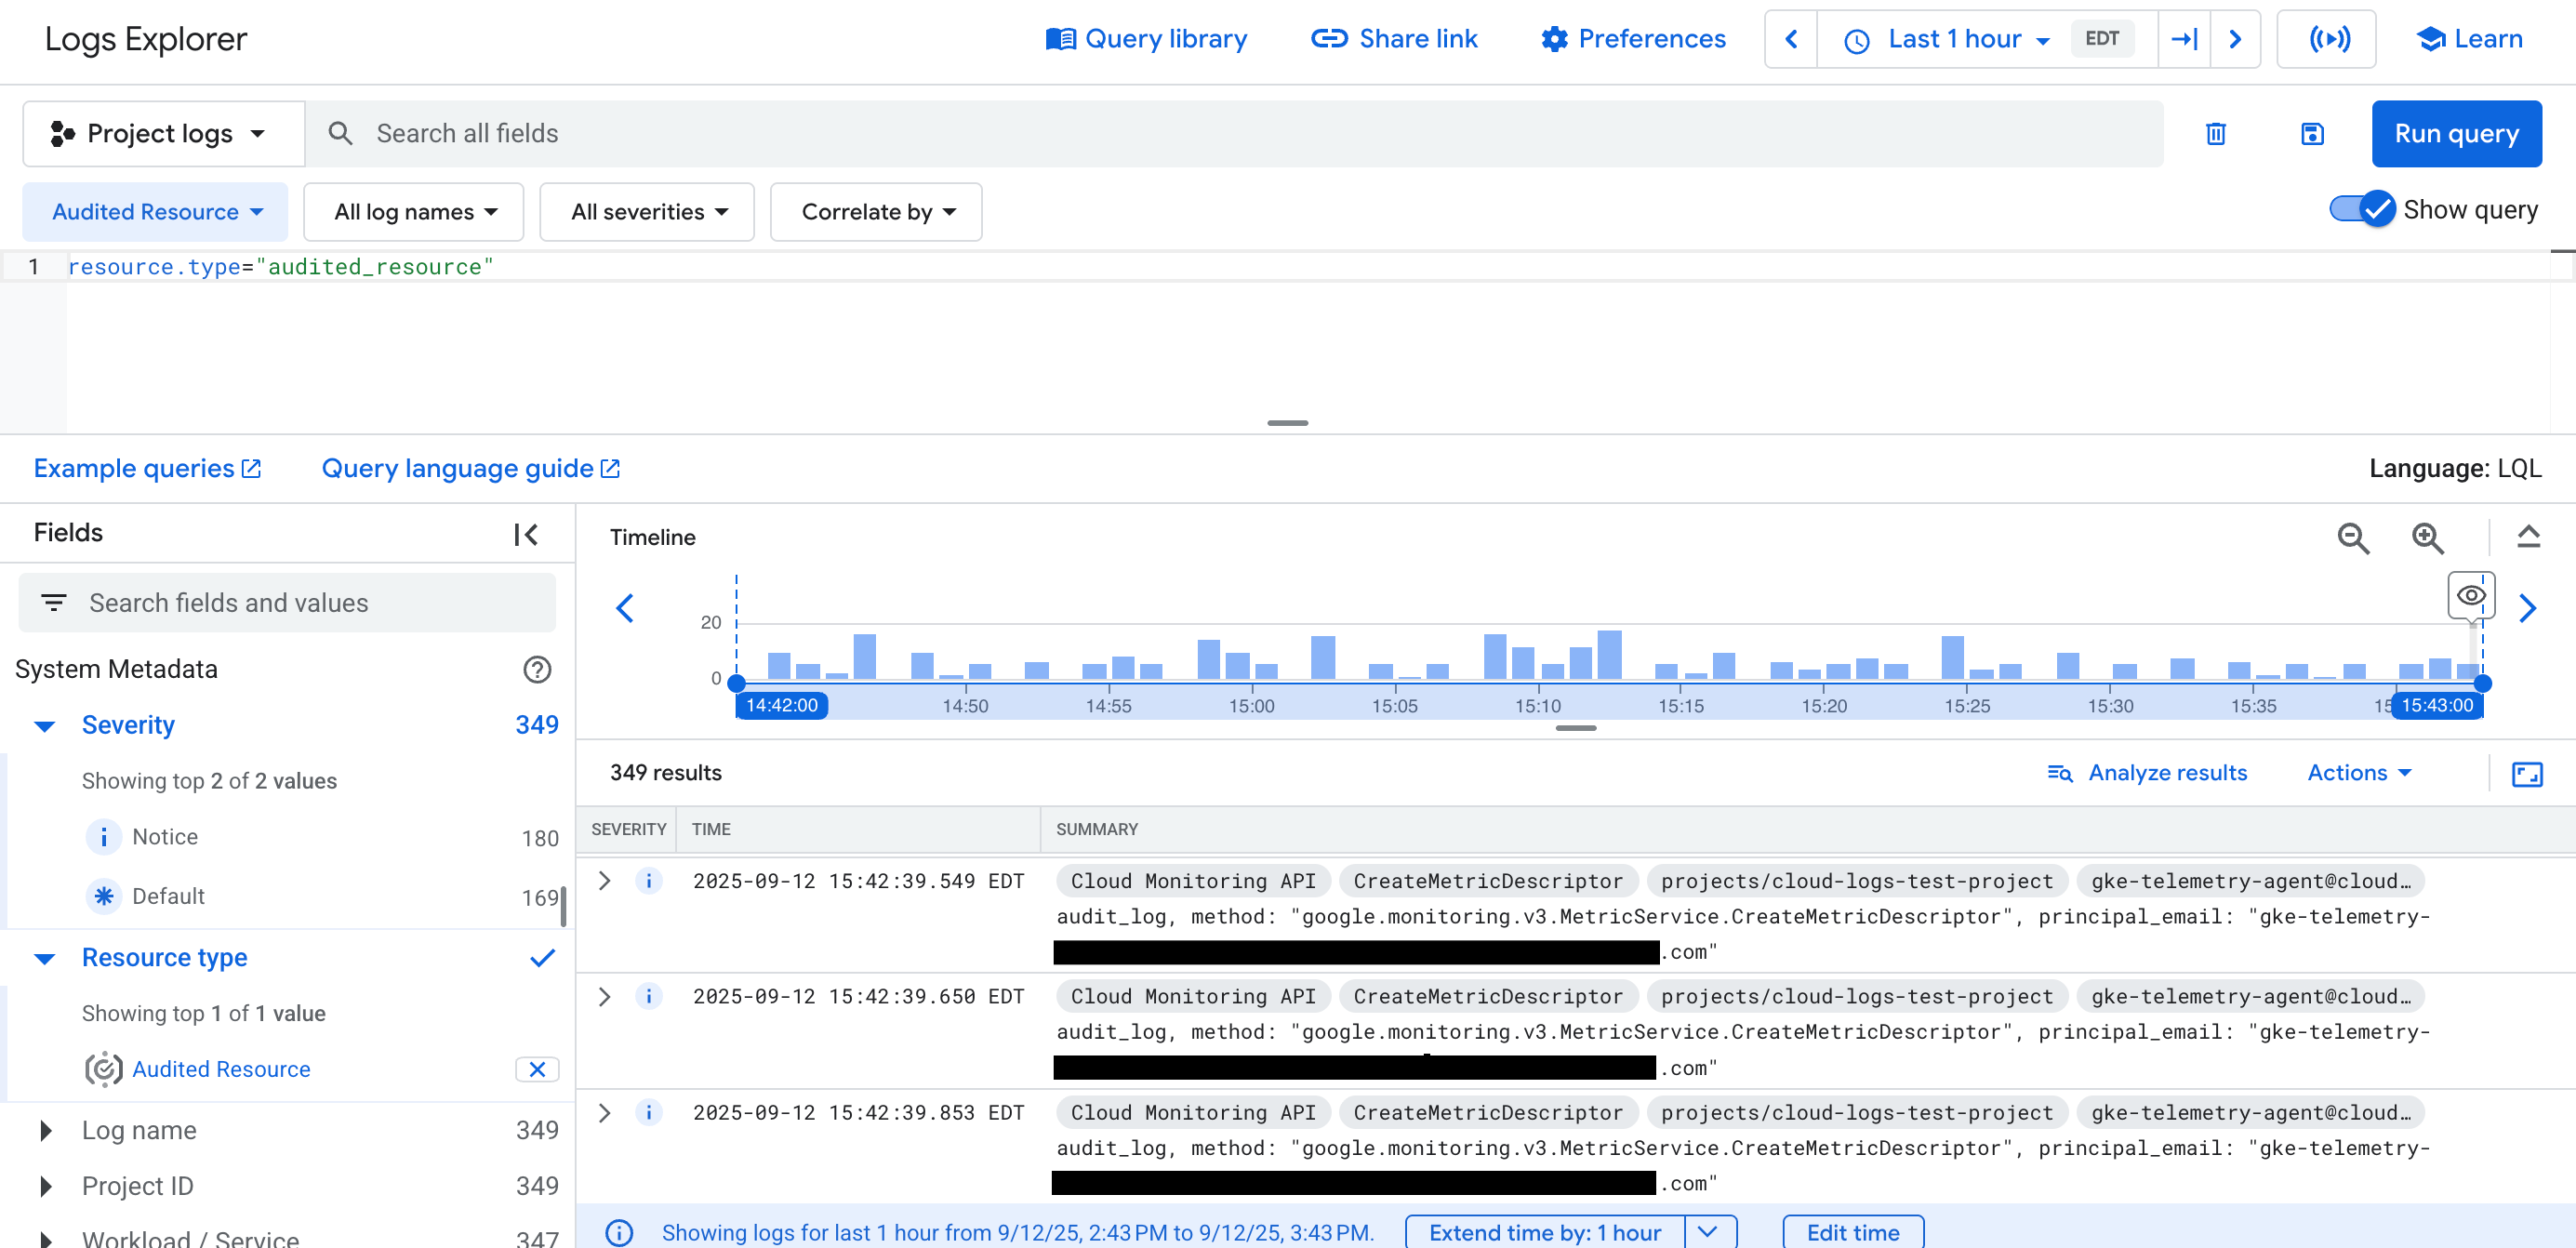
Primary toolbar
Using the primary toolbar, you can do the following:
- menu_book Query library: View saved, recent, and suggested queries. For more information, see Save and share queries.
- link Share link: Create a shortened URL of the query and
copy it to your clipboard, making it easier to share a query.
The copied URL has the corresponding absolute time range represented by the
time range of your query; for example,
7:49:37 PM - 8:49:37 PM. - settings Preferences: Adjust the view of the Logs Explorer page, and customize the format of your query results. For more information, see Set preferences for viewing log data.
- Time-range selector: Specify a time range for the log entries that you want to view. For more information, see use the time-range selector.
- Stream logs: View log entries as Logging stores them in log buckets. For more information, see Stream logs.
- school Learn: View links to relevant documentation and topics.
View recent, saved, and suggested queries
To view queries that you recently run, queries that you saved for future use, and suggested queries, click the menu_book Query library button.
In the Query library tab, you can view the following:
Recent queries: View queries that you have recently run. For more information, see Use recent queries.
Saved queries: View your saved queries and queries that other users of the Google Cloud project have shared with you. For more information, see Save and share queries.
Suggested queries: View suggested queries based on the resources in your Google Cloud project. For more information, see Use suggested queries.
Queries provided by Google Cloud: View queries provided by Google Cloud based on common use cases for various Google Cloud services. For more information, see Select queries from the library.
Set preferences for viewing log data
To customize how your logs data is presented in the query results, click the settings Preferences button, and select View, Format, or Manage summary fields:
To show or hide the Timeline and Fields panes, to hide summary chips in your query results, or to change the sorting order of your logs, select View.
To configure the Time column of your query results, select Format. For more information, see Configure the Time column.
To show up to 10 lines for each log entry, select Format and click Wrap lines. By default, the content of each log entry is truncated to fit into one line. Blank spaces are preserved in each log entry.
To find patterns in your logs by using summary fields, select Manage summary fields. For more information, see Find patterns in your logs by using summary fields.
Configure the Time column
The Time column in the Query results pane displays the timestamps of your log entries. You can customize the Time column so that only certain parts of the timestamp are visible. This creates more horizontal space so that you can view more information in the log entry.
To select which parts of the timestamp to display, click the settings Preferences menu, select Format, and then select one of the following options:
Date, time, and timezone
Date and time (default)
Time only
Find patterns in your logs by using summary fields
Suppose you're looking through the log entries in your query results and want to
quickly skim the results by a certain LogEntry field. Or perhaps
you want to group your log entries by a certain field-value pair. You can add
summary fields to your results, which appear as chips at the beginning of each
log entry line.
The Logs Explorer offers default summary fields and custom summary fields.
Default summary fields depend on your current query results, and custom summary
fields let you select any field in the LogEntry.
To show or hide all summary field chips in your query results, click settings Preferences button, select View, then Show summary chips. When this option is enabled, the results are displayed in raw-text format.
To hide specific summary fields, enable Summary fields, and then click Hide summary field. To modify summary fields, do the following:
Click the settings Preferences button, and select Manage summary fields.
In the Manage summary fields dialog, you can do the following:
Add any custom field names to Custom summary fields.
The summary field supports auto-completion and field correction for legal characters within quotes. For example, if you type
jsonPayload.id-field, it gets changed tojsonPayload."id-field".You can also select any
LogEntryfield, regardless of whether it is suggested to you with the autocomplete function.To remove an existing custom summary field, click the
Xin its chip.Turn truncation on and off for your custom summary fields.
To shorten the display of the summary field values, use the toggle_off toggle next to Truncate custom summary fields. You can choose how many characters to display before the field is truncated, and whether the beginning or the end of the field is displayed.
Hide or show default summary fields:
To customize which default summary fields are shown in your query results, expand the Hide or show default summary fields menu.
Click Apply.
Your summary fields are now updated in your query results.
View logs by time range
To specify a time range for the log entries that you want to view, use the time-range selector.
To perform a forced refresh of your query results to include the current time, click Jump to now.
Stream logs
You can stream logs as Logging stores them in log buckets, or you can add a query to stream only those logs that match the query.
To stream logs based on a query, add a query in the Query pane, and then select the Stream logs button in the primary toolbar. As Logging stores the logs data in log buckets, only those logs that match the query are shown in the Query results pane. When a query isn't provided, Logging shows each log entry as it's stored.
To stop streaming, click stop Stop stream, or manually scroll to pause the stream.
Query pane
To build a query in the Logs Explorer, use the query pane. In the query pane, you can build and refine queries by using the following features:
Select which resources are searched for log entries. Queries that you write filter the log entries returned by the search.
Search all fields: Find log entries that match your search terms or phrases. Any search terms added to the Search all fields field are added to the query-editor field and are evaluated as part of your query expression. For more information, see Search for text across log fields.
Filter menus: Build queries by using various menus to select resources, log names, severity levels, and correlation to other logs. For more information, see Use filter menus.
Query-editor field: Build advanced queries by using the Logging query language. If you don't see the query-editor field, enable Show query. For more information, see Write advanced queries using the Logging query language.
After you review your query, click Run query. Logs that match your query are listed under the Query results pane. The Timeline and Fields panes also adjust according to the query expression.
Select which resources are searched for log entries
This section describes how to view or change which resources are searched for
log entries. If you enter a query, then the Logs Explorer displays only the
fetched log entries which also match the query.
For example, adding the query severity>=ERROR results in
the display listing only those log entries with a severity level of at
least ERROR.
To determine which log entries to display, the Logs Explorer page searches the resources listed in the default log scope. When the default log scope isn't accessible, the page searches for the log entries that originate in your selected project, folder, or organization. When projects are searched, the search results include the log entries that are routed to the project by a sink in another project, and then stored in a log bucket.
For your current session, you can configure which resources the Logs Explorer searches for log entries. For example, when troubleshooting, you might want to examine only those log entries that are included in a log view or that originate in a specific Google Cloud project.
The toolbar in the Query pane displays the resources searched for log entries:
 Project logs and
  _Default:
Log entries that originate in the selected project, folder, or organization
are returned. For projects, these log entries include those that are routed
to the project by a sink in another project.
_Default:
Log entries that originate in the selected project, folder, or organization
are returned. For projects, these log entries include those that are routed
to the project by a sink in another project. N log view: Log entries included in the N log views
are returned. You can expand the menu to list the log views.
N log view: Log entries included in the N log views
are returned. You can expand the menu to list the log views.- my-custom-scope, where "my-custom-scope" is the name of
a custom log scope: If a log scope lists log views, then the
log entries in those log views are returned. If a log scope lists
other resources, like projects, then log entries that originate in those
resources are returned. For more information, see
Create and manage log scopes.
When you want to change which resources are searched for log entries, do the following:
Go to the toolbar of the Query pane. This toolbar displays a menu that is labeled like one of the following:
- Project logs
- N log view
- my-custom-scope
Select the menu.
In the Refine scope flyout, select the storage location, and then complete the dialog.
The following information might help you complete the dialog:
When you want to view log entries routed by an aggregated sink, select
Log view as the storage location. Be sure to
then select all log views that store log entries that you want to view.For folders and organizations, the log view menu lists all log views that store log entries that originated in those resources.
For projects, the log view menu lists the log views on log buckets stored by the selected project.
To modify the log-view menu to include log views on log buckets stored in a specific project, click add_circle Import project, and then select the project.
- To configure a log scope, select
Log scope, and then click Manage scopes.
Fields pane
The Fields pane offers a high-level summary of logs data and provides an efficient way to refine a query. The entries in this pane also list the approximate number of log entries that match the corresponding filter. To get an exact count of the number of log entries received in a time interval, use Log Analytics or copy logs to a Cloud Storage bucket.
After you execute a query in the query-editor field, the Fields pane is populated based on the results of the query. The pane is divided into the following sections:
Pinned: Shows fields that you pinned for quick access. If this section isn't shown, then you haven't pinned any fields.
System metadata: Shows log entries broken down by different dimensions, corresponding to fields in the log entries.
JSON payload (most frequent): Shows the most frequent
json_payloadfields in the current query results.
For the System metadata section, the following dimensions are always available:
Resource type
If you use BindPlane to write on-premise and hybrid cloud logs, then select the resource type Generic Node.
Severity
If you want your query to filter by multiple severity levels, then use the Severity menu.
Some dimensions are dynamically populated based on the labels in your log data. For example, you might see a Service or Application dimension:
The Service dimension is shown in the following scenarios:
You have log data whose resource type is Kubernetes Container and you haven't filtered your logs by resource type. The values in the
labels.k8s-pod/applabel contribute to the the entries in the Service dimension.For example, if a log entry similar to the following is displayed as a result of your query, then the service menu includes the service named
myservice:{ ... labels: { compute.googleapis.com/resource_name: "mycluster1" k8s-pod/app: "myservice" k8s-pod/pod-template-hash: "5ffcd94fdd" } logName: "projects/my-project/logs/stdout" resource: { labels: {6} type: "k8s_container" } ... }You have log data with labels for an App Hub service or workload. These labels are of the form
apphub.workload.idorapphub.service.id. In your log entry, they are shown in theapphubentry. For example, a log entry might contain something like the following:apphub: { application: {3} workload: { criticalityType: "MEDIUM" environmentType: "STAGING" id: "my-workload-id" } }You filter your log data by the resource type of Audited Resource. The values in the
resource.labels.servicelabel contribute to the the entries in the Service dimension.You have log data that contains the
resource.labels.namespace_nameor thelabels.service.namelabel.
The Application dimension is shown when your log data contains an App Hub application ID label, which is of the form
apphub.application.id. In your log entry, this label is shown in theapphubentry:apphub: { application: { container: "projects/my-project" id: "my-app" location: "my-app-location" } workload: {3} }
Other dimensions, like Project ID, are listed based on your selections. For example, the Project ID dimension is listed when your query restricts the log entries to those whose resource type is Kubernetes Container, or when you've selected a log view.
Refine your query
To refine your query, select a value from the Fields pane. For example,
if you select Error in the Severity heading, then the
query pane is updated to include severity=ERROR.
To remove a selection, click the Clear button.
Add fields to Fields pane
You can add certain LogEntry key-value pairs to the Logs field
pane from the log entries populated in the Query results pane. For example,
if you frequently filter by the value of the jsonPayload.message field, then
add it to the Fields pane.
To add a field to the Fields pane, do the following:
In the Query results pane, expand a log entry by clicking chevron_right Expand this log entry.
Select a field's value. From the menu, select Pin to Fields panel.
The custom field appears in the Fields pane as a list of key-value pairs.
To remove a custom field from the Fields pane, click Remove next to the field.
Note that the following types of fields can't be added to the Fields pane:
- Fields related to time; for example,
receiveTimestampandprotoPayload.startTime. - Fields with high cardinality; for example,
insertIdandprotoPayload.latency. - Fields with array indexes in their path; for example,
protoPayload.authorizationInfo[0].resource.
Timeline
With the Timeline pane, you can visualize the distribution of logs over time. The timeline regenerates when you run a query, making it easier to see trends in your logs data and troubleshoot problems.
To show or hide the Timeline pane, click Collapse timeline.
Timeline features
Timeline bars: Each timeline bar represents a time range. Each bar contains a three-color breakdown for the log-severity levels captured in each bar's time range. The colors represent the following log severities:
- Blue: Low severities such as Default, Debug, Info, and Notice.
- Yellow: Medium severities such as Warning.
- Red: High severities such as Error, Critical, Alert, and Emergency.
Each bar in the Timeline features a menu with options to analyze your logs.
Time controls: Let you adjust the time range of the logs you see in the Query results pane. For details on these options, see Analyze logs using time controls.
Time range: Shows you the time range of the logs, represented by histogram bars. The timeline helps to orient you to the logs you're viewing within the larger time range of your query.
Analyze logs using time controls
You can use time controls in the timeline to help you investigate and analyze your logs data.
Adjust time controls
The timeline provides time controls that let you adjust the data that you see in the Logs Explorer:
Time handles: Drag the timeline's handles inward to narrow the data or outward to widen the data in the timeline. Click Run.
Slide the timeline forward and backward: Click chevron_right Forward arrow to slide the timeline to a later time. Click chevron_left Backward arrow to slide the timeline to an earlier time.
Zoom in and out: Click zoom_out Zoom-out to broaden the data shown in the timeline. Click zoom_in Zoom-in to narrow the data shown in the timeline.
Hide timeline: Click Collapse timeline to hide the timeline.
Timeline modifications are constrained to be between the current time ("now") and up to 30 days in the past.
Scroll or zoom to time
In addition to the time controls previously listed, the timeline provides the Scroll to time and Zoom to time features to give you more in-depth control of the timeline and the data that you see in other panes in the Logs Explorer. Perhaps a particular bar in the timeline interests you based on its relative size or severity levels. You can select that bar to adjust the logs data you see in the Logs Explorer.
You can use the Scroll to time feature to browse your logs data without changing the values in the Timeline and Fields panes. When you select the Scroll to time feature, the following happens:
The logs data that you see in the Query results pane adjusts according to the time range captured by the selected timeline bar.
The query isn't run, but a partial reload of the data might occur to ensure you're seeing logs in the Query results pane that correspond with the selected timeline bar's time range.
The console URL updates to contain the
timestampof the most recent log captured by the time range of the selected timeline bar.
To select the Scroll to time feature, do the following:
Hold the pointer over a bar in the timeline. A pane containing summary information about the logs data for the specified time range appears.
In the pane, select Scroll to time.
Alternatively, clicking on a timeline bar is equivalent to selecting Scroll to time.
The Zoom to time feature is similar to Scroll to time, but it runs a query on your logs data based on the time range captured by a selected timeline bar. When you select the Zoom to time feature, the following happens:
- The logs data that you see in the Query results pane reloads and narrows according to the time-range restriction of the selected timeline bar.
- The console URL updates to contain the
timestampof the most recent log captured by the time range of the selected timeline bar. - The timeline changes to show only logs that have a
timestampvalue that falls within the time range of the selected timeline bar. by the selected timeline bar. - The data in the Fields pane adjusts according to the time range captured by the selected timeline bar.
To select the Zoom to time feature, do the following:
Hold the pointer over a bar in the timeline. A pane containing summary information about the logs data for the specified time range appears.
In the pane, select Zoom to time.
Query results toolbar
In the Query results toolbar, you have the following options:
- manage_search Analyze results: Aggregate and chart your query results by using Log Analytics. This button is only visible when the log bucket that contains the log view you are querying, has been upgraded to use Log Analytics. For more information, see the Analyze results section of this document.
Actions: Select from various options to further analyze your logs data:
- Highlight in results: Enter text to be highlighted in your query results.
- add_chart Create metric: Set up a log-based metric.
- call_merge Create sink: Create a log sink that auto-populates the sink's inclusion filter with the current query expression.
- add_alert Create log alert: Set up a log-based alerting policy.
- edit Manage alerts: View and manage alerting policies.
- download Download: Download your logs in CSV or JSON format. For more information, see Download logs.
Analyze results
You can aggregate, analyze, and chart your log data by using SQL queries in the Log Analytics page when your project contains log buckets that are upgraded to use Log Analytics. To go to the Log Analytics page from the Logs Explorer, in the Results toolbar, click manage_search Analyze results.
The manage_search Analyze results button is visible only when the
log bucket that contains the log view you are querying has been upgraded to use
Log Analytics. For example, if the toolbar displays
![]() N log view, then the manage_search
Analyze results button is shown when the log bucket for at least one of the
selected log views is upgraded to use Log Analytics. For more information,
see Upgrade a log bucket to use Log Analytics.
N log view, then the manage_search
Analyze results button is shown when the log bucket for at least one of the
selected log views is upgraded to use Log Analytics. For more information,
see Upgrade a log bucket to use Log Analytics.
The following occurs when you click manage_search Analyze results:
The time range in the Logs Explorer might be automatically adjusted so that there is meaningful log data in the Log Analytics page.
The Log Analytics page opens in a new tab and automatically translates the current Logging query language query into a SQL query.
The resource selected by the Google Cloud project picker and a toolbar setting determine how the
FROMclause in the SQL query is constructed. The selected resource can be a project, folder, or organization:If the toolbar displays
Project logs or
_Default,
then the resource's _Requiredand_Defaultbuckets are queried.If the toolbar displays
N log view, then
log views on log buckets in the current project are queried.
Log views on log buckets stored by different resources are ignored.If the toolbar displays
myscope, where "myscope"
is the name of a custom log scope, then the previous
rules are applied to the resources listed in the selected
log scope.
For example, if the log scope contains log views, then only those
log views on log buckets stored by the resource are queried.
In the Log Analytics page, you can view your results in tabular form, or as a chart. In the Chart tab, you can select the data that is charted, customize the chart configuration, or save a chart to a custom dashboard. For information about creating charts from your query results and saving charts to a custom dashboard, see Chart query results with Log Analytics.
For information about using SQL to write queries, see Query and view logs in Log Analytics.
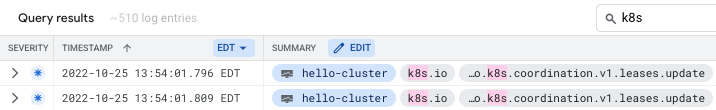
Search your query results
To search the contents of the Query results, click Highlight in results in the Query results pane, and then enter your search term. This filter lets you find information in your log entries without building a new query.
Terms that match the search criteria are highlighted in log entries within the Query results pane:
Download logs
To get the permissions that
you need to download logs,
ask your administrator to grant you the
Logs View Accessor (roles/logging.viewAccessor)
IAM role on your project.
For more information about granting roles, see Manage access to projects, folders, and organizations.
logging.logEntries.download permission. You can also
grant a role that contains the logging.logEntries.list permission, which lets
a principal view and download logs.
You might also be able to get these permissions with custom roles or other predefined roles.
To download your logs, do the following:
In the Actions menu of the Query results pane, click Download.
In the Download logs dialog, select CSV or JSON format, and then click Download.
Select what to do with the log data. You have the following options:
- Download the data to your computer.
- Download the data to Google Drive.
- View the data in a new tab.
When you save a CSV and select Google Drive, you can open the file in Google Sheets.
For troubleshooting information, see Download of logs fails.
View your query results
To view the results of your queries, use the Query results pane. To help you troubleshoot your applications, you can view the details of individual log entries, and group and analyze log entries to find patterns in your logs.
Summarize a log entry by using Gemini assistance
When investigating an issue, you can use Gemini to generate a summary of the log entry. To generate a summary of a log entry, do the following:
After you run a query, in the Query results pane, select the log entry that you want to summarize.
In the toolbar for the log entry, click Explain this log entry.
Cloud Logging sends the text of the log entry to Gemini Cloud Assist with a prompt to summarize the contents of the log entry. Gemini Cloud Assist responds with a generated summary in the Gemini pane. The summary is based only on the text of the log entry without any additional context.
For more information about summarizing your log entries by using Gemini Cloud Assist, see Summarize log entries with Gemini assistance.
Troubleshoot an issue by using Gemini assistance
To get help with troubleshooting an issue, create a Gemini Cloud Assist investigation. Investigations use log and metric data to gather insights about your complex and distributed environments and they can help you understand, diagnose, and resolve issues in your Google Cloud infrastructure and applications.
To create an investigation, do the following:
- Select a log entry that has a severity level of at least
WARNING. - Go to the toolbar for the log entry and click Investigate.
You might create an investigation to determine probable causes of issues and apply Gemini Cloud Assist-recommended solutions to help you resolve these issues. For more information about investigations, see the following documentation:
- Troubleshoot issues with Gemini Cloud Assist investigations
- Create a Gemini Cloud Assist investigation
- Manage Gemini Cloud Assist investigations
View similar log entries
You can view log entries that are similar to a selected log entry, which lets you focus on logs of interest.
To show similar log entries, do the following:
In the Query results pane, on a log entry, click chevron_right Expand.
Click Similar entries, and select Show similar entries.
The query updates with a query similar to the following and reloads the query results:
--Show similar entries
protoPayload.methodName="io.k8s.core.v1.configmaps.update"
--End of show similar entries
To see a preview of the similar log entries, do the following:
In the Query results pane, on a log entry, click chevron_right Expand.
Expand the Similar entries menu, and then select Preview similar entries.
A separate dialog opens with the following information:
- The pattern that was found
- The percentage of log entries that contain the pattern
- Example log entries that contain the pattern
In this dialog, you can hide or show log entries:
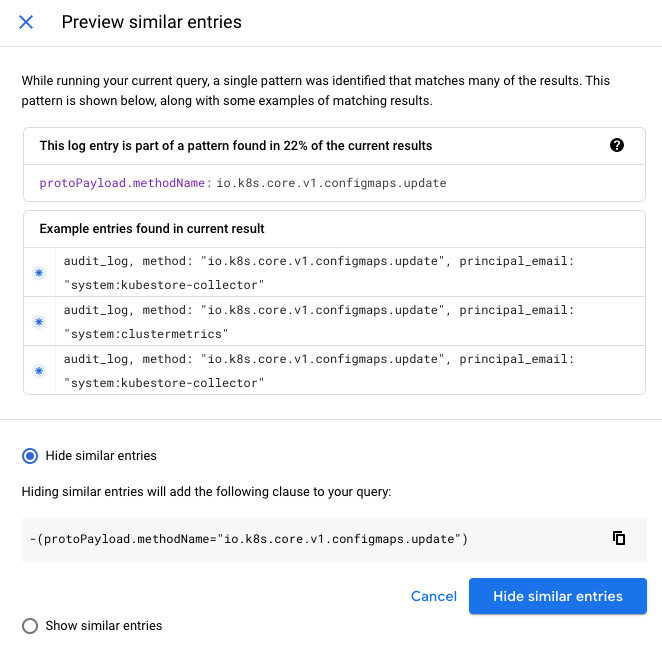
Hide similar log entries
You can hide similar log entries, which lets you remove logs from your query results.
There are two ways to hide similar log entries:
Hide large amounts of automatically grouped log entries. When you run a query, the query results are analyzed for patterns and log entries are then automatically grouped based on similar log field content.
If a significant pattern is detected, a banner appears in the Query results pane showing the percentage of results that can be hidden.
Hide similar entries: This button adds a clause to the query and reloads the query results.
Preview: A separate window opens which describes the pattern found, and shows examples of the entries.
When you hide similar logs, no information is saved outside of the Logs Explorer session. Each query produces a new analysis, based only on the logs shown. Different queries analyze different portions of the log entries depending on the types of logs returned.
Hide log entries similar to a specific log entry.
To hide log entries similar to a log entry, click chevron_right Expand, click the Similar entries menu and then select Hide similar entries.
The query updates and the Query results pane reloads. Log entries similar to the selected log entry aren't displayed.
View or hide log entries that match a field
You can view or hide log entries that match a field in a log entry, which lets you focus on entries that contain the same field content.
To view or hide log entries that match a specific field in a log entry, do the following:
In the Query results pane, on the log entry, click chevron_right Expand.
Click a field's value within the log entry, such as
compute.googleapis.com, which is aserviceName.From the menu, select Show matching entries or Hide matching entries.
The query updates with a query that shows or hides similar entries, and the Query results reload with new results.
Pin log entries
After you run a query, you can highlight a log entry by pinning it. The pinned log entry stays centered in the Query results pane. If you run a new query and the pinned log entry isn't included, then you are prompted to unpin the log entry.
To pin a log entry, do the following:
- Hold the pointer over the log entry that you want to pin.
- Click push_pin Pin.
After you pin a log entry, its background is darkened, and a
push_pin Pin icon is shown. A pin icon
also appears on the Timeline pane based on the pinned log entry's
timestamp.
To unpin a log entry, click the pin icon again.
Show logs that match the resource of a pinned log entry
After you pin a log entry, you can run a new query that displays log entries that match the resource type or resource labels of the pinned log.
To pin a log entry and display log entries that match the same resource type or resource labels, do the following:
Click arrow_drop_down Down arrow next to the pinned log to expand the pin menu.
Make a selection from the pin menu:
To rerun the query with the same
resource.typeas the pinned log, select Same resource.type.For example, suppose you pin a log entry with a
resource.typeofk8s_node. If you select Same resource.type, then the query is rerun to display all log entries withresource.type="k8s_node".To rerun the query with the same
resource.labelsas the pinned log, select Same resource.labels.
- To rerun the query with the same
traceas the pinned log, select Same trace.
- To clear the query and show all log entries, select Show all.
View a pinned log entry in the Timeline
You can use the Timeline to highlight, scroll to, and further examine a pinned log entry.
Using the Timeline, click push_pin Pin, and then choose from the following menu options:
- Scroll to log entry: Bring the log entry into the current Query results pane and view the pinned log entry in the context of nearby logs.
- Zoom to log entry: Narrow the time range that the Timeline pane displays and refine your query to isolate the logs near the pinned log.
- Unpin: Unpin a log entry.
View trace data
When a log entry contains both the trace and the latency-related field, both
the latency and trace icon appear.
When a log entry contains only the trace field, then only the trace icon appears.
![]()
To view the trace data related to the log entry, click the trace icon. You have the following options:
- View trace details: Shows the parent span and child traces along with details about the trace. To view more details about the trace, navigate to Cloud Trace by clicking View in Trace. For more information about the content in the details panel, see Find and explore traces.
Show all logs for this trace: Refines and runs the query by adding the
tracefield set to the identifier of the trace associated with the log entry.Show only traced requests: Refines and runs the query by adding the
traceSampledfield set toTrue. For more information on sampling, see Sampling rate.
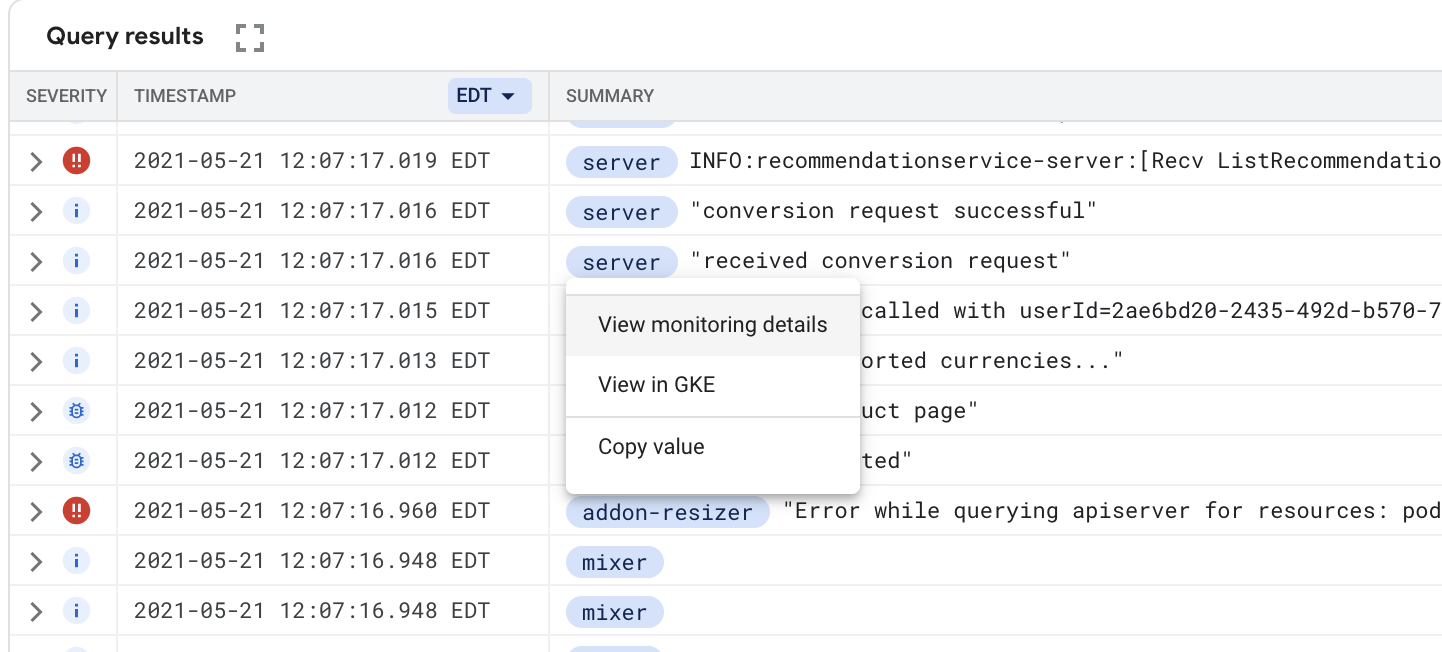
View Monitoring data
For certain logs, such as GKE and Compute Engine logs, you can select the resource type from the log's summary line to display a menu with the following options:
- View monitoring details: opens a details panel for a GKE resource. For information on the details panel, see View resource details.
- View in Monitoring: opens to a Monitoring page for the resource.
- View in GKE or View in Compute Engine: opens the Details page for the resource within the GKE or Compute Engine user interface.
Copy a link to a log entry
To share a link to a log, expand a log entry, and then select content_copy Copy. You can choose to copy a log in JSON, or a link to the log. The link is copied to your clipboard. You can send the link to users who have access to the Google Cloud project. When a user pastes the link into a browser or selects it, Logging pins the log entry in their Query results pane.
Example queries
For suggested queries, arranged by Google Cloud product and use case, see Sample queries using the Logs Explorer. For example, you can run Kubernetes-related queries to find Google Kubernetes Engine logs.
View Compute Engine logs
For certain Compute Engine resource types, such as gce_instance and
gce_network, you see the resource name with the resource ID as subtext in
several places in the Logs Explorer. For example, for the gce_instance
resource type, you see the VM name alongside the VM ID. The resource names help
you identify the correct resource ID, on which you can build queries.
You might see Compute Engine resource names in the following places:
- Query pane filter menus: Compute Engine resource types show resource names, with their corresponding resource IDs as subtext.
- Fields: Compute Engine resource types show the resource name, rather than the resource ID, in the field dimensions.
- Query results: For Compute Engine VM instance logs, the
resource.labelsfield shows metadata with the corresponding resource name. - Summary fields: For Compute Engine VM instance logs, the chip shows the resource name instead of the resource ID.
Troubleshoot
This section provides instructions for troubleshooting common issues when using the Logs Explorer.
If you're experiencing issues when trying to view logs in sink destinations, see Troubleshoot routing and sinks.
Download of logs fails
You are using the Logs Explorer and click download Download. The command starts but then fails to complete or reports an error.
To resolve this issue, reduce the time it takes for the command to execute by trying the following:
- In the Download logs dialog, reduce the value of Maximum log entries.
- Reduce the time period over which logs are queried.
- In the query results toolbar, click Hide similar entries before you begin the download.
- Modify your query to use indexed fields.
Can't find console logs for a VM instance
Logs written to the console of a Compute Engine instance might not be available in the Logs Explorer. To view these logs, do the following:
-
In the Google Cloud console, go to the VM instances page:
If you use the search bar to find this page, then select the result whose subheading is Compute Engine.
Select the instance, and then select Serial port 1 (console) in the Logs section of the page.
You can configure your instances such that their serial port output is sent to Cloud Logging. For more information, see Enabling and disabling serial port output logging.
Get Google Cloud project or organization ID
To get a Google Cloud project or organization ID from anywhere in the Google Cloud console, expand the list of Google Cloud projects from the Google Cloud project and organization selector and find the Google Cloud project ID in the ID column.
Can't see log entries
If you don't see any log entries, check the following:
Verify that the correct Google Cloud project is selected.
Verify that your Google Cloud project is using resources that generate logs and that there is activity on those resources. Even if the Google Cloud project is new, it should have audit logs recording the fact that it was created. For information about how to verify that you're using a resource that generates logs, see Mapping services to resource types.
Ensure that the time range isn't too narrow.
View your current exclusion queries to ensure that the logs you're looking for aren't accidentally excluded.
Ensure that you have permission to view the log entries in the projects and log views referenced by setting of the Refine scope menu. For information about how to adjust the scope of your search, see Refine scope.
My query is correct but I still don't see log entries
You can't see log entries that are older than the Logging retention period. See Log retention periods for the logs retention period in effect.
During periods of heavy load, there could be delays in sending logs to Logging or in receiving and displaying the logs.
The Logs Explorer doesn't show log entries that have timestamps in the future until the current time has "caught up" with them. This is an unusual situation, probably caused by a time skew in the application sending the logs.
The query scope was set too large and couldn't complete within a reasonable amount of time. You might see this as "deadline expired before operation could complete". Try making your query more specific or reducing the time range.
Query returns an error
If you issue a query over a resource without specifying a bucket, then
Cloud Logging uses the history of the sinks in the Google Cloud project to
determine where entries might have been written for that resource. If
Cloud Logging identifies more than 200 buckets where entries
might have been written, then the query fails with the message
Error: Invalid query.
To resolve this issue, refine the scope of your query to a subset of the storage. For more information, see Refine scope.
Query results time range doesn't match query
The logs data you see in the Query results and Fields pane adjusts according to the time range captured by the histogram timeline. You adjust the histogram timeline using the histogram's time controls or the time-range selector. Adjusting these time controls doesn't alter the query expression in the Query pane.
When you have a query with a timestamp, the time-range selector is disabled. The query uses the timestamp expression as its time-range restriction. If a query doesn't use a timestamp expression, then the query uses the time-range selector as its time-range restriction.
Get support
For information on getting support, see the Google Cloud Observability support page.