Verifique se o papel de gerenciamento de identidade e acesso inclui as permissões necessárias para
criar e visualizar métricas baseadas em registros e criar políticas de alerta.
Para mais detalhes, consulte Permissões para métricas com base em registros.
Listar métricas com base em registros
Para conferir uma lista de métricas com base em registros do projeto Google Cloud , faça o
seguinte:
No Google Cloud console, acesse a página Métricas com base em registros:
Se você usar a barra de pesquisa para encontrar essa página, selecione o resultado com o subtítulo Logging.
Selecione um projeto Google Cloud atual.
A interface das métricas com base em registros mostra duas listas de tipos de métrica:
Métricas do sistema e Métricas definidas pelo usuário.
O painel Métricas definidas pelo usuário da interface de métricas com base em registros tem
vários recursos para ajudar você a gerenciar as métricas definidas pelo usuário no seu
projetoGoogle Cloud :
A tabela de métricas definidas pelo usuário inclui as colunas Nome, Descrição, Tipo e Filtro. Esses campos são especificados quando você cria a métrica.
O painel Filtrar métricas definidas pelo usuário permite filtrar a lista de métricas por Nome, Descrição e Filtro da métrica ou com uma pesquisa de texto.
A tabela de métricas definidas pelo usuário inclui colunas de Uso no mês anterior e Uso acumulado no mês (MTD). Esses dados de uso são úteis, por exemplo, se você quiser determinar quais métricas ingerem mais dados ou estimar faturas.
O menu more_vertMais de cada métrica no painel de métricas definidas pelo usuário contém outros recursos para gerenciar suas métricas:
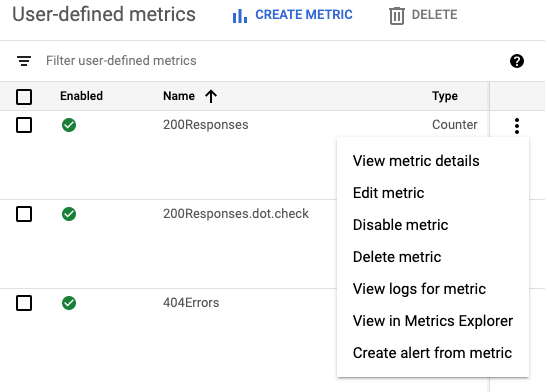
Ver detalhes da métrica: mostra Nome, Tipo, descrição, Filtro, Unidade e Rótulos da métrica, se definidos.
Editar métrica: permite editar determinados campos da métrica.
Desativar métrica: permite que você pare de calcular a métrica.
É possível reativar uma métrica desativada no mesmo menu.
Excluir métrica: permite excluir a métrica.
Visualizar registros da métrica: direciona você para o Explorador de registros, preenche o filtro da métrica no Criador de consultas e executa a consulta.
Visualizar no Metrics Explorer: permite criar gráficos da métrica.
Criar alerta com base em métrica: permite configurar notificações quando uma métrica com base em registros corresponde aos critérios especificados. Para mais
informações, consulte Alertar sobre métricas com base em registros.
Criar gráficos de métricas com base em registros
Para criar um gráfico de uma métrica com base em registros, faça o seguinte:
No Google Cloud console, acesse a página Métricas com base em registros:
Se você usar a barra de pesquisa para encontrar essa página, selecione o resultado com o subtítulo Logging.
Encontre a métrica que você quer visualizar e selecione Ver no Metrics Explorer no menu more_vertMais da métrica.
O Metrics Explorer é aberto e
preconfigured para você. No entanto, talvez você queira mudar algumas configurações
do gráfico.
Por exemplo, a captura de tela a seguir mostra um gráfico da métrica do sistema
com o nome byte_count para um projeto Google Cloud específico:
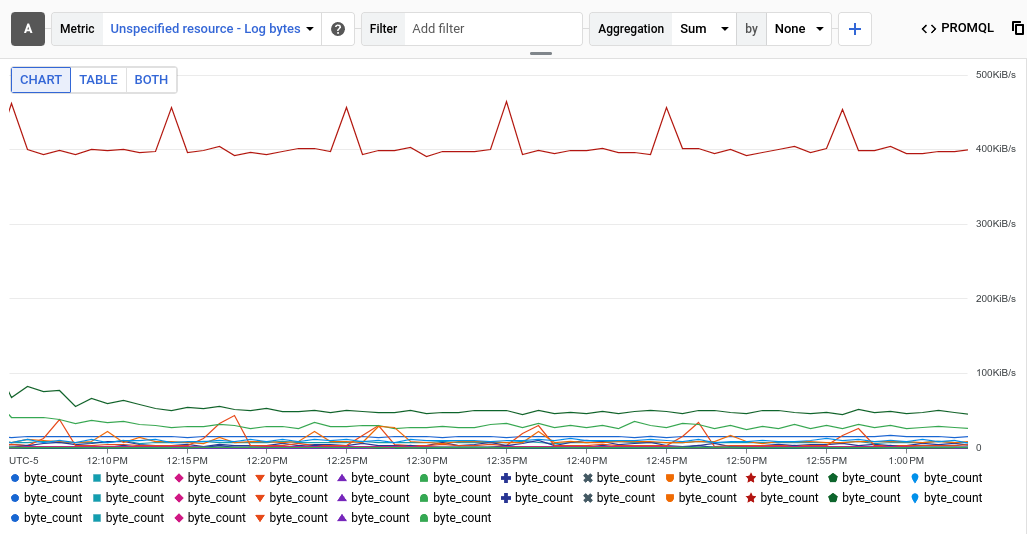
A entrada Aggregation mostra que cada série temporal no gráfico é
uma soma dos bytes gravados em um registro específico. No exemplo anterior, o
projeto contém vários registros, então o gráfico mostra várias séries temporais.
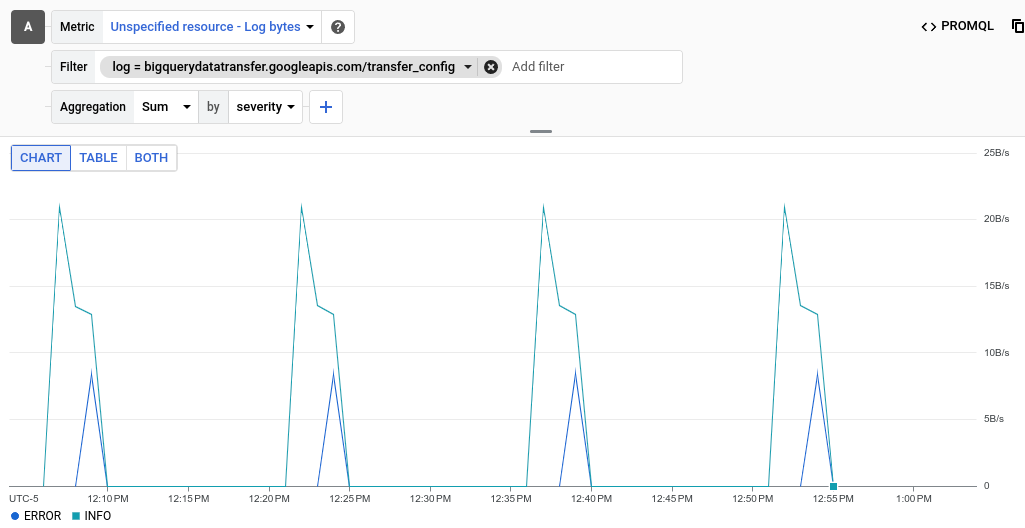
Para conferir os dados de um registro específico, adicione um filtro. Por exemplo, para conferir a métrica byte_count das entradas de registro gravadas pelo BigQuery, clique em Adicionar filtro, selecione registro e a entrada do BigQuery. O gráfico agora mostra uma única série temporal, que mostra o total de bytes de registro gravados pelo BigQuery.
Se você quiser conferir a métrica byte_count pela gravidade da entrada de registro, mude o segundo menu na entrada Aggregation de None para Severity. O gráfico a seguir mostra a métrica byte_count
exibida por nível de gravidade para registros gravados pelo BigQuery:
Para métricas com valores de distribuição e com base em registros, expanda Gráfico de linhas e
selecione Gráfico de mapa de calor.
Opcional: para salvar o gráfico para referência futura, clique em Save chart
na barra de ferramentas e preencha a caixa de diálogo. É possível salvar o gráfico em um painel existente ou criar um novo.
[[["Fácil de entender","easyToUnderstand","thumb-up"],["Meu problema foi resolvido","solvedMyProblem","thumb-up"],["Outro","otherUp","thumb-up"]],[["Difícil de entender","hardToUnderstand","thumb-down"],["Informações incorretas ou exemplo de código","incorrectInformationOrSampleCode","thumb-down"],["Não contém as informações/amostras de que eu preciso","missingTheInformationSamplesINeed","thumb-down"],["Problema na tradução","translationIssue","thumb-down"],["Outro","otherDown","thumb-down"]],["Última atualização 2025-08-11 UTC."],[],[],null,["# List and chart log-based metrics\n\nThis document describes how to list and chart log-based metrics by using the\nGoogle Cloud console. For information about creating log-based metrics, see\n[Configure counter metrics](/logging/docs/logs-based-metrics/counter-metrics)\nand [Configure distribution metrics](/logging/docs/logs-based-metrics/distribution-metrics).\n\nBefore you begin\n----------------\n\nEnsure that your Identity and Access Management role includes the permissions required to\ncreate and view log-based metrics, and to create alerting policies.\nFor details, see\n[Permissions for log-based metrics](/logging/docs/access-control#metrics-permissions).\n\nList log-based metrics\n----------------------\n\nTo view a list of log-based metrics for your Google Cloud project, do the\nfollowing:\n\n1. In the Google Cloud console, go to the **Log-based Metrics** page:\n\n [Go to **Log-based Metrics**](https://console.cloud.google.com/logs/metrics)\n\n \u003cbr /\u003e\n\n If you use the search bar to find this page, then select the result whose subheading is\n **Logging**.\n2. Select an existing Google Cloud project.\n The log-based metrics interface displays two lists of metric-types:\n **System metrics** and **User-defined metrics**.\n\n The **User-defined metrics** pane of the log-based metrics interface has\n several features to help you manage the user-defined metrics in your\n Google Cloud project:\n - The user-defined metrics table includes **Name** , **Description** ,\n **Type** , and **Filter** columns. These fields are specified when you\n create the metric.\n\n - The **Filter user-defined metrics** pane lets you filter your metric list\n by text search or metric **Name** , **Description** , and **Filter**.\n\n - The user-defined metrics table includes columns for\n **Previous month usage** and **Month-to-date usage (MTD)** . This usage\n data is useful, for example, if\n you want to determine which metrics ingest the most data or to\n [estimate your bills](/stackdriver/estimating-bills).\n\n The *more_vert* **More** menu for each metric in your user-defined\n metrics pane contains additional features for managing your metrics:\n\n - **View metric details** : Shows you the metric's **Name** , **Type** , **Description** , **Filter** , **Units** , and **Labels**, if defined.\n - **Edit metric**: Lets you edit certain fields for the metric.\n - **Disable metric**: Lets you stops the metric from being calculated. You can re-enable a disabled metric from the same menu.\n - **Delete metric**: Lets you delete the metric.\n - **View logs for metric** : Takes you to the Logs Explorer and populates the metric's filter in the **Query builder** and runs the query.\n - **View in Metrics Explorer**: Lets you chart the metric.\n - **Create alert from metric** : Lets you configure notifications when a log-based metric matches criteria that you specify. For more information, see [Alert on log-based metrics](/logging/docs/logs-based-metrics/charts-and-alerts).\n\nChart log-based metrics\n-----------------------\n\nTo create a chart of a log-based metric, do the following:\n\n1. In the Google Cloud console, go to the **Log-based Metrics** page:\n\n [Go to **Log-based Metrics**](https://console.cloud.google.com/logs/metrics)\n\n \u003cbr /\u003e\n\n If you use the search bar to find this page, then select the result whose subheading is\n **Logging**.\n2. Find the metric you want to view, and then select\n **View in Metrics Explorer** from the metric's *more_vert* **More**\n menu.\n\n [Metrics Explorer](/monitoring/charts/metrics-explorer) opens and\n is preconfigured for you. However, you might want to change some chart\n settings.\n\n For example, the following screenshot shows a chart of the system metric\n with the name `byte_count` for a particular Google Cloud project:\n\n The **Aggregation** entry shows that each time series on the chart is\n a sum of the bytes written to a specific log. In the previous example, the\n project contains multiple logs, so the chart displays multiple time series.\n\n To view the data for a specific log, add a filter. For example, to view the\n `byte_count` metric for log entries written by BigQuery,\n click **Add filter** , select **log** , and then select the BigQuery\n entry. The chart now displays a single time series, which shows the total of\n the log bytes written by BigQuery.\n If you want to view the `byte_count` metric by the severity of the\n log entry, then change the second menu in the **Aggregation** entry from\n **None** to **Severity** . The following chart shows the `byte_count` metric\n displayed by severity level for logs written by BigQuery:\n\n3. For distribution-valued log-based metrics, expand **Line chart** and\n select **Heatmap chart**.\n\n For more information about distribution-valued metrics, see\n [Distribution metrics](/monitoring/charts/charting-distribution-metrics) and\n [Percentiles and distribution-valued metrics](/monitoring/api/v3/distribution-metrics).\n4. Optional: To save the chart for future reference, click **Save chart**\n in the toolbar, and then complete the dialog. You can save the\n chart to an existing dashboard or create a new dashboard.\n\n| **Tip:** If you don't see any data in the graph, try increasing the time interval, which defaults to one hour, or changing the default settings.\n\nWhat's next\n-----------\n\n- To create an alerting policy for a log-based metric, see [Alert on log-based metrics](/logging/docs/logs-based-metrics/charts-and-alerts).\n- For more information about charting metric data, see these\n Monitoring resources:\n\n - [Metrics Explorer](/monitoring/charts/metrics-explorer)\n - [Creating charts](/monitoring/charts)"]]