This document describes how to query and analyze your log data by using Log Analytics, which provides a SQL-based query interface. By using SQL, you can perform tasks like count the log entries with a field that match a pattern. Log Analytics provides a SQL editor and a menu-based system for building queries. To view your query results, you can use the tabular form, or you can visualize the data as a chart. You can save your charts to your custom dashboards.
You can query either a log view on a log bucket or an
analytics view. When you query a log view, the
schema corresponds to that of the LogEntry data structure.
Because the creator of an analytics view determines the schema, one use
case for analytics views is to transform log data from the
LogEntry format into a format that is more suitable for you.
Log Analytics doesn't deduplicate log entries, which might affect how you write your queries. Also, there are some restrictions when using Log Analytics. For more information about these topics, see the following documents:
- Troubleshoot: There are duplicate log entries in my Log Analytics results.
- Log Analytics: Restrictions.
About linked datasets
Log Analytics supports the creation of linked BigQuery datasets, which let BigQuery have read access to the underlying data. If you choose to create a linked dataset, then you can do the following:
- Join log entry data with other BigQuery datasets.
- Query log data from another service like the BigQuery Studio page or Looker Studio.
- Improve the performance of the queries that you run from the Log Analytics by running them on your BigQuery reserved slots.
- Create an alerting policy that monitors the result of a SQL query. For more information, see Monitor your SQL query results with an alerting policy.
This document doesn't describe how to create a linked dataset or how to configure the Log Analytics to run queries on reserved slots. If you are interested in those topics, then see Query a linked dataset in BigQuery.
Before you begin
This section describes steps that you must complete before you can use Log Analytics.
Configure log buckets
Ensure that your log buckets have been upgraded to use Log Analytics:
-
In the Google Cloud console, go to the Logs Storage page:
If you use the search bar to find this page, then select the result whose subheading is Logging.
- For each log bucket that has a log view that you want to query, ensure that the Log Analytics available column displays Open. If Upgrade is shown, then click Upgrade and complete the dialog.
Configure IAM roles and permissions
This section describes the IAM roles or permissions that are required to use Log Analytics:
-
To get the permissions that you need to use Log Analytics and query log views, ask your administrator to grant you the following IAM roles on your project:
-
To query the
_Requiredand_Defaultlog buckets: Logs Viewer (roles/logging.viewer) -
To query all log views in a project:
Logs View Accessor (
roles/logging.viewAccessor)
You can restrict a principal to a specific log view either by adding an IAM condition to the Logs View Accessor role grant made at the project level, or by adding an IAM binding to the policy file of the log view. For more information, see Control access to a log view.
These are the same permissions that you need to view log entries on the Logs Explorer page. For information about additional roles that you need to query views on user-defined buckets or to query the
_AllLogsview of the_Defaultlog bucket, see Cloud Logging roles. -
To query the
-
To get the permissions that you need to query analytics views, ask your administrator to grant you the Observability Analytics User (
roles/observability.analyticsUser) IAM role on your project.
Query log data
This section describes the approaches that you can use to query your log data:
- Load a system-defined query, edit this query, and then run the query.
- Enter and run a custom query. For example, you might paste in a query you have or write one. Custom queries can include joins, nested queries, and other complex SQL statements. For examples, see Sample SQL queries.
- Build a query by making menu selections and then run that query. Log Analytics converts your selections into a SQL query, which you can both view and edit.
Load, edit, and run the system-defined query
-
In the Google Cloud console, go to the Log Analytics page:
If you use the search bar to find this page, then select the result whose subheading is Logging.
In the Views menu, go to the Logs or Analytics Views section, and select the view that you want to query.
To find the view to query, use the filter_list Filter bar or scroll through the list:
Log views are listed by
BUCKET_ID.LOG_VIEW_ID, where these fields refer to the IDs of the log bucket and log view.Analytics views are listed by
LOCATION.ANALYTICS_VIEW_ID, where these fields refer to the location and ID of an analytics view. Analytics views are in Public Preview.
Do one of the following:
To load a system-defined query that relies on the Query Builder, which lets you define the query with menu selections, make sure that the Query pane displays Query Builder. If a SQL editor is shown, then click tune Builder.
To load a system-defined query that extracts JSON values, then make sure that Query pane displays the SQL editor. If this pane displays Query Builder, then click code SQL.
In the Schema pane, select Query, and then click Overwrite.
The Query pane displays a system-defined query. If you selected the Query Builder mode but want to view the SQL query, click code SQL.
Optional: Modify the query.
To run the query, go to the toolbar and select Run Query.
Log Analytics presents the query results in a table. However, you can create a chart, and you can also save the table or chart to a custom dashboard. For more information, see Chart SQL query results.
If the toolbar displays Run in BigQuery, then you need to switch Log Analytics to use the default query engine. To make this change, in the toolbar of the Query pane, click settings Settings and then select Analytics (default).
Enter and run a custom query
To enter a SQL query, then do the following:
-
In the Google Cloud console, go to the Log Analytics page:
If you use the search bar to find this page, then select the result whose subheading is Logging.
In the Query pane, click the code SQL.
To specify a time range, we recommend that you use the time-range selector. If you add a
WHEREclause that specifies thetimestampfield, then that value overrides the setting in the time-range selector and that selector is disabled.For examples, see Sample SQL queries.
You can query log views or analytics views. Use the following format for the
FROMclause:Log views:
FROM `PROJECT_ID.LOCATION.BUCKET_ID.LOG_VIEW_ID`Analytics views:
FROM `analytics_view.PROJECT_ID.LOCATION.ANALYTICS_VIEW_ID`
The fields in the previous expressions have the following meaning:
- PROJECT_ID: The identifier of the project.
- LOCATION: The location of the log view or the analytics view.
- BUCKET_ID: The name or ID of the log bucket.
- LOG_VIEW_ID: The identifier of the log view, which is limited to 100 characters and can include only letters, digits, underscores, and hyphens.
- ANALYTICS_VIEW_ID: The ID of the analytics view, which is limited to 100 characters and can include only letters, digits, underscores, and hyphens.
If the query pane displays an error message that references the
FROMstatement, then the view can't be found. For information about how to resolve this failure, see ErrorFROMclause must contain exactly one log view.
To run the query, go to the toolbar and select Run Query.
Log Analytics presents the query results in a table. However, you can create a chart, and you can also save the table or chart to a custom dashboard. For more information, see Chart SQL query results.
If the toolbar displays Run in BigQuery, then you need to switch Log Analytics to use the default query engine. To make this change, in the toolbar of the Query pane, click settings Settings and then select Analytics (default).
Build, edit, and run a query
The Query Builder interface lets you build a query by making selections from menus. Log Analytics converts your selections into a SQL query, which you can view and edit. For example, you might start by using the Query Builder interface and then switch to the SQL editor to refine your query.
Log Analytics can always convert your menu-selections from the Query Builder interface into a SQL query. However, not all SQL queries can be represented by the Query Builder interface. For example, queries with joins can't be represented by this interface.
To build a query, do the following:
-
In the Google Cloud console, go to the Log Analytics page:
If you use the search bar to find this page, then select the result whose subheading is Logging.
If the Query pane displays a SQL editor, then select tune Builder, which opens the Query Builder pane.
Use the Source menu to select the view you want to query. Your selections are mapped to the
FROMclause in the SQL query.Optional: Use the following menus to restrict or format the result table:
Search all fields: Search for matching strings. Your selections are mapped to the
WHEREclause in the SQL query.Columns: Select the columns that appear in the result table. Your selections are mapped to the
SELECTclauses in the SQL query.When you select a field name in this menu, a dialog opens. In this dialog, you can do the following:
Use the menu to aggregate or group your data.
To prevent syntax errors, any aggregation and grouping you apply to one column is automatically applied to other columns as well. For an example of how to aggregate and group entries, see Group and aggregate data by using the Query Builder.
Cast a value of any type into another specified data type. For more information, see the
CASTdocumentation.Extract a substring of values by using regular expressions. For more information, see the
REGEXP_EXTRACTdocumentation.
Filters: Add filters when you want to restrict the query to spans that contain a specific attribute or span ID. The menu lists all available filter options. Your selections are mapped to the
WHEREclause in the SQL query.Sort By: Set the columns to sort by, and whether the sort is ascending or descending. Your selections are mapped to the
ORDER BYclause in the SQL query.Limit: Set the maximum number of rows in the result table. Your selections are mapped to the
LIMITclause in the SQL query.
To run the query, go to the toolbar and select Run Query.
Log Analytics presents the query results in a table. However, you can create a chart, and you can also save the table or chart to a custom dashboard. For more information, see Chart SQL query results.
If the toolbar displays Run in BigQuery, then you need to switch Log Analytics to use the default query engine. To make this change, in the toolbar of the Query pane, click settings Settings and then select Analytics (default).
Example: Group and aggregate data by using the Query Builder
When you select a column in the Query Builder, each field includes a menu where you can add grouping and aggregation. Grouping lets you organize your data into groups based on the value of one or more columns, and aggregation lets you perform calculations on these groups to return a single value.
Each field that you select in the Columns element has an attached menu with the following options:
- None: Don't group or aggregate by this field.
- Aggregate: Group fields listed in the Columns element except when the field has an Aggregate selection. For those fields, compute the value by performing an operation on all entries in each grouping. The operation might be to compute the average of a field or to do something like count the number of entries in each grouping.
- Group By: Group entries by all fields listed in the Columns element.
The following illustrates how you might construct a query that groups entries and then performs some type of aggregation.
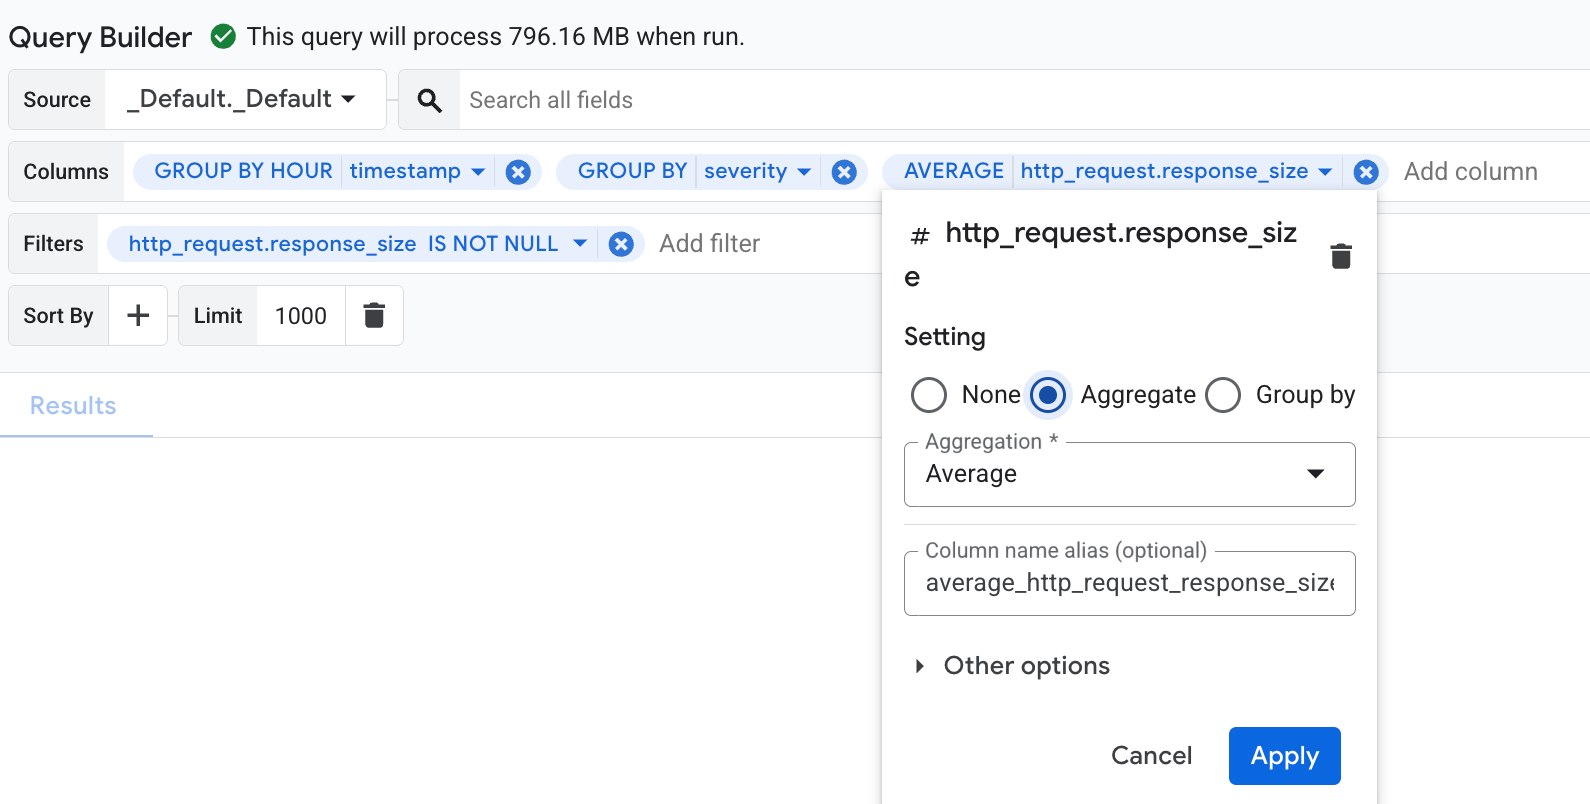
This example describes how to use the Query Builder to group
log entries by severity and timestamp, and then compute the average of the
http_request.response_size field for each group.
To build a query that groups and aggregates your data, make the following selections from the Query Builder menus:
In the Columns menu, select the
timestamp,severity, andhttp_request.response_sizefields.To group your data, click the
timestampfield to open the settings dialog. In this dialog, select the Group by option, and set the Truncation Granularity toHOUR. Grouping is then automatically applied to all other fields to prevent syntax errors. If there are invalid fields where grouping can't be applied, then you see an error message. Remove the invalid fields from the menu to resolve this error.To perform aggregation on the
http_request.response_sizefield, click the field to open the settings dialog. In this dialog, select Aggregate. In the Aggregation menu, click Average.
In the Filters menu, add
http_request.response_sizeand set the comparator toIS NOT NULL. This filter matches log entries that contain aresponse_sizevalue.Your Query Builder menus look similar to the following:
To run the query, go to the toolbar and select Run Query.
The results of this query is similar to the following:
+-----------------------------------+----------+---------------+
| Row | hour_timestamp              | severity | response_size |
|     | TIMESTAMP                   | STRING   | INTEGER       |
+-----+-----------------------------+----------+---------------+
| 1   | 2025-10-06 16:00:00.000 UTC | NOTICE   | 3082          |
| 2   | 2025-10-06 17:00:00.000 UTC | WARNING  | 338           |
| 3   | 2025-10-06 16:00:00.000 UTC | INFO     | 149           |
The corresponding SQL query for the previous example is as follows:
SELECT
  -- Truncate the timestamp by hour.
  TIMESTAMP_TRUNC( timestamp, HOUR ) AS hour_timestamp,
  severity,
  -- Compute average response_size.
  AVG( http_request.response_size ) AS average_http_request_response_size
FROM
  `PROJECT_ID.LOCATION.BUCKET_ID.LOG_VIEW_ID`
WHERE
  -- Matches log entries that have a response_size.
  http_request.response_size IS NOT NULL
GROUP BY
  -- Group log entries by timestamp and severity.
  TIMESTAMP_TRUNC( timestamp, HOUR ),
  severity
LIMIT
  1000
Display the schema
The schema defines how the data is stored, which includes the fields and their
data types. This information is important to you because the schema determines
the fields you query and whether you need to cast fields to different data
types. For example, to write a query that computes the average latency of
HTTP requests, you need to know how to access the latency field and whether it
is stored as an integer like 100 or as a string like "100". If the latency
data is stored as a string, then the query must cast the value to a numeric
value before computing an average.
To identify the schema, do the following:
-
In the Google Cloud console, go to the Log Analytics page:
If you use the search bar to find this page, then select the result whose subheading is Logging.
In the Views menu, go to the Logs or Analytics Views section, and select the view that you want to query.
The Schema pane is updated. Log Analytics automatically infers the fields of a column when the data type is JSON. To view how often these inferred fields appear in your data, click more_vert Options and select View info and description.
For log views, the schema is fixed and corresponds to the
LogEntry. For analytics views, you can modify the SQL query to change the schema.
What's next
- Learn about analytics views.
- Save and share a SQL query.
- Chart SQL query results.
- Sample SQL queries.
- Query a linked dataset in BigQuery.