The FinOps hub Utilization insights dashboard focuses on insights and recommendations for workload optimization and waste reduction. In the dashboard, you can view the estimated costs of potentially wasted usage, and take action on recommendations to reduce waste and optimize your costs.
You might use the FinOps hub Utilization insights dashboard when you want to do the following:
- View the cost of potentially wasted resources, such as idle, underprovisioned, or overprovisioned resources, and suboptimal configurations.
- Verify that resources in your projects or App Hub applications are used efficiently.
- Understand and prioritize cost optimization opportunities.
- Collaborate with Google Cloud project owners, solution owners, and DevOps managers to implement changes to optimize workloads and reduce waste.
Limitations
- When viewing insights By Service, you can view one service at a time.
- When filtering utilization insights by project, you can view all projects for an aggregated view, or select up to 10 projects for a more granular view of your potential wasted usage.
- Utilization insights are refreshed once a day.
- The waste map and resource recommendations table showcase up to 1000 resources and includes the costliest resources based on costs for the last 30 days.
- Some resource insights might not have an optimization recommendation.
- When viewing insights By Application, you can view one App Hub application at a time.
- Utilization insights are available for one Cloud Billing account at a time. The resources used in an App Hub application can be spread across projects in different organizations and billing accounts. If the projects that make up the application span multiple billing accounts, the utilization insights are limited to the projects that are linked to the billing account you are viewing, and might only be a partial view of insights for the application.
Permissions required to access the FinOps hub Utilization insights
To access the FinOps hub Utilization insights dashboard, you need the same permissions that are required to access to the FinOps hub.
To view the details of a resource recommendation, you need the Recommender Viewer role on your Cloud Billing account. Depending on the type of recommendation, you might also need project permissions to view the details and apply a recommendation.
When viewing insights by Application, to view metadata about the application,
such as Owner, Criticality, and Environment, you need the
apphub.applications.get permission. You can gain this permission using the
App Hub Viewer
predefined role.
Open the Utilization insights dashboard
To open the Utilization insights dashboard:
In the Google Cloud console, go to the FinOps hub.
At the prompt, choose the Cloud Billing account for which you want to view the FinOps hub.
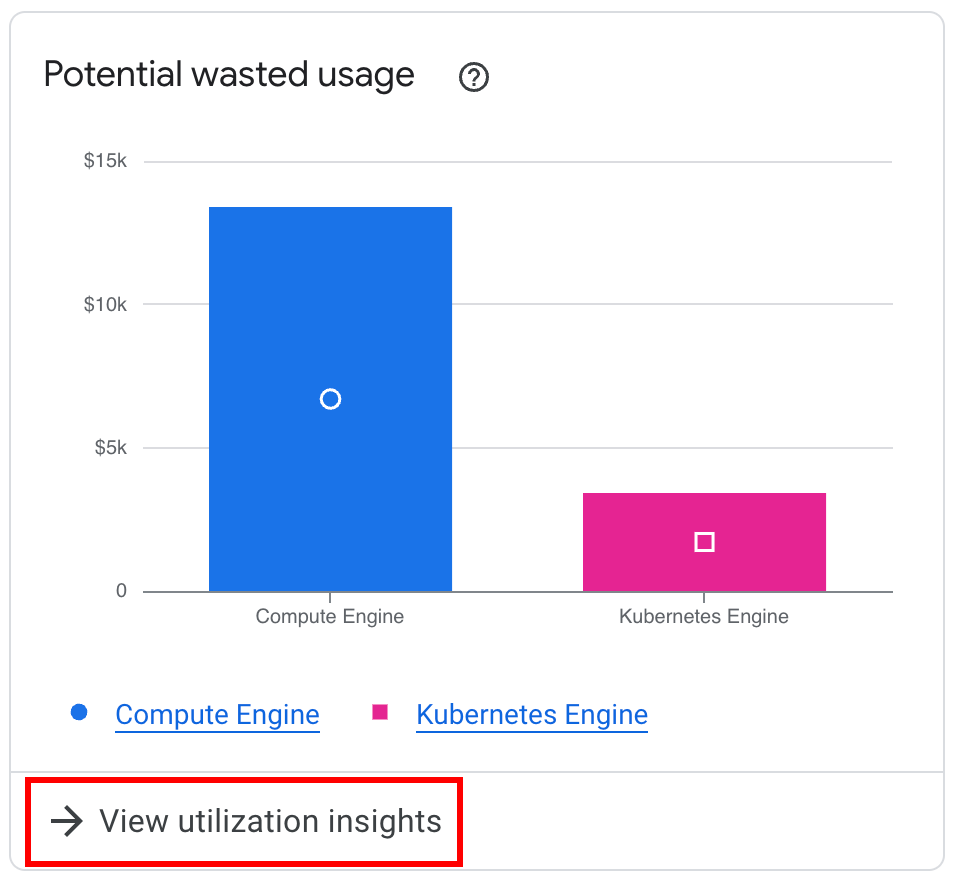
In the FinOps hub, from the Potential wasted usage chart, click View utilization insights.
Explore the Utilization insights dashboard
With the Utilization insights dashboard, you can gain better control over your Google Cloud spending, eliminate waste, and optimize your resource utilization for maximum cost efficiency.
- The dashboard supports insights for Compute Engine, Google Kubernetes Engine, Cloud Run, Cloud SQL services, and App Hub applications.
- You can view utilization insights By Service or By Application.
- When you first open the Utilization insights dashboard, by default, the page shows all insights By Service for the selected service, for all projects.
When you are viewing utilization insights By Service, you can configure the dashboard with different service and project selections, one service at a time:
- You can select a different service from the Services drop-down. The options available in the Services drop-down are limited to the services with active utilization insights.
- You can use the Projects drop-down to focus the page on a smaller set of insights and recommendations. The options available in the Projects drop-down are limited to the projects that have resources with active utilization insights.
When you are viewing insights By Application, you can view insights for one App Hub application at a time.
- The selected App Hub application might incur usage and costs in more than one billing account and associated projects. Insights available by application might be based on partial data, limited to projects and costs for the Cloud Billing account you are actively viewing.
- Utilization insights by application only supports applications managed by an app-enabled folder. It doesn't support applications managed by a host project. If you want to view cost data by App Hub application, then ensure that you have set up App Hub for an app-enabled folder and created your applications.
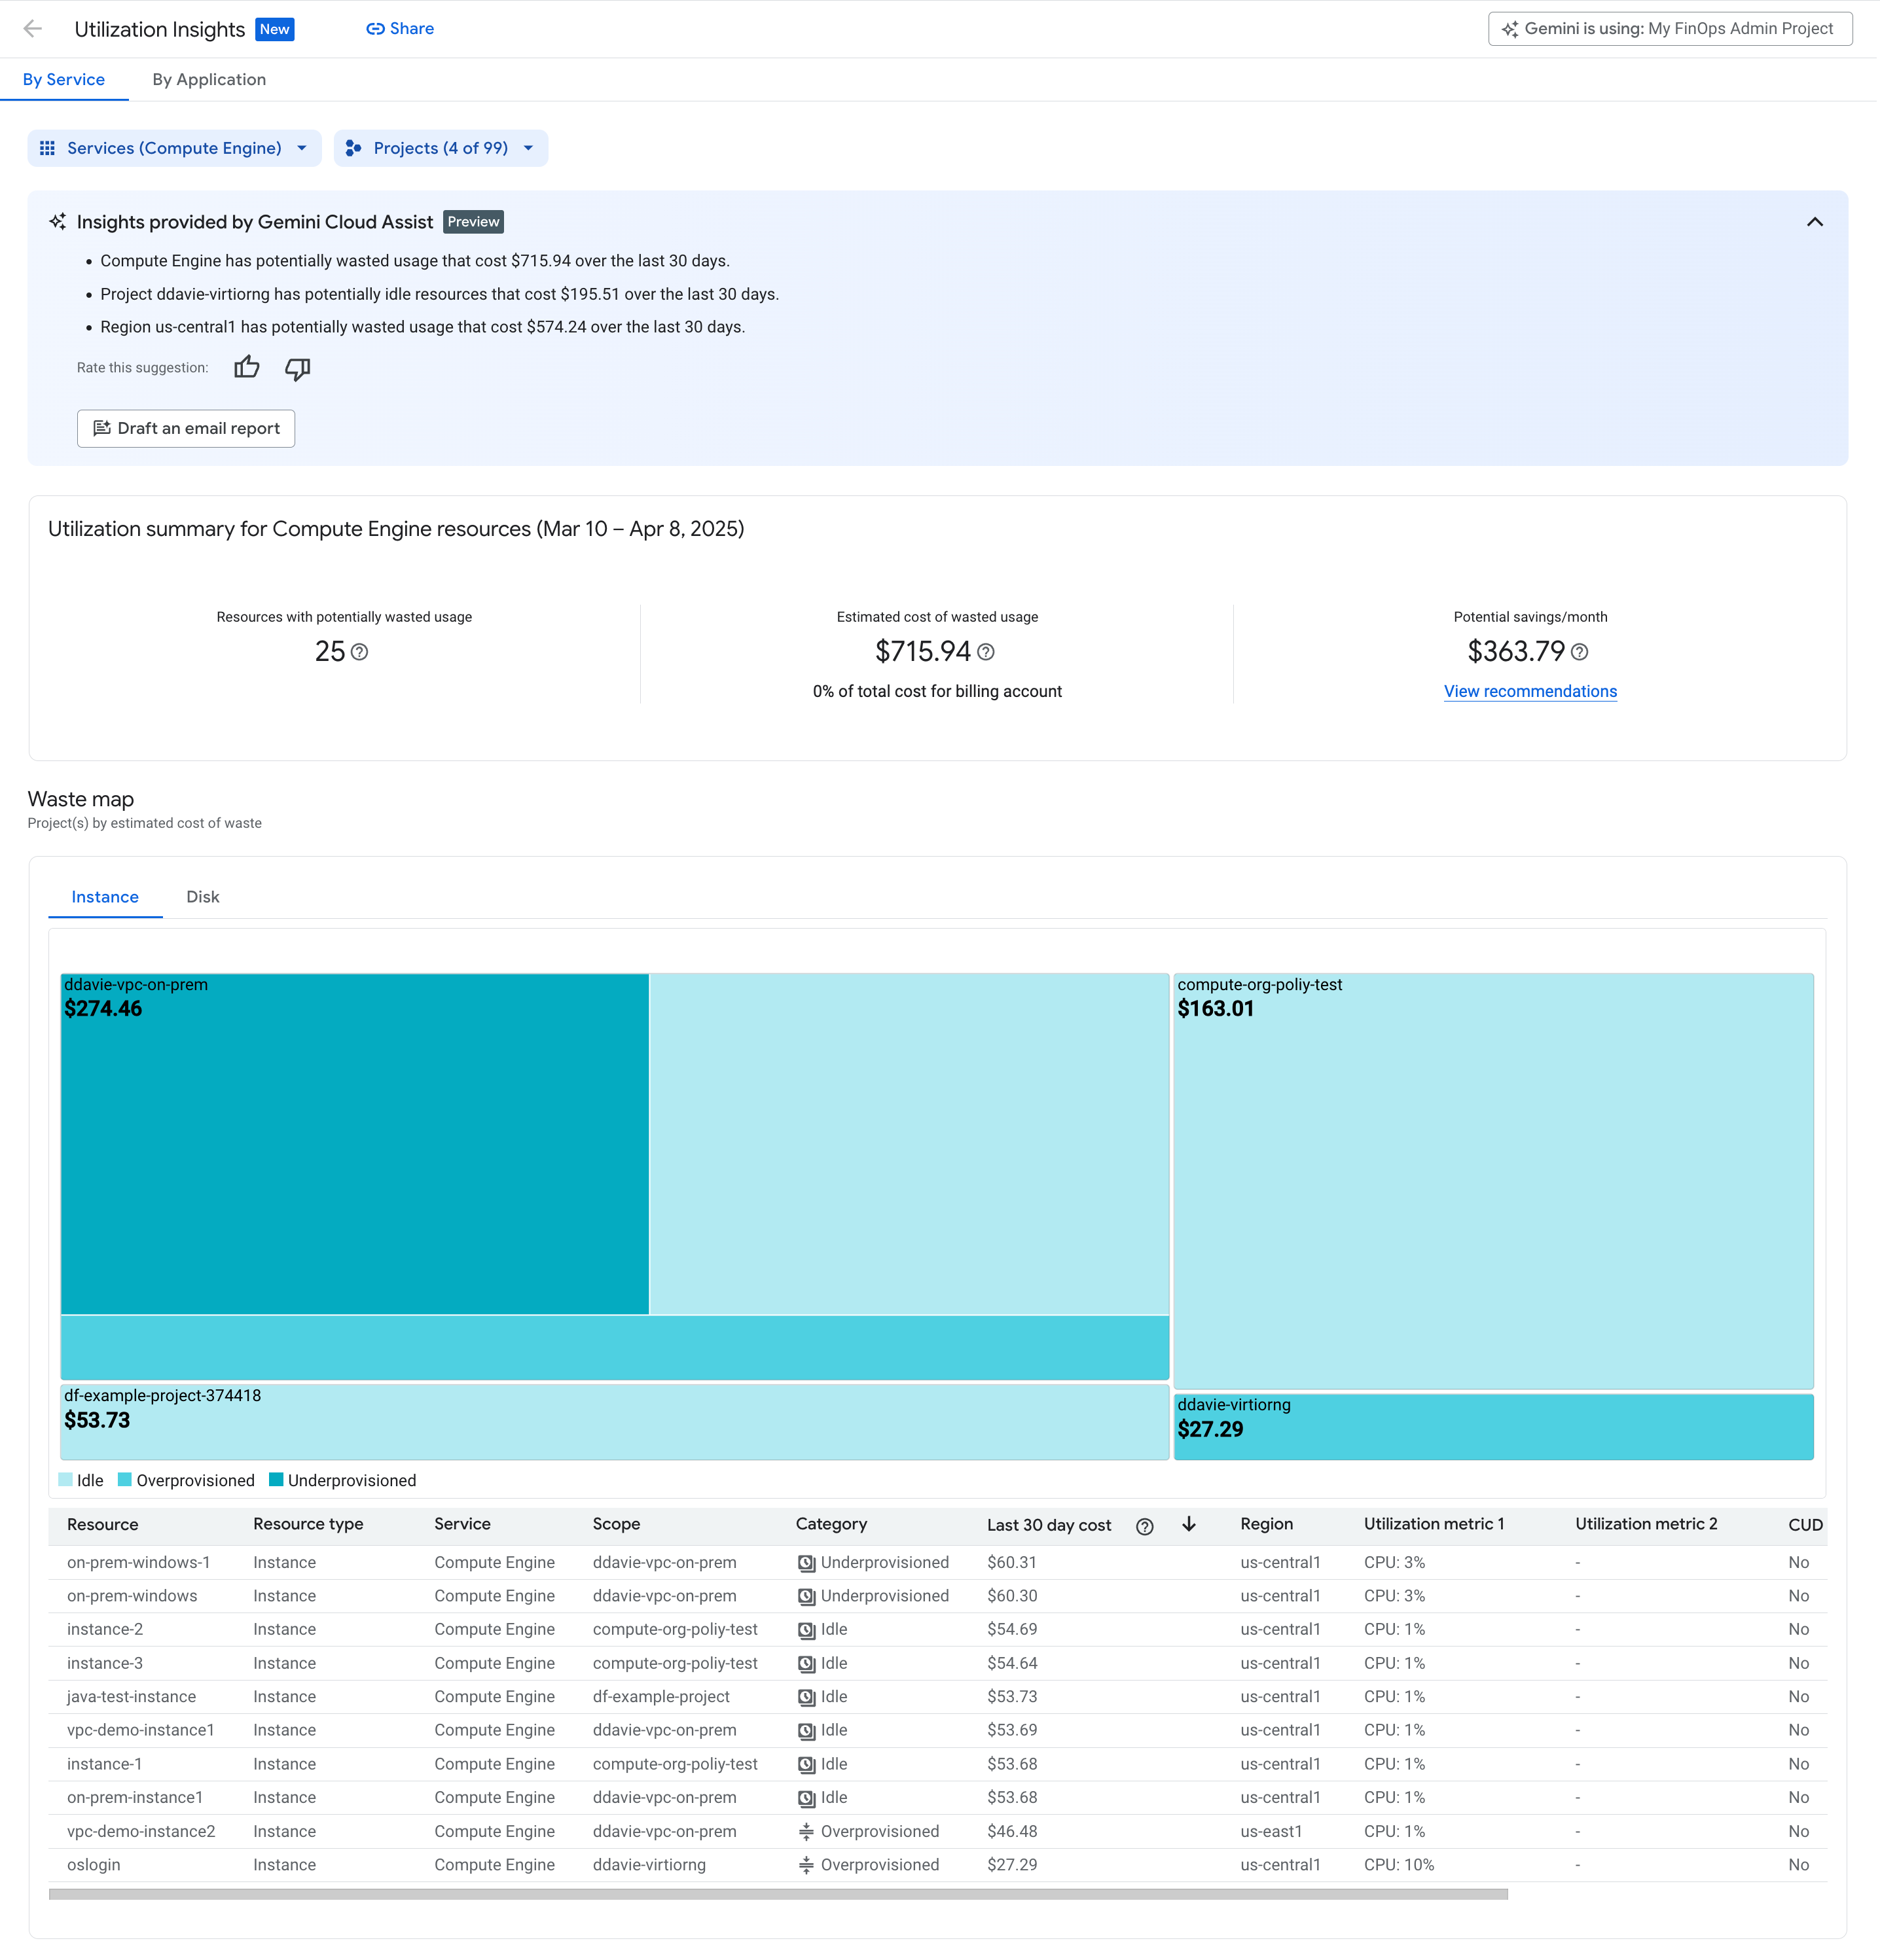
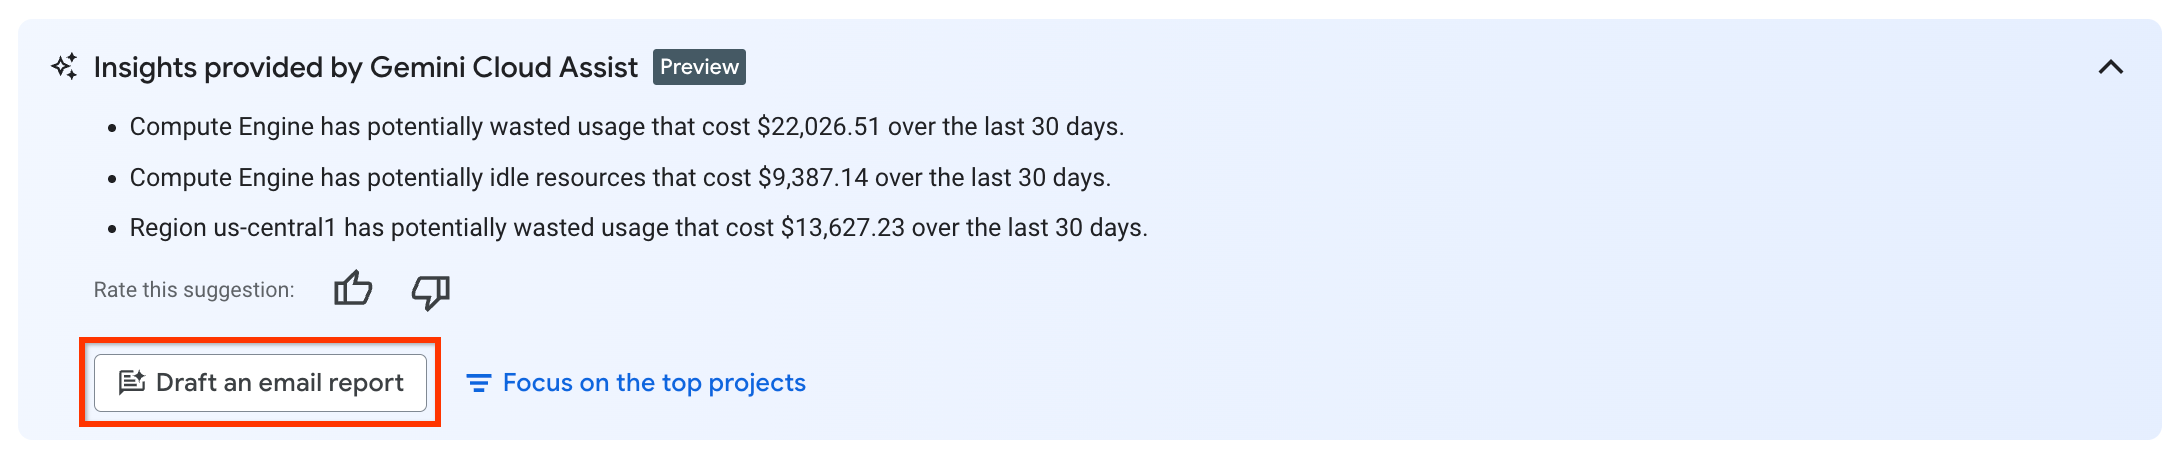
Insights provided by Gemini Cloud Assist

If you enabled Gemini Cloud Assist in Cloud Billing, you can use the Gemini-provided insights to summarize and send top wasted usage insights to your engineering teams to take action and remediate.
If you have more than 10 projects in your billing account with utilization insights, you can select Focus on the top projects to filter the utilization insights by the projects with the highest amount of potential cost savings.
Click Draft an email report to prompt Gemini Cloud Assist to generate a draft of the insights and top recommendations. You can copy the content of the report to send it in an email, chat, a ticketing system, or any other tool you use.
Utilization summary panel
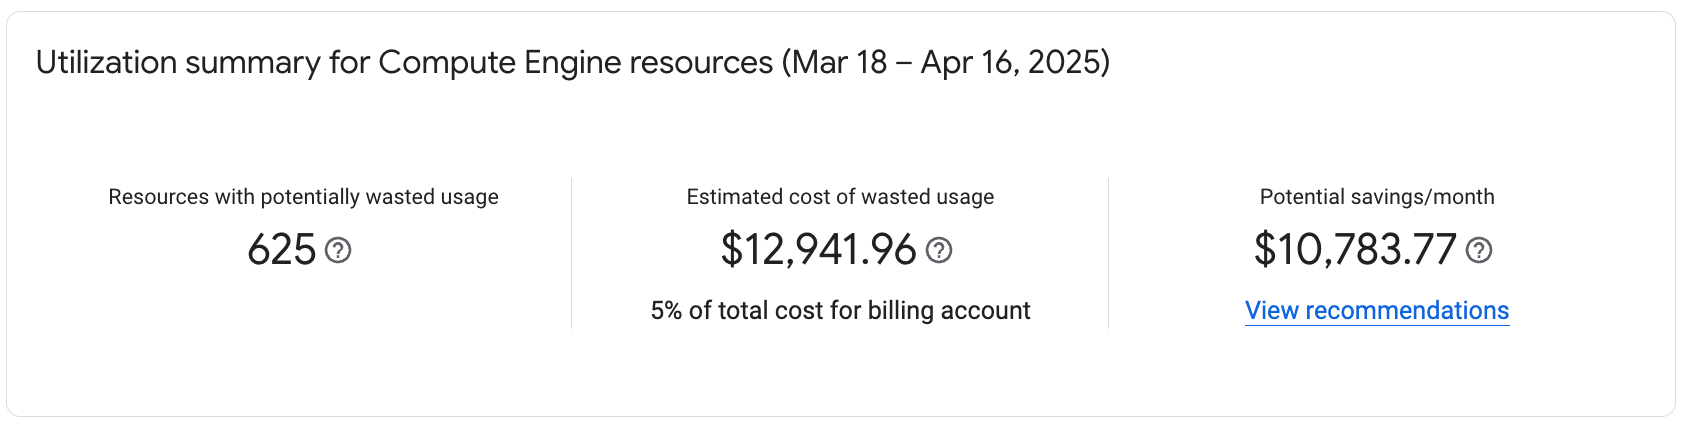
The values in the Utilization summary panel are updated based on the service and projects selected, or based on the selected application.
- Resources with potentially wasted usage: The total number of resources for the selected service and project(s) that have available utilization metrics.
- Estimated cost of wasted usage: For resources with utilization metrics, this is the estimated cost of those resources over the last 30 days for the selected service and project(s).
Potential savings/month: Savings that might be achieved through applying recommendations. Savings don't include existing discounts available through active Committed Use Discounts (CUDs).
Click View recommendations to open the Recommendations dashboard to view all recommendations for the selected service and projects.
Waste map
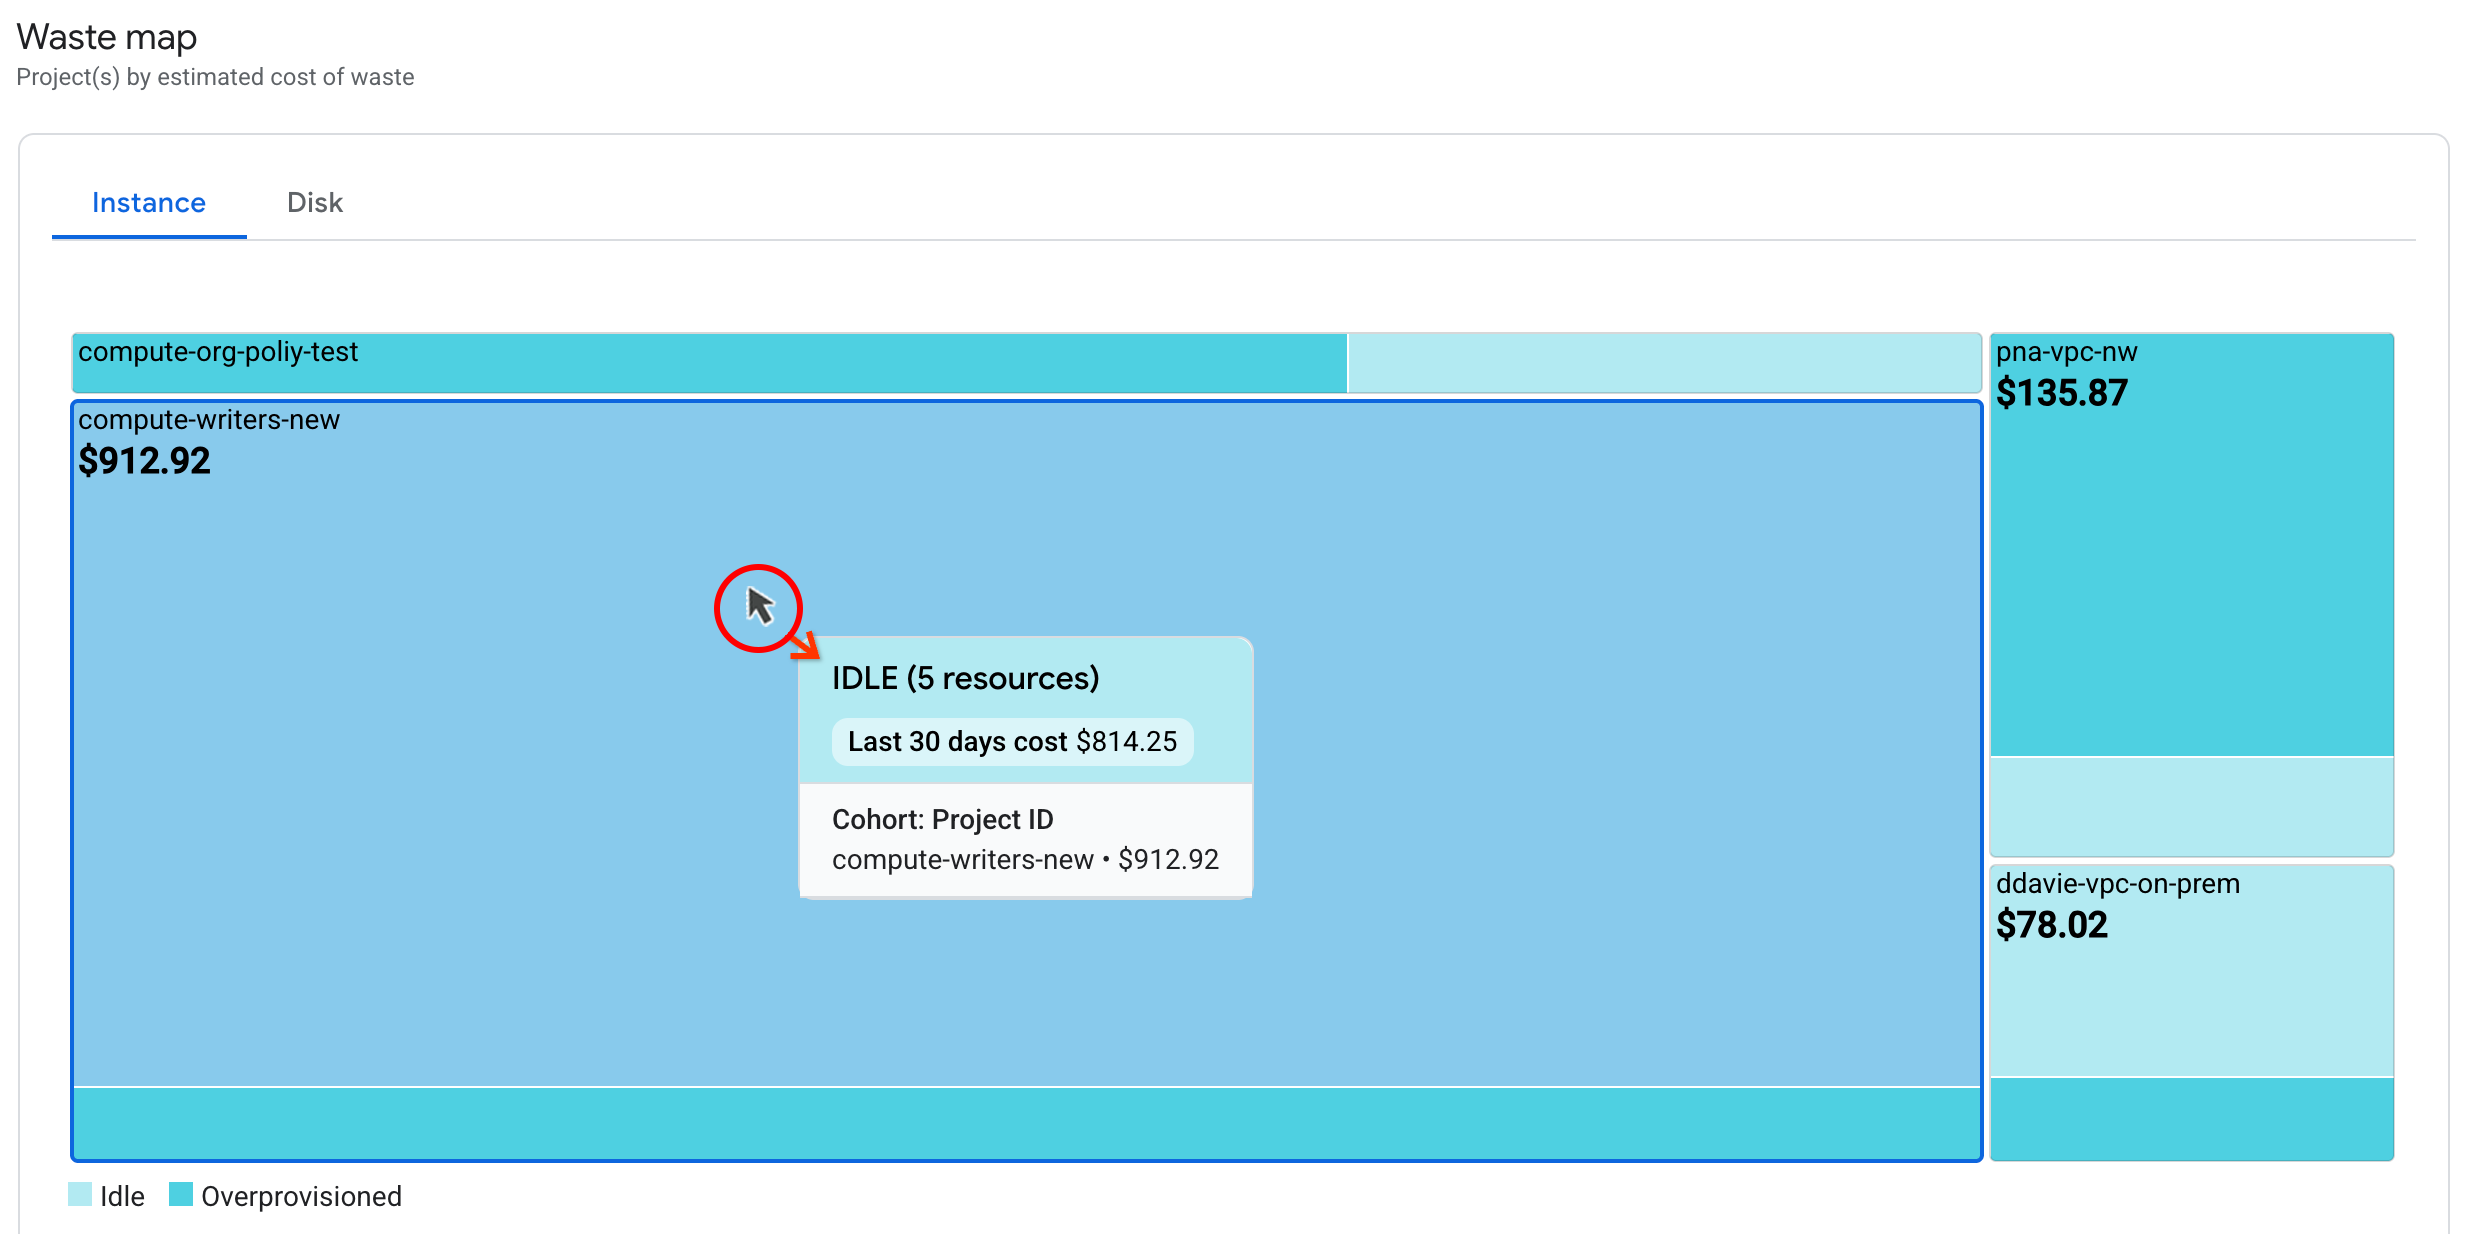
The Waste map provides a visual representation of the top costs by estimated cost of waste. The map can help you to quickly identify the most important utilization areas to tackle first.
- If you are viewing utilization insights for all projects, the estimated cost of waste is aggregated across all projects in the service, broken down by the optimization categories for the service you are viewing (such as Idle, Overprovisioned, Underprovisioned, and Suboptimal configuration).
- If you are viewing the utilization insights for 1 to 10 projects, the map provides a visual representation of the costs in each project broken down by the optimization categories for the service you are viewing.
- The size of each box corresponds to the cost of resources; larger boxes indicate a higher estimated cost of waste.
- When you hold the pointer over any of the boxes in the waste map, you'll see a tooltip for the box, with additional details about the values in the box (such as the optimization category, the estimated cost of the optimization category, the number of resources with potentially wasted usage, and the project ID).
Resource recommendations table
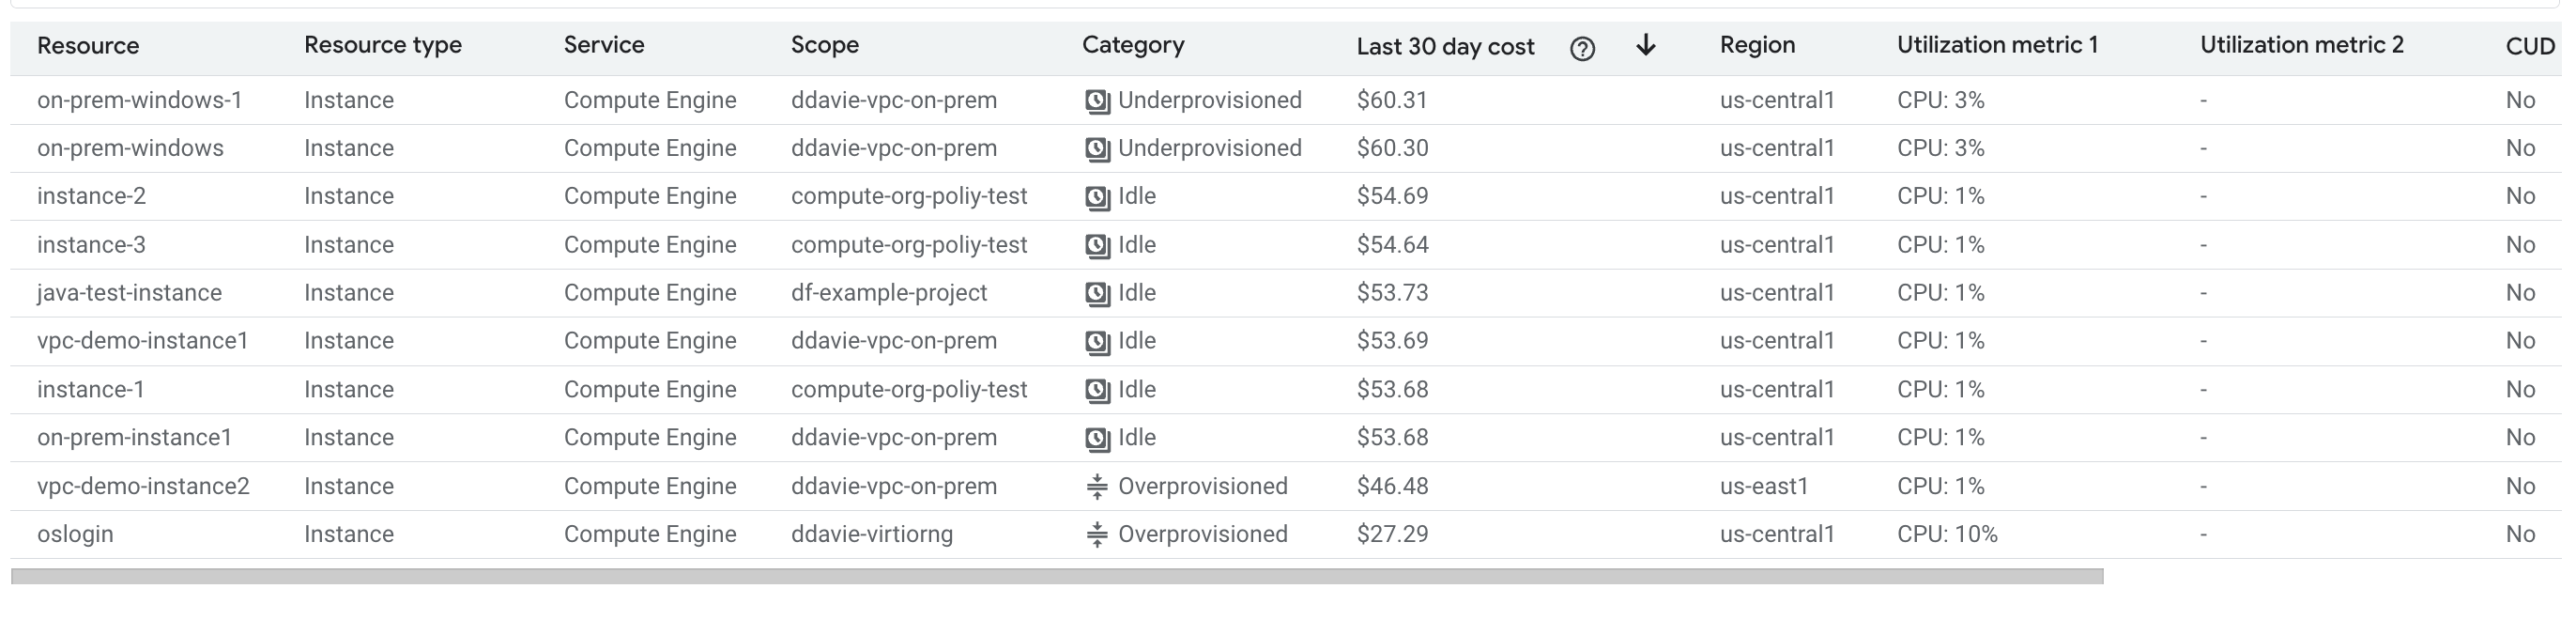
The resource recommendations table lists up to 1000 resources that are identified with potentially wasted usage. The table includes the costliest resources for the selected service, based on costs for the last 30 days, and an optimization recommendation for each resource.
Supported services and optimization categories
The Utilization insights dashboard provides recommendations about potentially wasted usage for the following services and optimization categories:
| Service | Optimization categories |
|---|---|
| Compute Engine |
|
| Google Kubernetes Engine (GKE) |
|
| Cloud SQL |
|
| Cloud Run |
|
| App Hub applications |
|
Columns in the resource recommendations table
The following data is available in the resource recommendations table.
By default, the rows in the table are sorted by Last 30 day cost, in descending order – highest cost to lowest cost. You can change the sort order of the data by clicking on a different column header.
| Column | Description | Examples |
|---|---|---|
| Resource | The name of the specific resource that has potentially wasted usage. | my-n1-instance, test-cluster |
| Resource type | The type of resource that has potentially wasted usage. | Instance, Disk, Cluster |
| Service | The Google Cloud service for the specific resource | Compute Engine, Google Kubernetes Engine, Cloud SQL, Cloud Run |
| Scope | The Google Cloud project ID where the resource is contained. | my-project-id |
| Category | The optimization category for the specific resource and resource type. | Idle, Overprovisioned, Underprovisioned, Suboptimal configuration |
| Last 30 day cost | For each resource identified with potentially wasted usage, this column shows the net cost of each resource over the last 30 days, not including today. The cost is calculated using either the list price or custom contract price (if applicable), and includes any credits applied to the resource, such as committed use discounts (CUDs) and other credits. | $514.11, $98.00 |
| Region | The region where the resource is located. | us-central1, europe-west4, asia-east2 |
| Utilization metric 1 | For the specific resource, the primary metric that is analyzed to determine utilization insights. Metrics are calculated at the 95th percentile (P95) for the last 30 days. In some cases, metrics values won't be present. For example, Cloud Run doesn't provide metrics as it is a managed service. | CPU: 35%, Memory: 100%, No running pods |
| Utilization metric 2 | For the specific resource, the secondary metric that is analyzed to determine utilization insights. Metrics are calculated at the 95th percentile (P95) for the last 30 days. In some cases, metrics values won't be present. | Memory: 20%, CPU 11.72% |
| CUD benefit | 'Yes' indicates that the resource has an active, purchased Committed Use Discount (CUD) and that a portion of the cost was covered with a CUD. 'No' indicates that the resource isn't covered by an active CUD. | Yes or No |
| Recommendations | Specific actions you can take to optimize your cost. If you have the necessary permissions, you can view the recommendation details. If you have the Recommender Viewer role on your Cloud Billing account, you can select a recommendation to get further details and to apply the recommendation. Depending on the type of recommendation, you might also need project permissions to view the details and apply a recommendation. | View recommendation |
Summarize and send with Gemini Cloud Assist
On the FinOps Utilization insights dashboard, you can discover if resources are used efficiently and view high-impact utilization insights based on the potential costs of wasted resources.
Gemini Cloud Assist provides the top utilization insights.
Draft an email with Gemini-generated insights
To help with financial accountability collaboration and data-driven decision making requirements, Gemini Cloud Assist offers a tool to draft an email report based on the results of the utilization insights and optimization recommendations. You can send the report in email, chat, or a ticketing system.
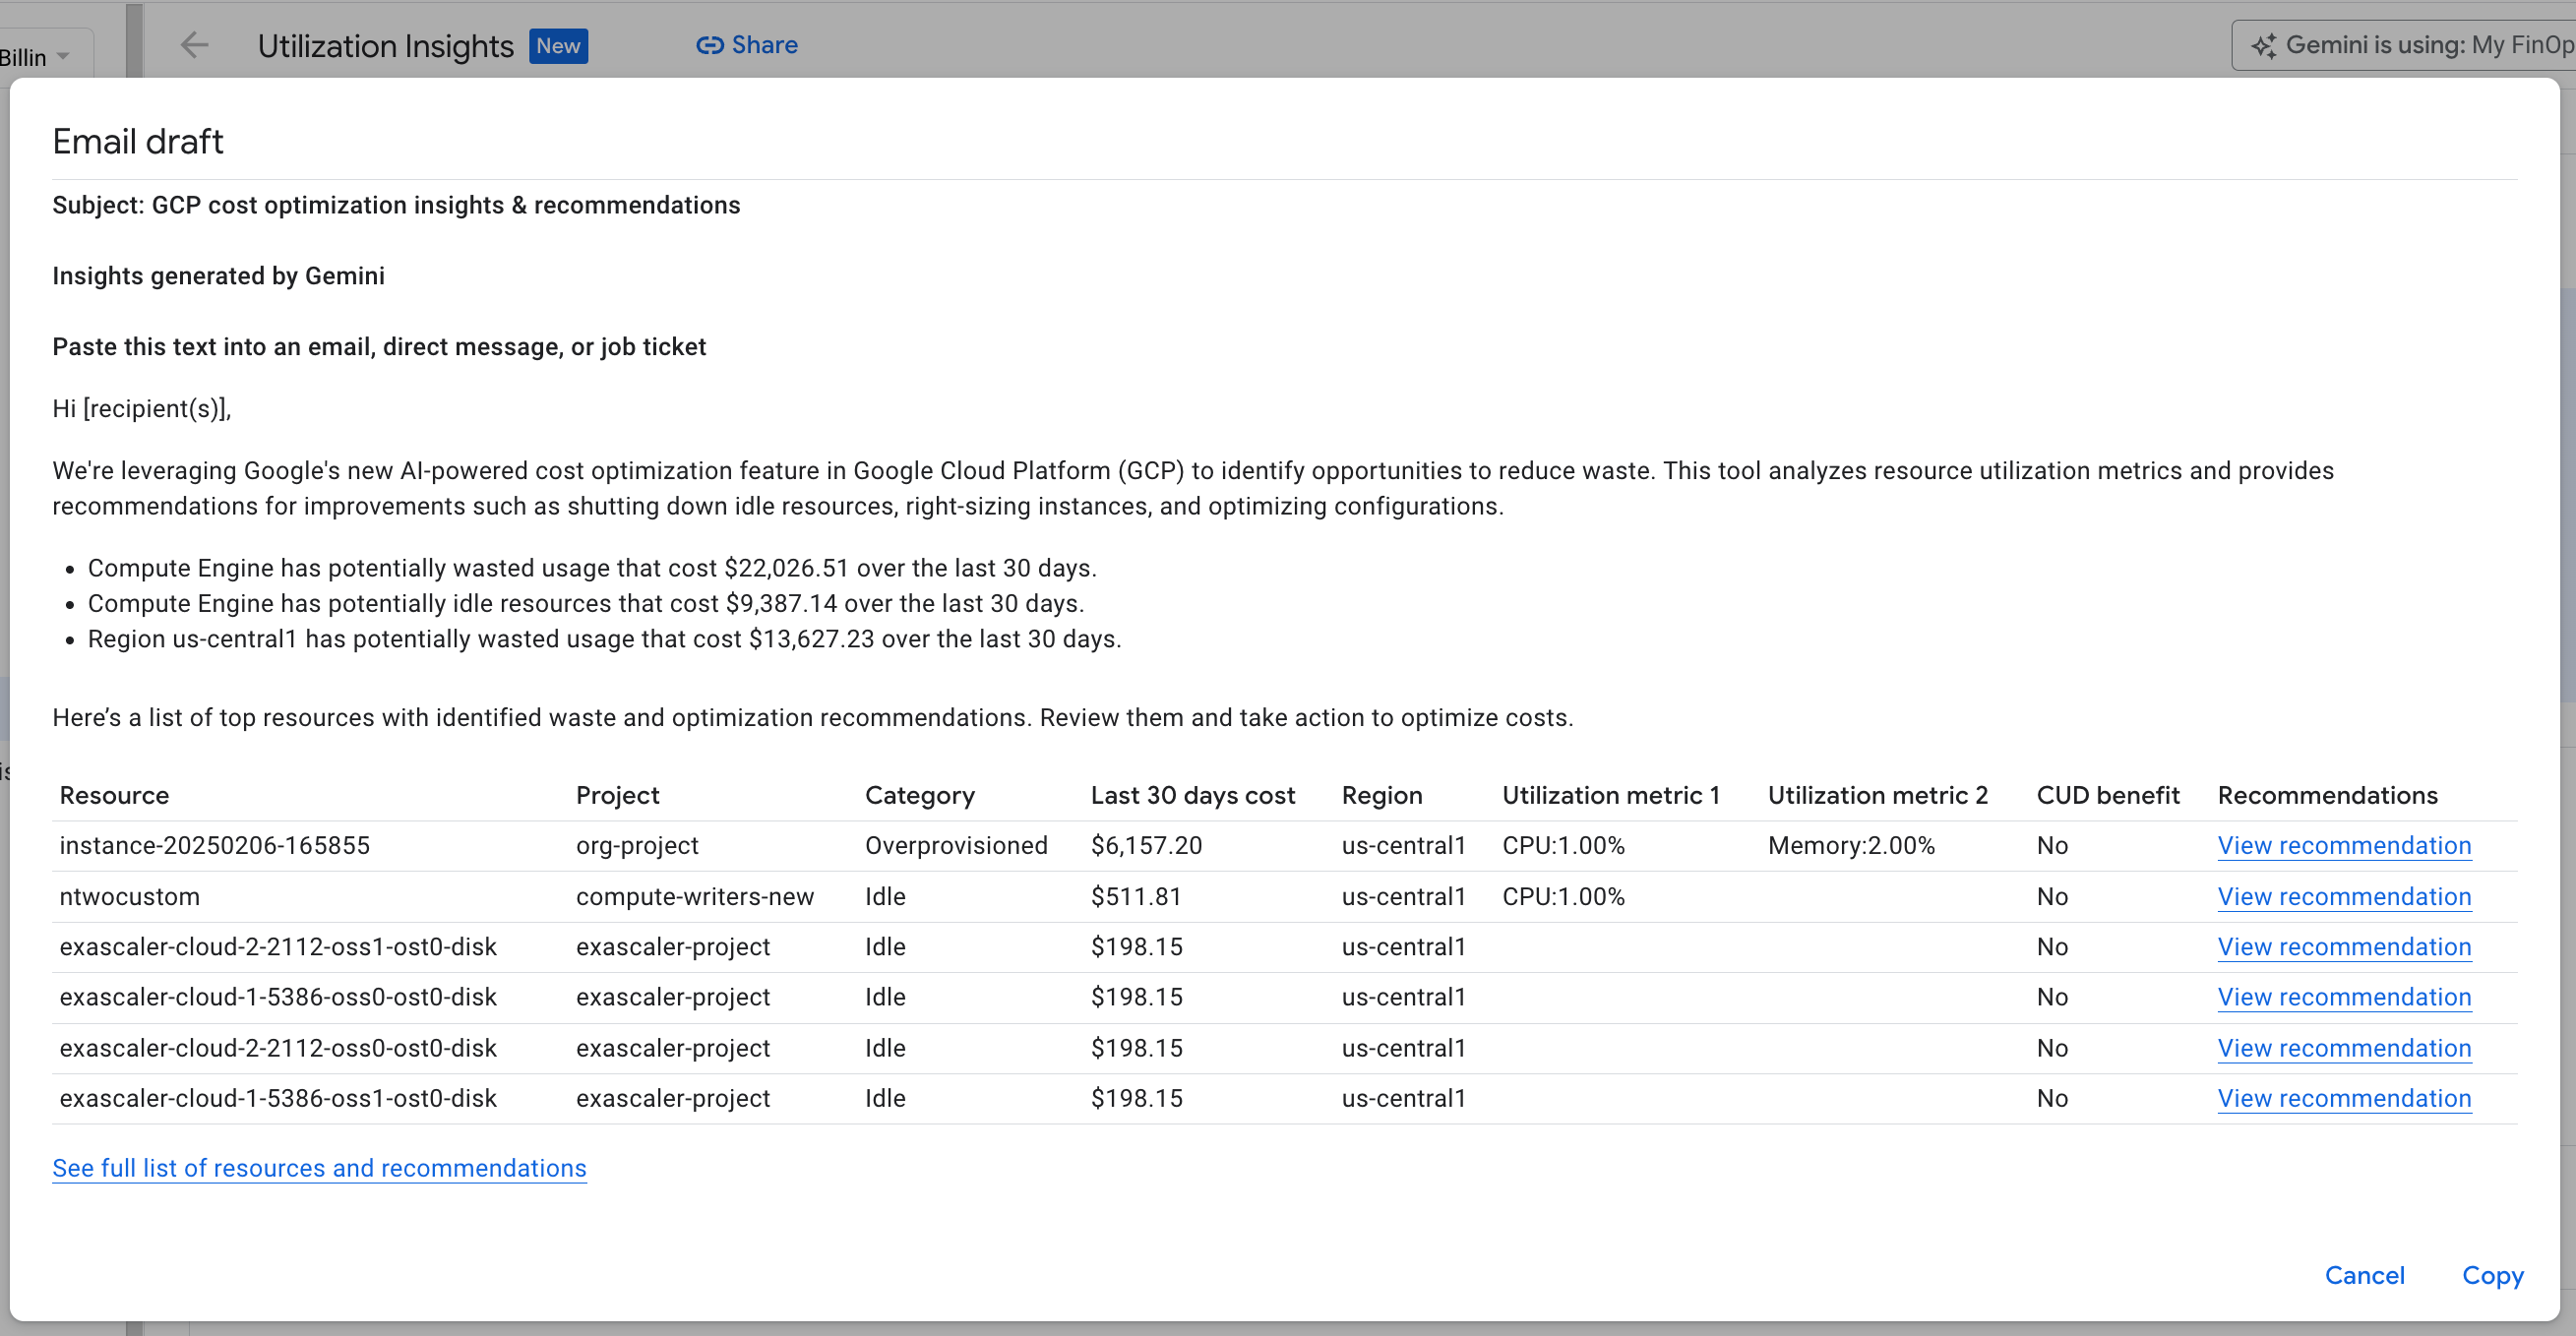
In the draft, click Copy to copy the text and the recommendation links to your clipboard. You can then paste the text and links into an email, chat, direct message, a ticketing system, or any other tool you use.
Resources
- FinOps hub
- Google Cloud Well-Architected Framework: Cost optimization
- Optimize costs with committed use discounts
- Purchasing spend-based committed use discounts
- Purchasing resource-based committed use discounts