Get at-a-glance and user-configurable views of your cost history, current cost trends, and forecasted costs with intuitive reports available in the Google Cloud console. Several different reports are available for your billing data analysis needs.
Interactive learning: Billing reports tour
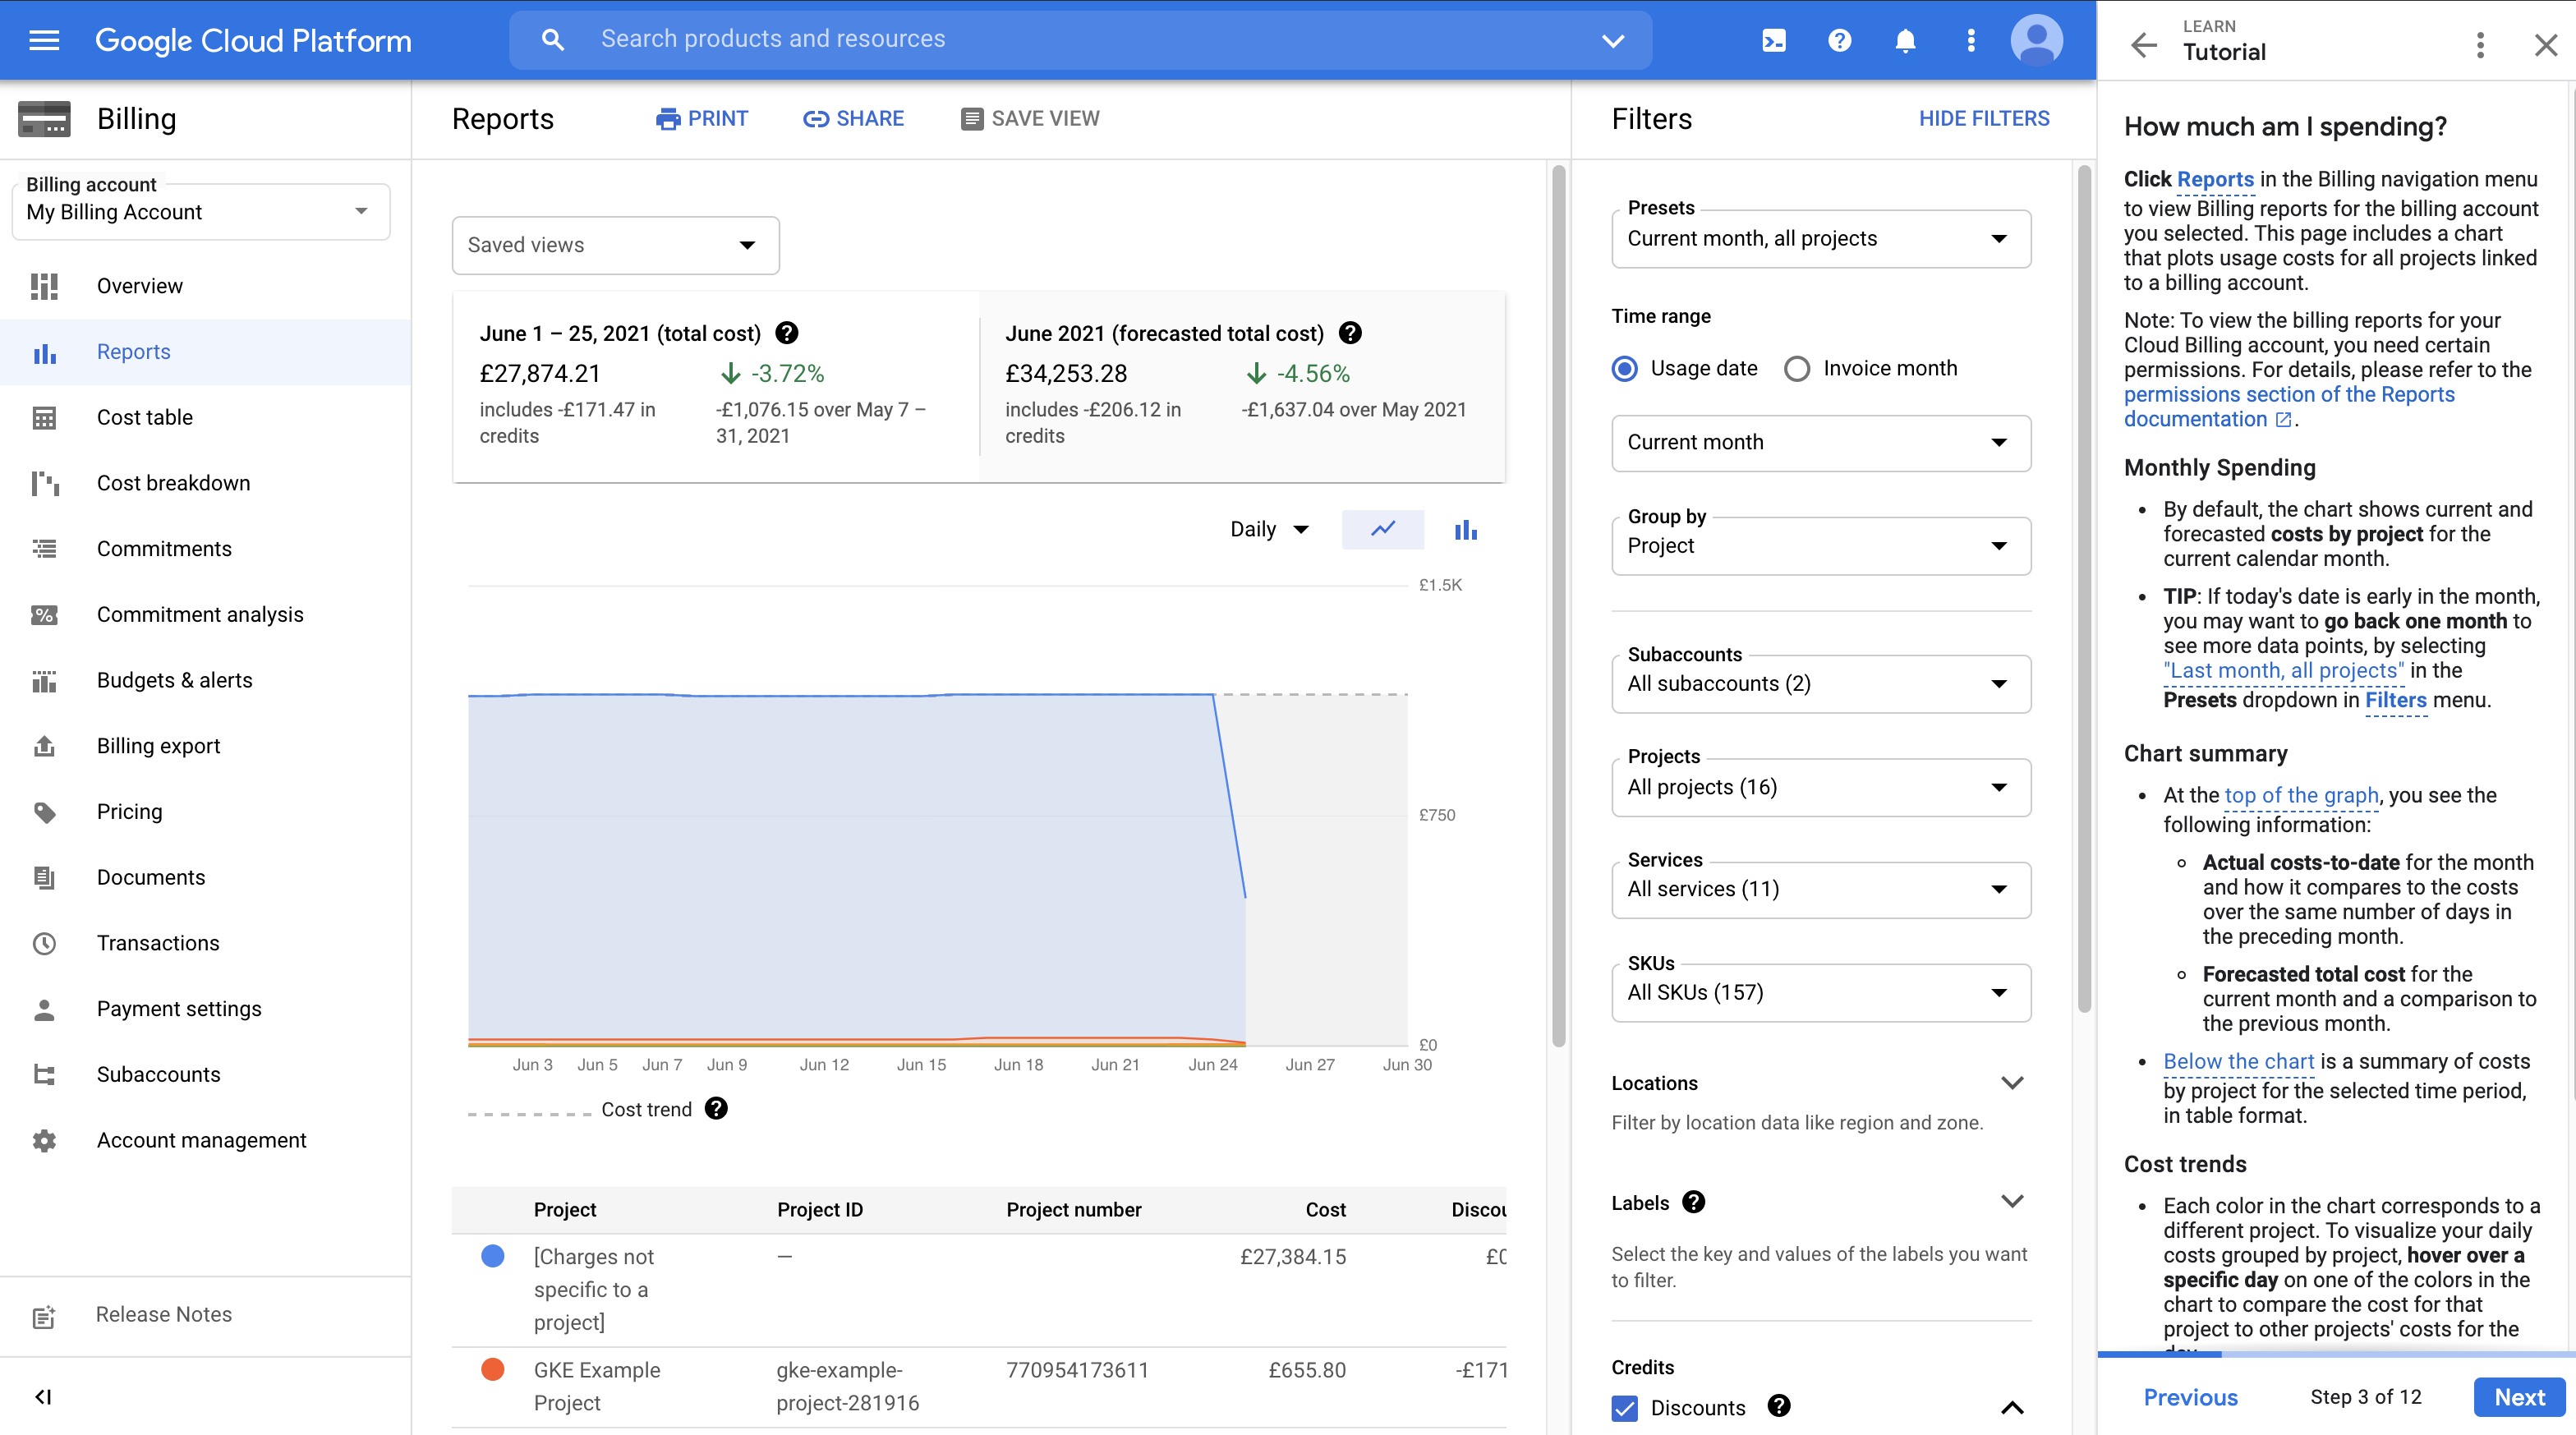
Learn how to answer cost management questions using intuitive reports available in the Google Cloud console. In this 30-minute tutorial, you'll familiarize yourself with some of the built-in reports and learn how to customize them to answer questions such as:
- How much am I spending?
- What are my cost trends?
- What are my cost drivers?
- What is the breakdown of my spend by product?
Launch the billing reports tour
Analyze your usage costs: Billing report
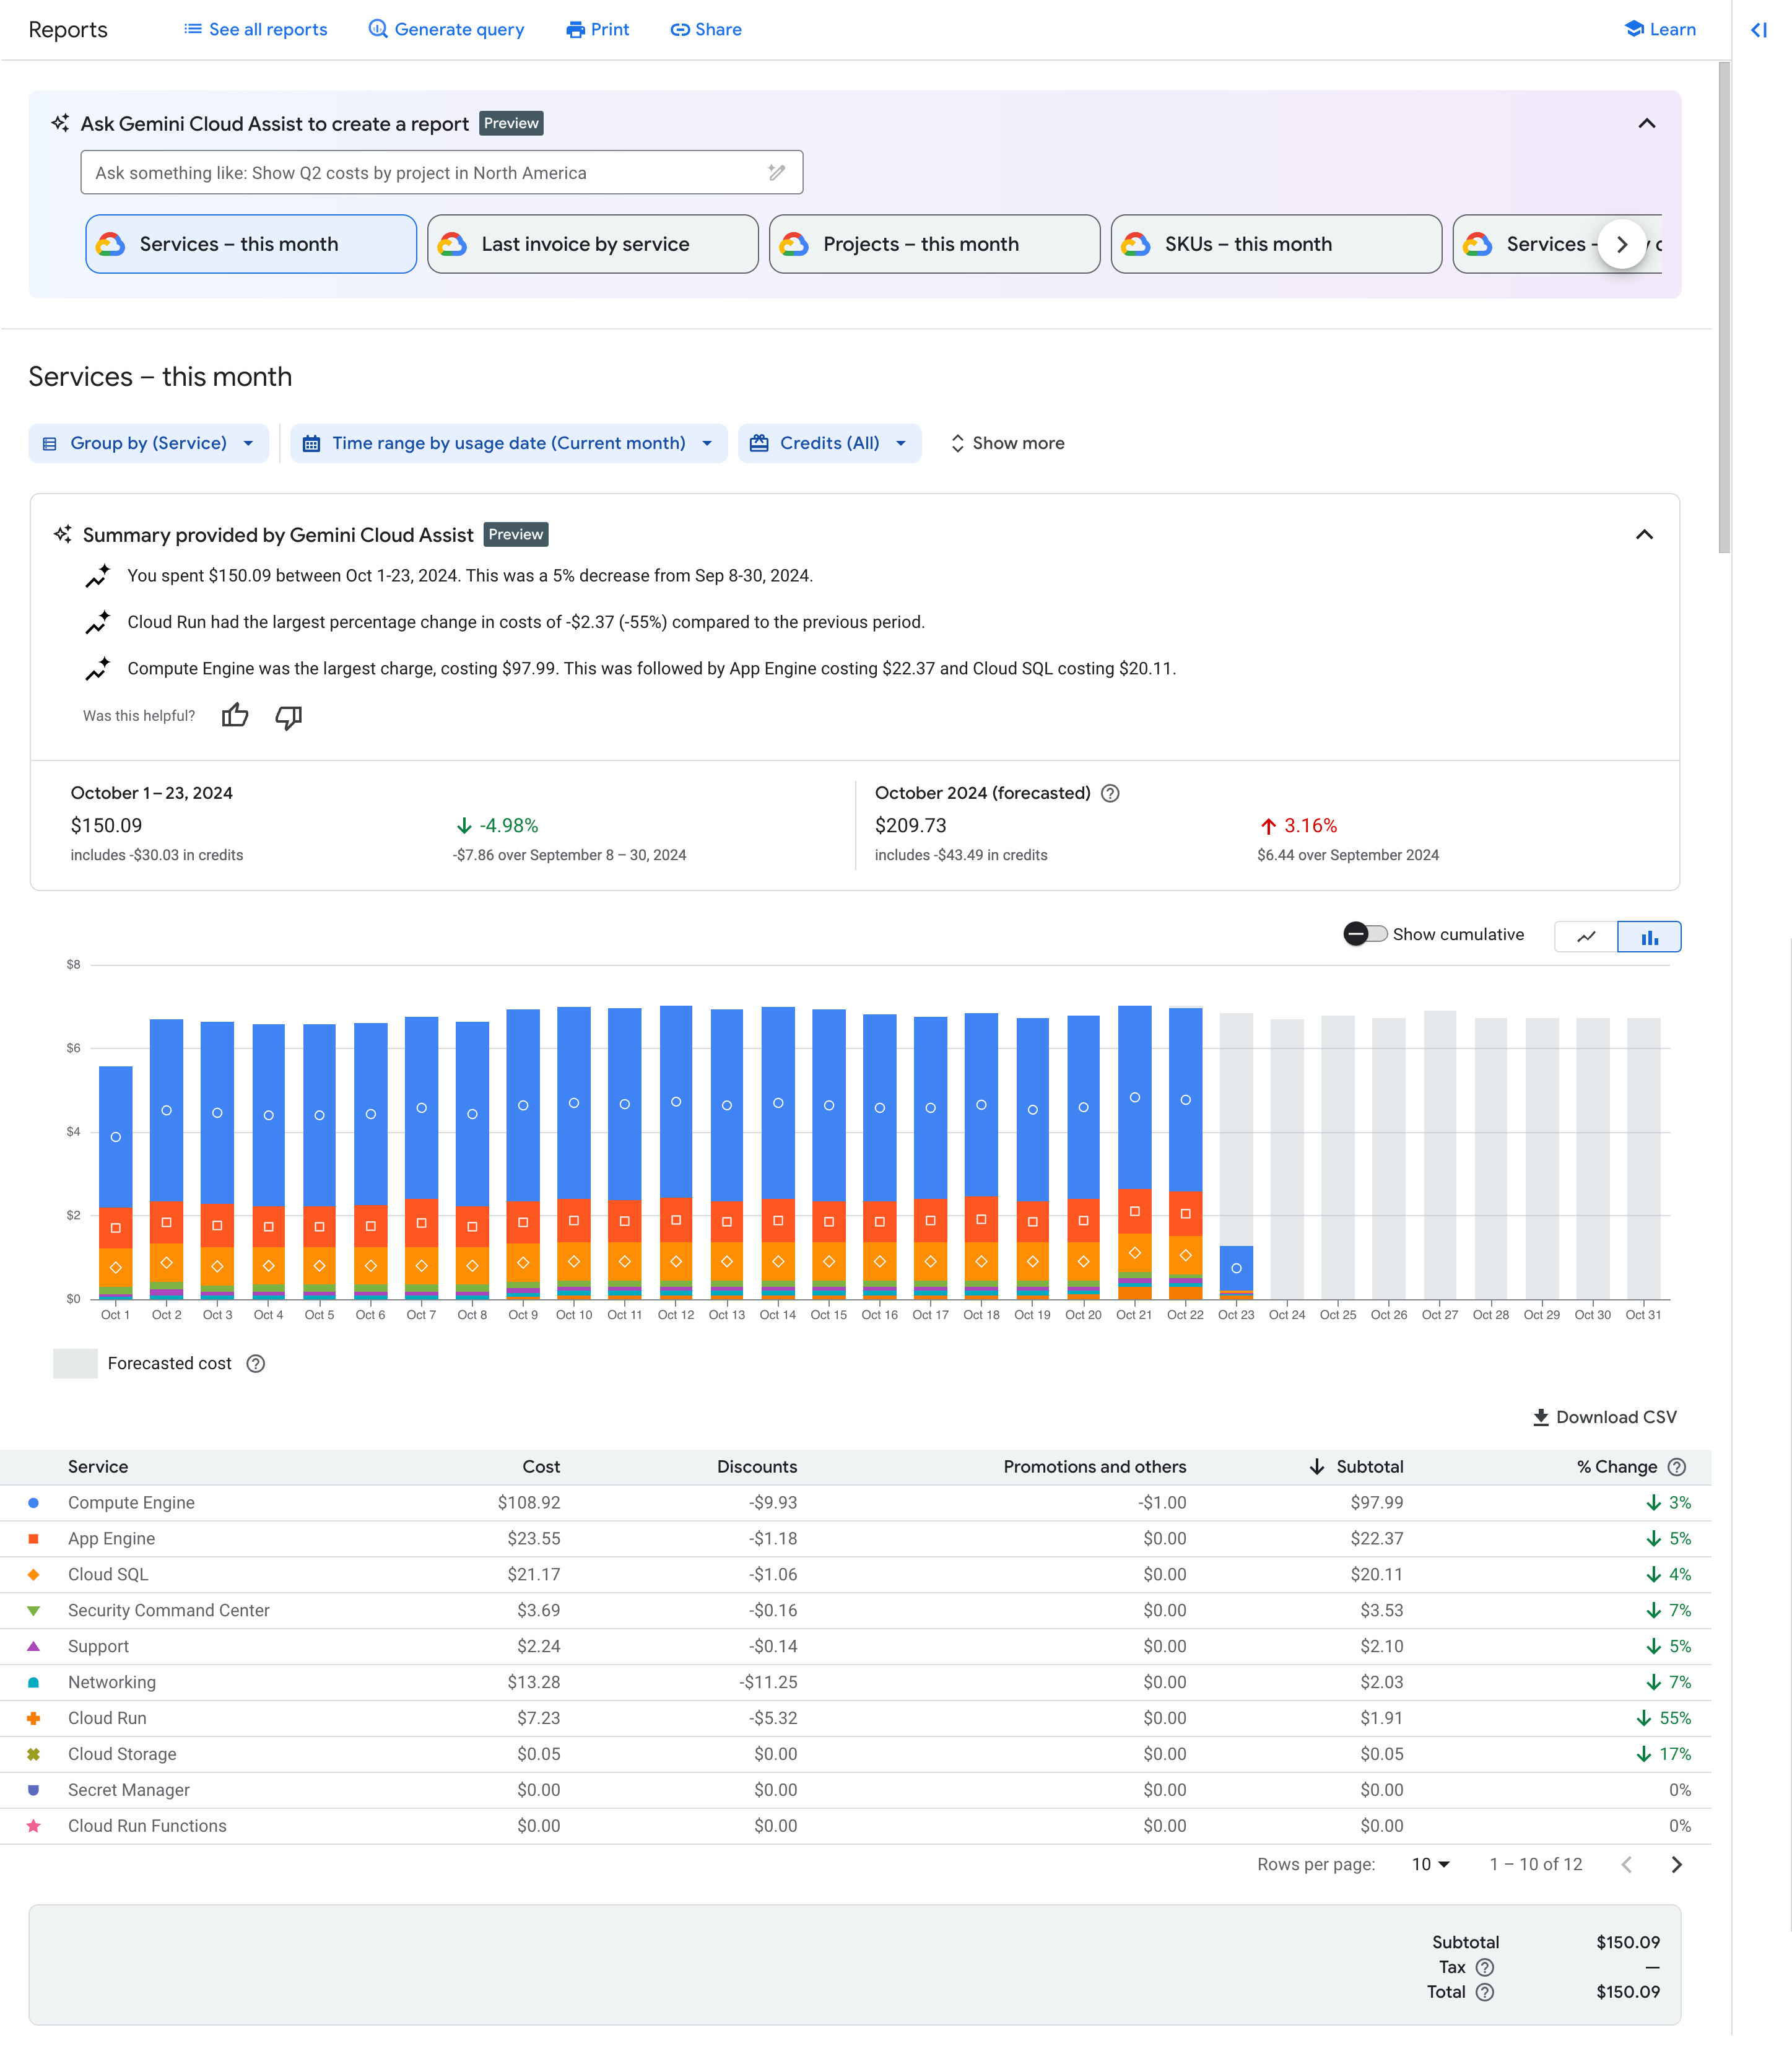
Use the billing report to view and analyze your Google Cloud usage costs using many selectable settings and filters.
Configuring various views of the Cloud Billing report can help you answer questions like these:
- How is my current month's Google Cloud spending trending?
- Which Google Cloud project cost the most last month?
- Which Google Cloud service (for example, Compute Engine or Cloud Storage) cost me the most?
- What are my forecasted future costs based on historical trends?
- How much am I spending by region?
- What was the cost of resources with label X?
You can save and share your customized report views.
Read more about billing report
Analyze your invoices: Cost table report
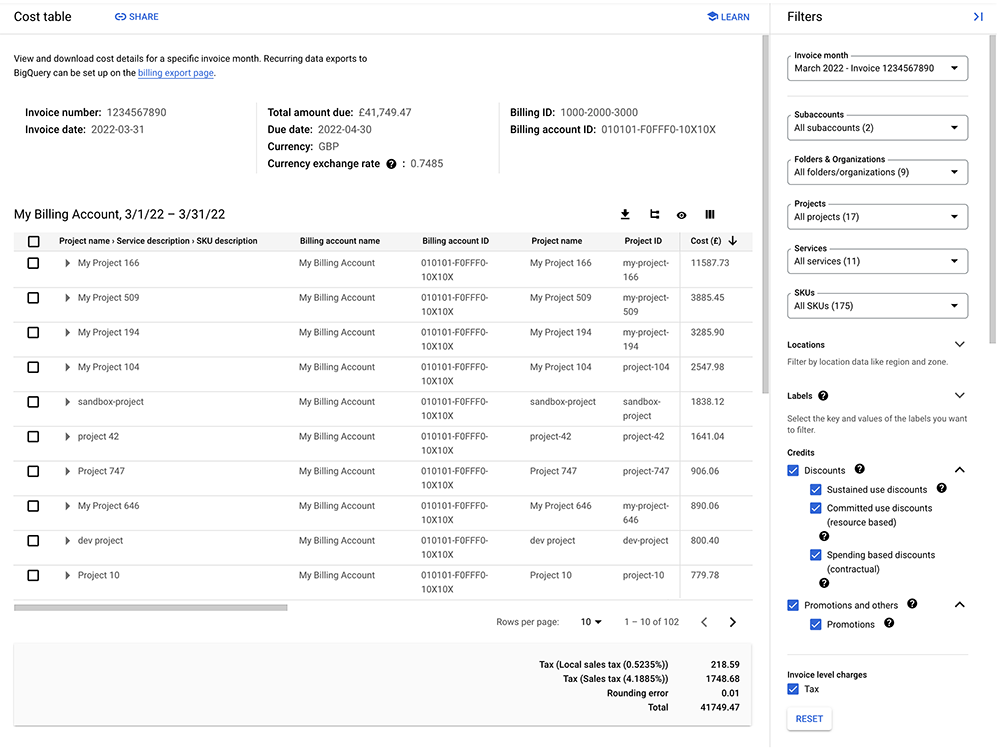
Use the cost table report to access and analyze the details of your invoices and statements.
Because your generated invoice and statement PDFs only contain simplified, summarized views of your costs, the cost table report is available to provide invoice or statement cost details, such as the following:
- Includes project-level cost details from your invoices and statements, including your tax costs broken out by project.
- Includes additional details you might need, such as service IDs, SKU IDs, and project numbers.
- The report view is customizable and downloadable to CSV.
Read more about cost table report
View savings at a glance: Cost breakdown report
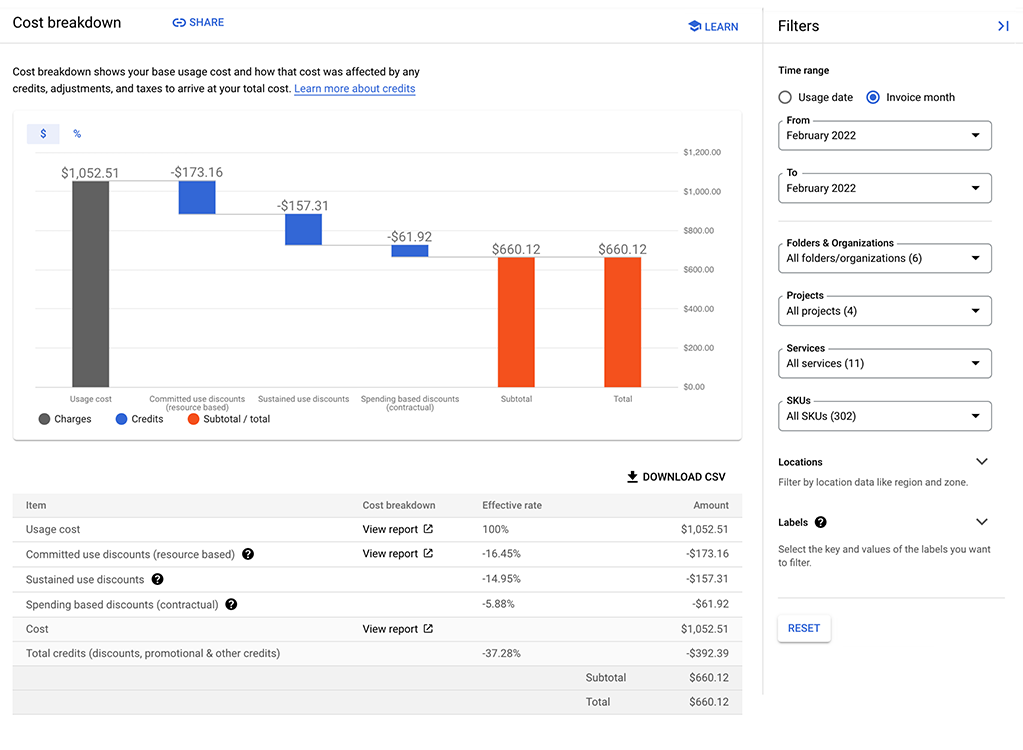
Use the cost breakdown report for an at-a-glance waterfall overview of your monthly costs and savings.
This report shows the following summarized view of monthly charges and credits:
- The combined costs of your monthly Google Cloud usage at the on-demand rate, calculated using non-discounted list prices.
- Savings realized on your invoice due to custom contract pricing (if applicable to your Cloud Billing account).
- Savings earned on your invoice with usage-based credits, broken down by credit type (for example, committed use discounts, sustained use discounts, free tier usage).
- Your invoice-level charges such as tax and adjustments (if any) applied for that invoice month.
Read more about cost breakdown report
View your prices per SKU: Pricing report
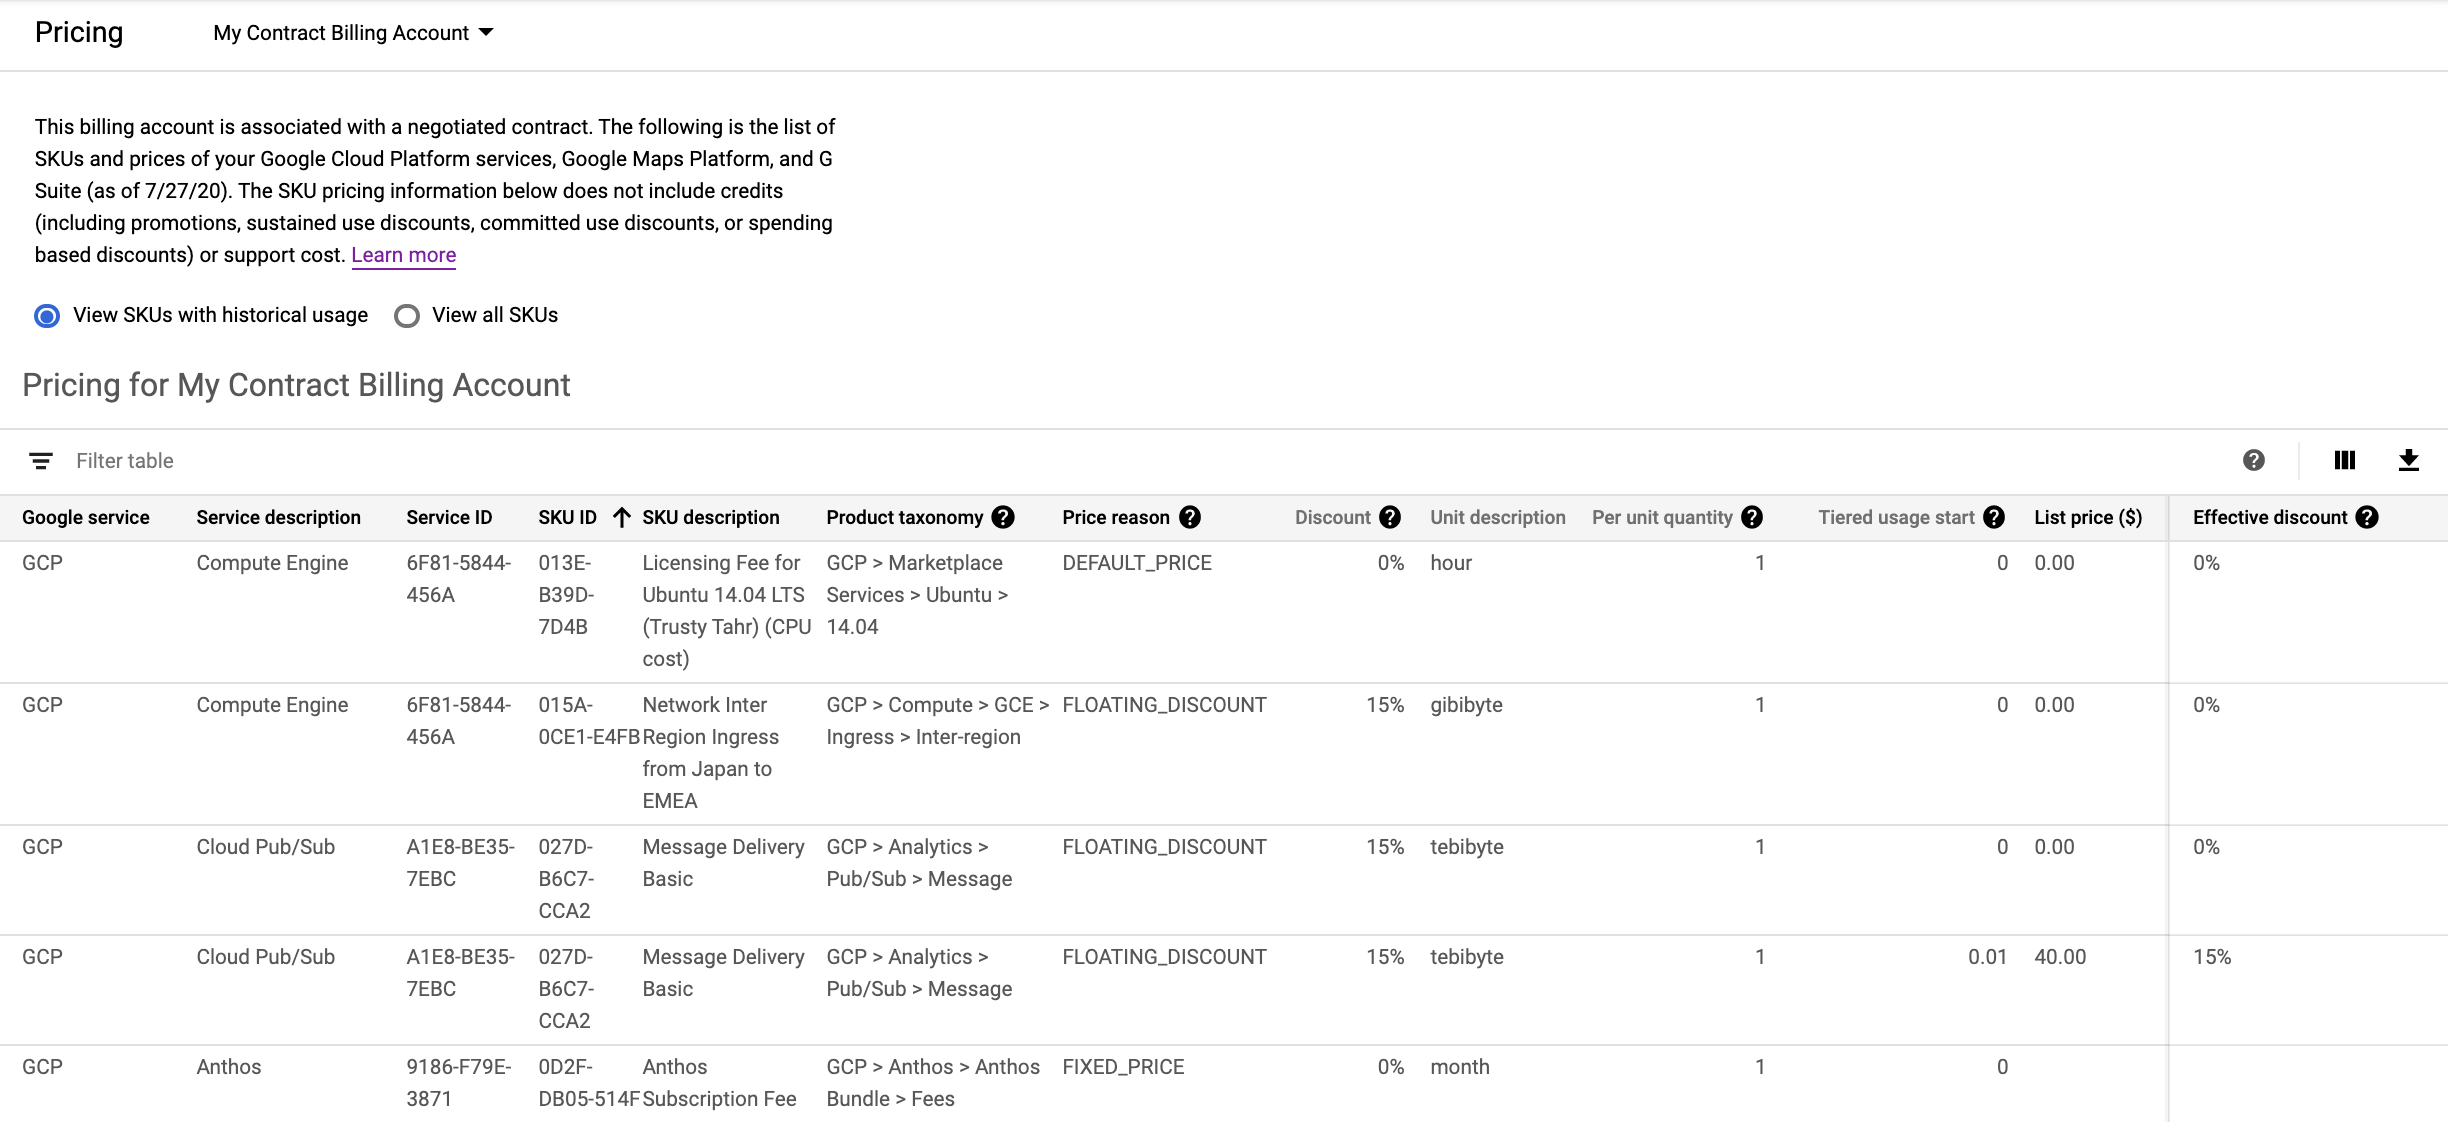
Use the pricing table report to access SKU prices for Google's cloud services, including Google Cloud, Google Maps Platform, and Google Workspace, as of the date the report is viewed.
This report shows the following pricing information:
- Displays SKU prices specific to the selected Cloud Billing account.
- If your Cloud Billing account has custom contract pricing, each SKU displays the list price, your contract price, and your effective discount.
- If a SKU is subject to tiered pricing, each pricing tier for a SKU is listed as a separate row.
- All the prices are shown in the currency of the selected billing account.
- The report view is customizable and downloadable to CSV for offline analysis.
Read more about pricing table report
Analyze your committed use discounts: CUD analysis reports

Use the CUD analysis reports to visualize and understand the effectiveness and financial impact of the Committed use discounts (CUDs) you purchased.
The CUD analysis reports help answer questions such as the following:
- How much are my committed use discounts saving me on my bill?
- Am I fully utilizing my existing commitments?
- How much of my eligible usage is covered by commitments?
- Is there an opportunity to save more by increasing my commitments?
- Can I improve my commitment utilization by enabling discount sharing?
Read more about CUD analysis reports
Analyze your exported billing data: Build your own reports
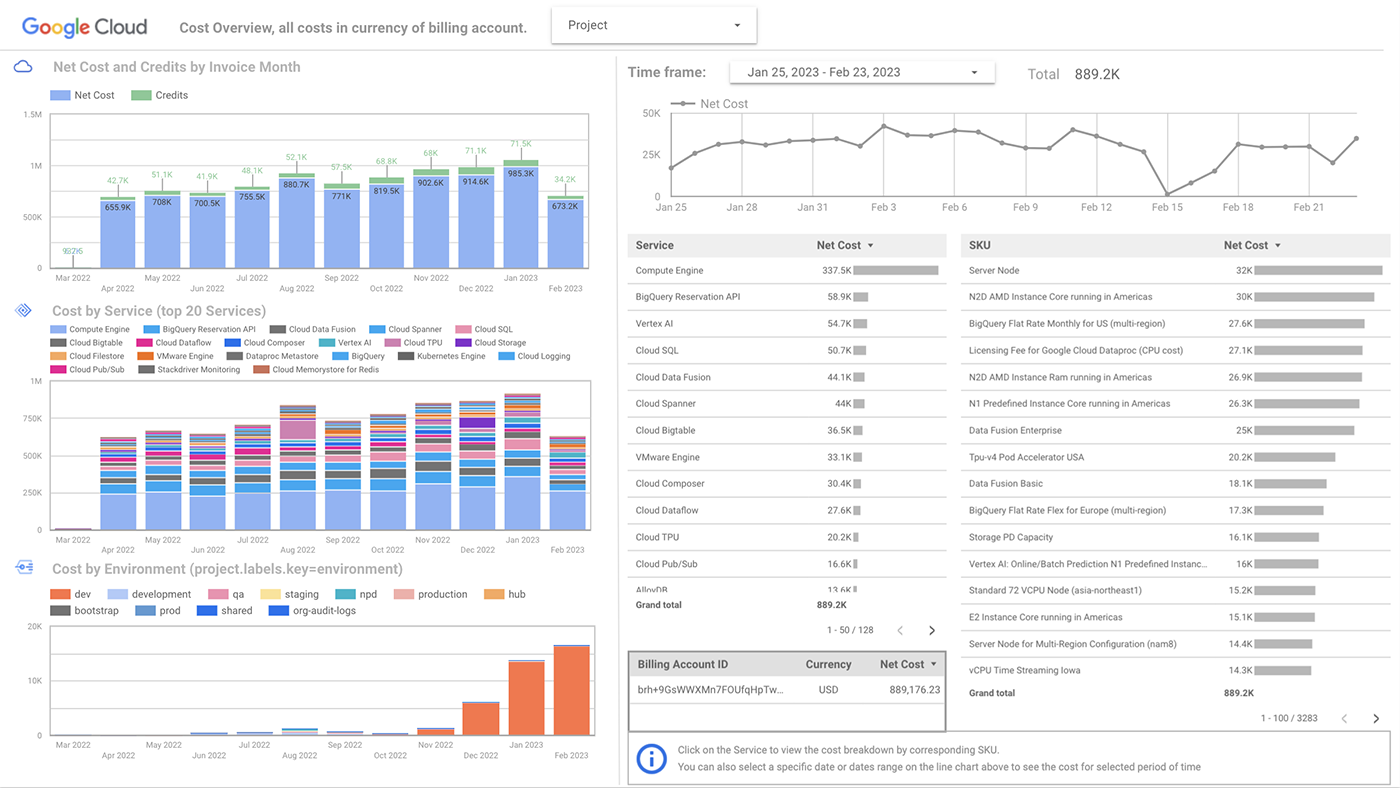
You can create your own custom billing reports based on your exported billing data.
- Enable Cloud Billing export to BigQuery to export your detailed Google Cloud billing data (such as usage, cost estimates, and pricing data) automatically throughout the day to a BigQuery dataset that you specify.
- Access your exported Cloud Billing data for detailed analysis.
- Use tools like Looker Studio to visualize your data.
Learn more about billing data export
Read more about using Looker Studio
