This document describes how you can use AI assistance in AlloyDB for PostgreSQL to troubleshoot slow queries in AlloyDB. You can use the AI assistance capabilities of AlloyDB and Gemini Cloud Assist to investigate, analyze, obtain recommendations, and finally implement those recommendations to optimize your queries in AlloyDB.
Before you begin
To troubleshoot slow queries with AI assistance, do the following:
Required roles and permissions
For the roles and permissions required to troubleshoot slow queries with AI assistance, see Monitor and troubleshoot with AI.
Use AI assistance
To use AI assistance with troubleshooting your slow queries, go to the Query insights dashboard for your AlloyDB instance in Google Cloud console.
Top queries table
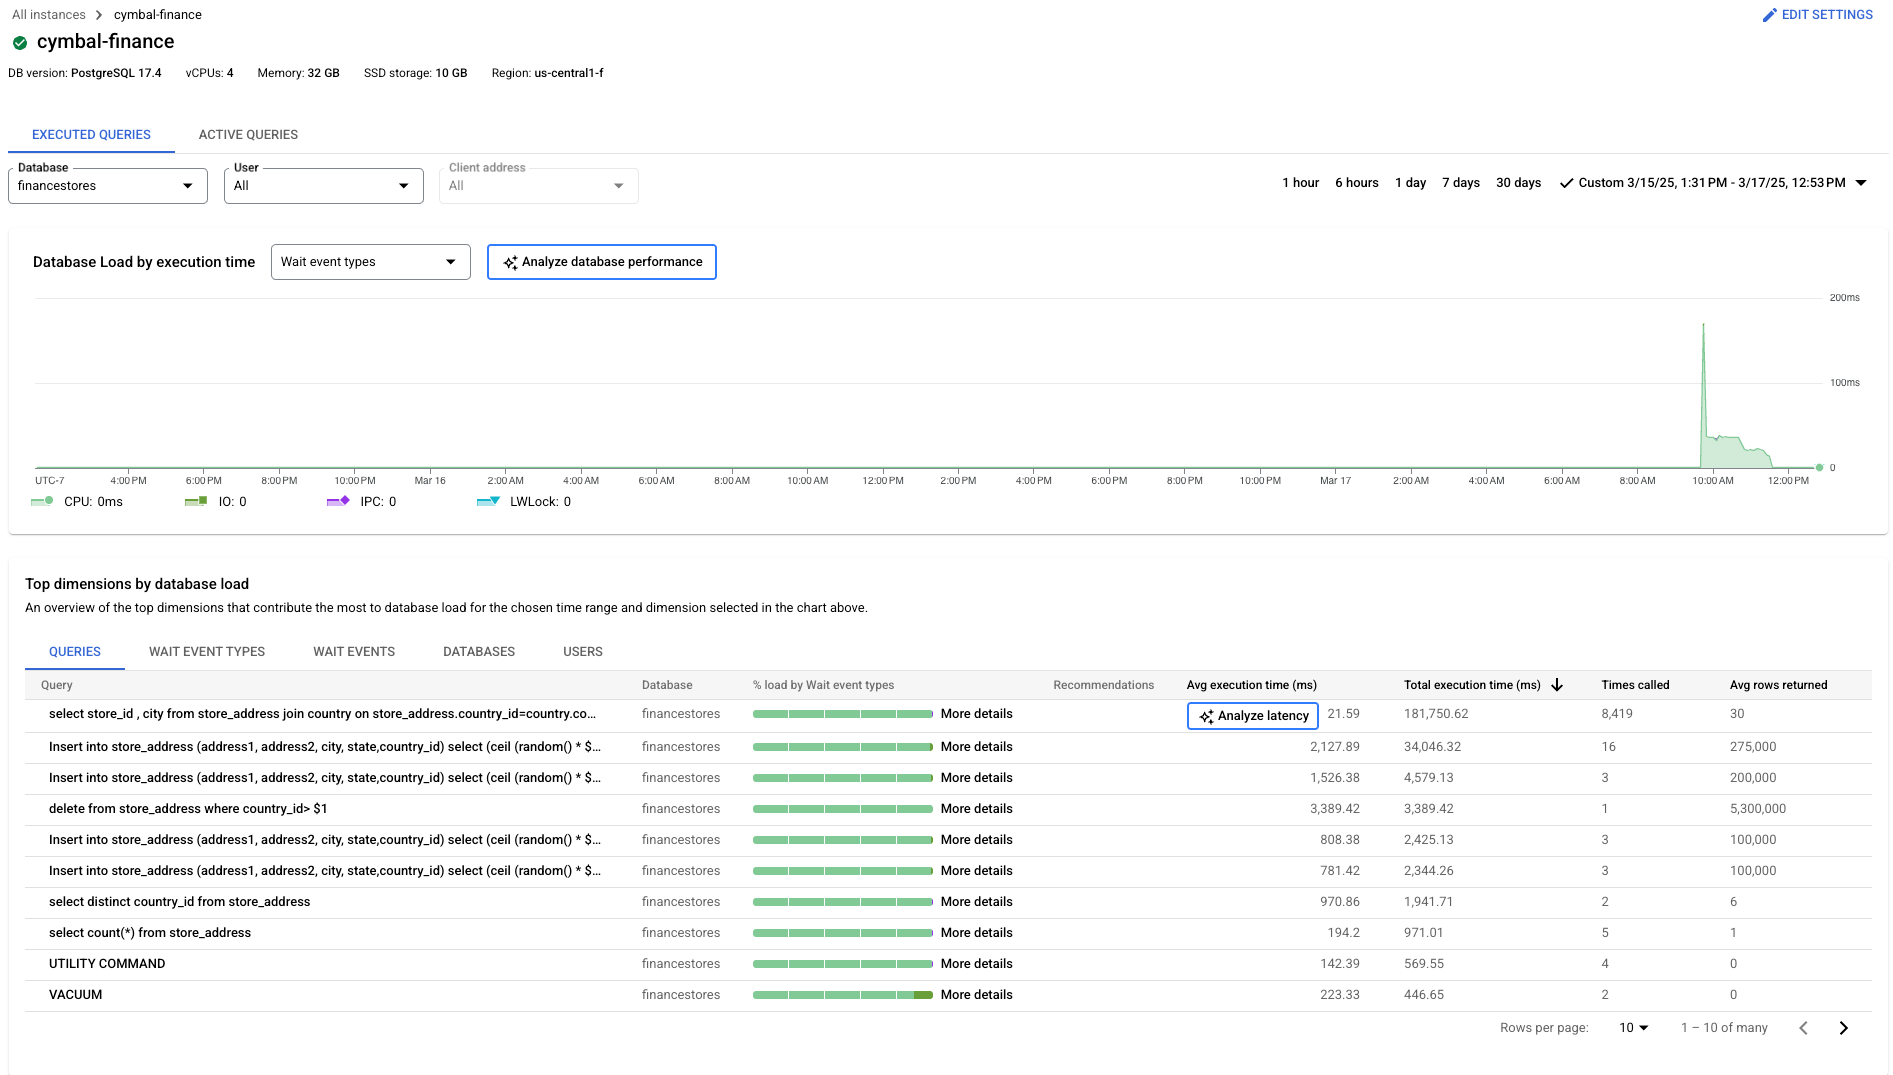
You can start troubleshooting slow queries with AI assistance in the Top queries table section of the Query insights dashboard.
AlloyDB can help you identify which queries are performing slower than average during a specific detection time period. After you select a time range in the Query insights dashboard, AlloyDB checks whether any queries are performing slower than average by using a detection time period of 24 hours before the end of your selected time range.
When you adjust the time range filter of the Database load chart, or any other filter such as database or user, AlloyDB refreshes the Top queries table and reruns anomaly detection based on the new list of queries and an updated detection time period.
When AlloyDB detects an anomaly, AlloyDB performs baseline performance analysis for your query after you click Analyze latency. AlloyDB maps the metrics during the anomaly to the slow query and searches for situations that might have caused the slow performance. If AlloyDB finds a potential situation, then it lets you view the evidence for the situation. Finally, AlloyDB provides recommendations to fix and optimize your query performance.
To troubleshoot slow queries in the Top queries table in the Query insights dashboard, do the following:
- In the Google Cloud console, go to the Clusters page. Go to Clusters
- From the list of clusters and instances, click an instance.
- Click Query Insights.
- In the Executed queries chart, use the Time range filter to select either 1 hour, 6 hours, 1 day, 7 days, 30 days or a custom range.
- In the Top queries table, review the list of queries for your database.
- If Analyze latency appears next to the Avg Execution Time for a query, then AlloyDB has detected an anomaly in your query performance. AlloyDB checks for anomalies within the 24-hour time period that occurs before the end of your selected time range.
- Click Analyze latency to start troubleshooting with AI assistance. This generates the Analyzing query latency page.
- None of the queries listed have experienced an anomaly within the 24-hour detection period of the selected time range.
- Gemini Cloud Assist isn't set up.
If no queries display Analyze latency next to Avg Execution Time, then the reason might be one of the following:
Query details
You can also troubleshoot a slow query with AI assistance from the Query details page.
- In the Google Cloud console, go to the Clusters page. Go to Clusters
- From the list of clusters and instances, click an instance.
- Click Query insights to open the Query insights dashboard.
- In the Query insights dashboard, click the query in the Top queries that you want to view. The Query details page appears.
- Optional: Use the Time range filter to select either 1 hour, 6 hours, 1 day, 7 days, 30 days or a custom range. When you adjust the Time range filter of the Query details page AlloyDB reruns anomaly detection.
- If AlloyDB doesn't detect an anomaly for the query, then you can still run an analysis on the query by clicking Analyze query performance. This generates the Analyzing query latency page.
Analyze query latency
Using AI assistance, you can analyze and troubleshoot the details of your query latency.
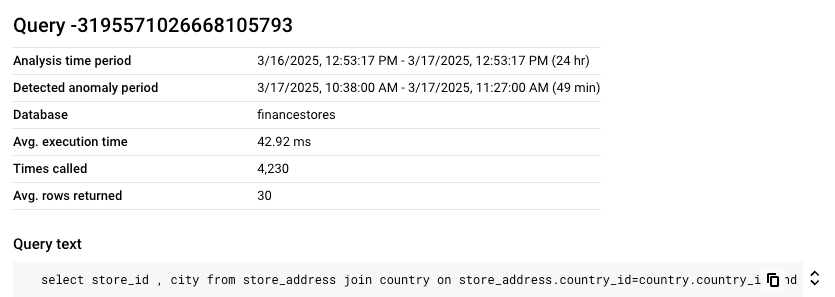
In the Analyzing query latency page, you can view following details for your query and the text of your query:
- Analysis time period
- Detected anomaly period
- Database
- Avg. execution time
- Time called
- Avg rows returned
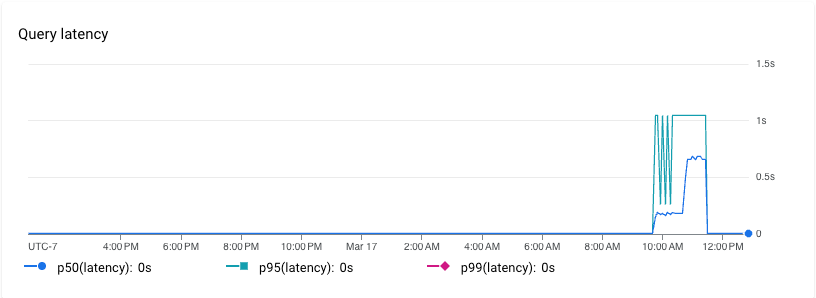
The page also provides a latency chart that shows P50, P95, and P99 latency values over the selected time period. P50 shows you median latency where 50% of query users are experiencing high latency and 50% are experiencing lower latency. Similarly, the P95 and P99 lines show you that 95% and 99% of query users experience the indicated query latencies. For P95, 5% are experiencing a higher latency while for P99, only 1% are experiencing a higher latency.
You can see the specific time period when a significant increase in query latency occurred.
Analysis time period
The analysis time period consists of the 24 hours that occur before the end of the time range that you select in the Database load chart of the Query insights dashboard or the Query details page. AlloyDB uses this time period to compare baseline metrics with the metrics retrieved during the time period of the anomaly.
On the Query details page, if AlloyDB has detected an anomaly with the query, then after you select the query from the Query insights dashboard, AlloyDB performs a baseline performance analysis for the query using the last 24 hours from the end of the anomaly. If AlloyDB hasn't detected an anomaly with the query and runs anomaly detection on the query again, then AlloyDB uses 48 hours before the end of the selected time range as the performance baseline for the analysis time period.
Detected anomaly period
The detected anomaly period represents a time period when AlloyDB finds an anomalous change in query performance. AlloyDB uses the baseline performance measured for the query during the analysis time period.
If AlloyDB detects multiple anomalies for a query within a selected time period, then AlloyDB uses the last detected anomaly.
Situation
After you start your investigation, AlloyDB analyzes your query, any historical data, and tries to identify an underlying situation that might explain the slower performance of your query over the selected time period.
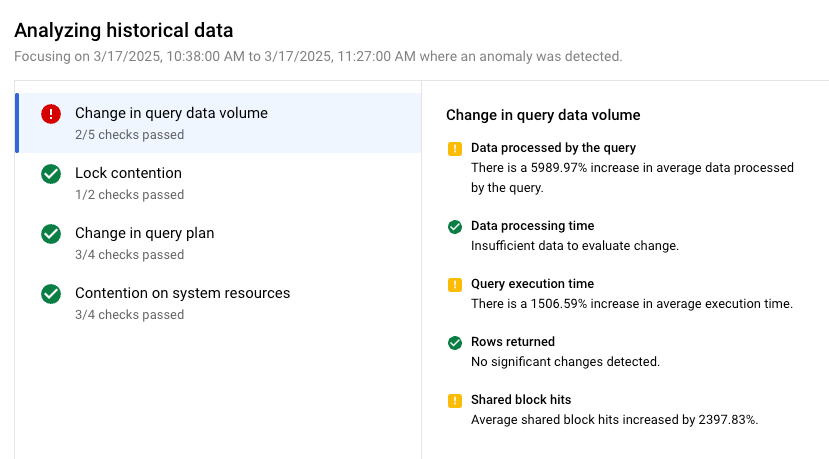
For example, one situation for why your query is slow might be identified as Change in data volume.
In identifying this particular situation, AlloyDB has detected an anomalous increase in data volume for this query. AlloyDB also lists other possible situations where no anomalies are detected, so you can eliminate them as possible root causes.
Evidence
For each situation, AlloyDB provides a list of evidence to support the finding. AlloyDB bases evidence on metrics gathered from the instance, the database, and historical runs of the query.
The evidence presented for each situation reflects any anomaly that AlloyDB detects for the query within the detection time period. AlloyDB defines an anomaly as when a metric surpasses certain thresholds or meets specific criteria.
In this example, to support the situation of a Change in data volume, you might see the following pieces of evidence:
- Data processed by the query: Up to 5989.97% increase in average data processed by the query.
- Query execution time: Up to 1506.59% increase in average execution time.
- Shared block hits: Average shared block hits increased by 2397.83%
You might also see evidence that supports typical or non-anomalous query performance, such as:
- Rows returned: No significant changes detected.
- Data processing time: Insufficient data to evaluate change.
Evidence of standard query execution can help you decide which recommendation might be better for you to implement.
Recommendations
Based on all of the situations analyzed, AlloyDB provides you with one or more actionable recommendations to help remediate the problems with your slow query performance. In this case, AlloyDB presents the recommendations with a cost-benefit analysis so you can make an informed decision on whether to implement the recommendation.
For example, you might receive the following recommendations:
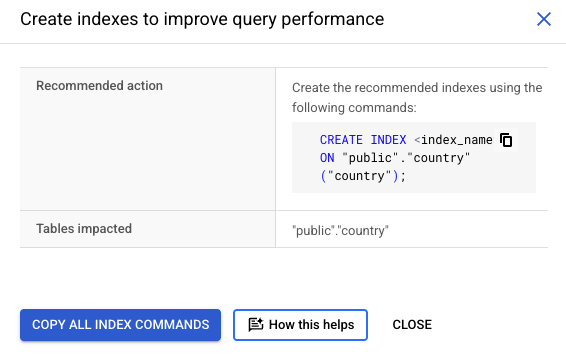
- Create recommended indexes: Create a new index on
countryto improve the performance of this query.
To implement this recommendation, do the following:
- In the Recommendations table, click View details next to the recommendation that you want to implement. The Insight and recommendation window appears.
- In the Insight and recommendation window, review the Recommended action and Tables impacted.
- Optional: If you want to learn more about index recommendations, then click How this helps to open Gemini Cloud Assist.
- Click Copy all index commands.
- Authenticate to AlloyDB Studio.
- Paste the
CREATE INDEXcommand into AlloyDB Studio to create the index. For more information about running SQL commands in AlloyDB Studio, see Manage your data using AlloyDB Studio.
If you want to continue troubleshooting or get more assistance with query performance, then you can also open Gemini Cloud Assist. For more information, see Observe and troubleshoot with AI assistance.