与火焰图进行交互
Cloud Profiler 使用火焰图显示性能剖析数据。如需了解概念性简介,请参阅火焰图。
火焰图由多个帧 (frame) 组成。每个帧均表示服务中的一个函数:
帧宽度对应的是正在分析的指标的使用情况。例如,顶层帧表示整个服务,它使用了所有正在分析的指标。因此,此帧显示为全宽。
默认情况下,帧颜色会尽可能对应函数包。如果函数包信息不可用,那么与 Node.js 一样,帧会使用源文件的名称为函数块着色。在调用堆栈中,如果块颜色更改,则意味着从一个包转换为了另一个包。您可以更改帧着色方式。如需了解详情,请参阅颜色模式。
火焰图显示了一个或多个调用堆栈,其中包含对一组性能剖析文件求取的平均值:
- 每个性能剖析文件均表示从单个 Compute Engine 地区中已配置服务的单个实例收集的数据,每分钟收集一次。性能剖析文件的收集周期因性能剖析文件类型而异。如需了解详情,请参阅性能剖析文件收集。
- 您最多可对 250 个性能剖析文件求取平均值。如果可用的性能剖析文件超过 250 个,则会从中随机选择 250 个性能剖析文件作为样本集。
- 火焰图中的顶层帧(即“根”)表示整个服务。 “根”帧下是另一个或另一组帧,构成了火焰图的第二行。 每个以不同颜色标示的帧都是服务发出的顶级调用。 每个彩色函数帧下都是另一组函数帧,其中每个函数帧都负责为其上一层帧提供部分资源。 图中的函数帧层次结构表示调用序列,帧宽度表示相应函数或方法的资源耗用量。
例如,Docdemo-service 所耗用堆的 Profiler 图显示该服务会调用不同的顶层帧,其中一个是 Go 运行时的 main 函数。这些顶层帧的宽度显示了涉及 Go 运行时的 main、应用专属 main、allocOnce 和 allocImpl 的调用堆栈所耗用的大部分堆:
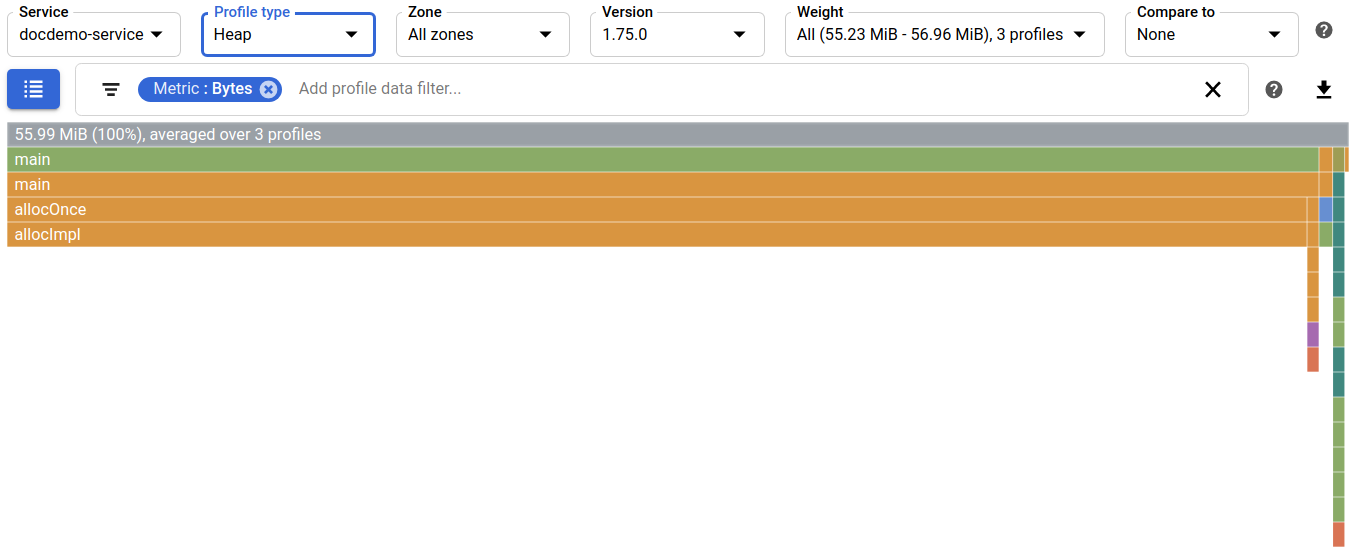
根帧会显示指标耗用信息。
将鼠标悬停在帧上
将指针悬停在火焰图中的帧上方时,帧提示工具会打开并显示有关此帧的更多信息:
- 函数名称
- 函数文件名
- 绝对用量和百分比用量
在指标耗用信息中,前缀 total 表明指标值和百分比是针对函数及其子函数的。 相比之下,前缀 self 表明指标值和百分比仅针对函数(不包括子函数的耗用情况)。
该对话框还包含按钮:
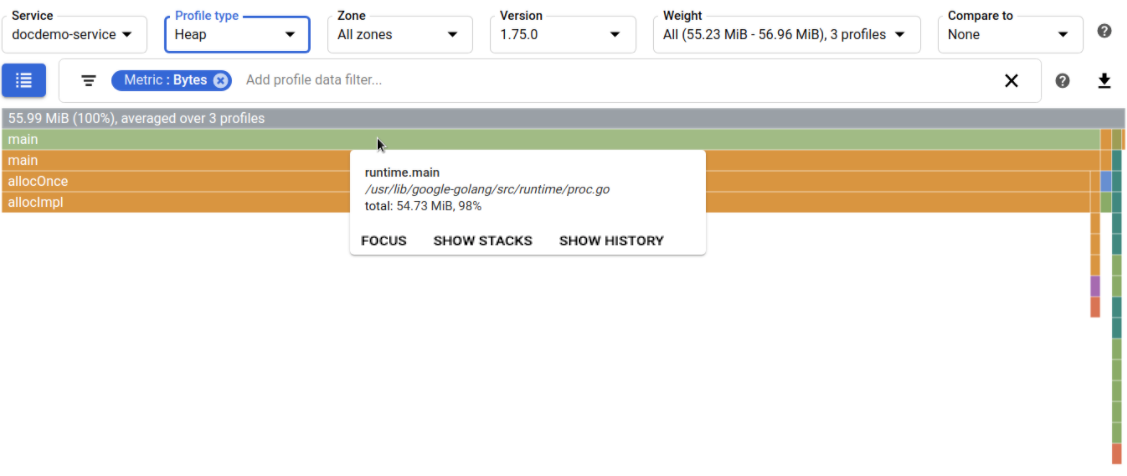
在此示例中,提示信息表明 runtime.main 函数位于 /usr/local/go/src/runtime/proc.go 文件中。指标耗用信息表明,runtime.main 及其子项耗用了 54.73 MiB 的内存,即该程序约耗用了总内存的 98%:
选择帧
选择某个帧后,系统会重新绘制火焰图并以全宽方式显示相应帧,同时调用堆栈中更高处的颜色将显示为灰色。选择帧不会更改任何设置,而只会更改火焰图的显示方式。若要还原为原始视图,请选择根(顶层)帧。
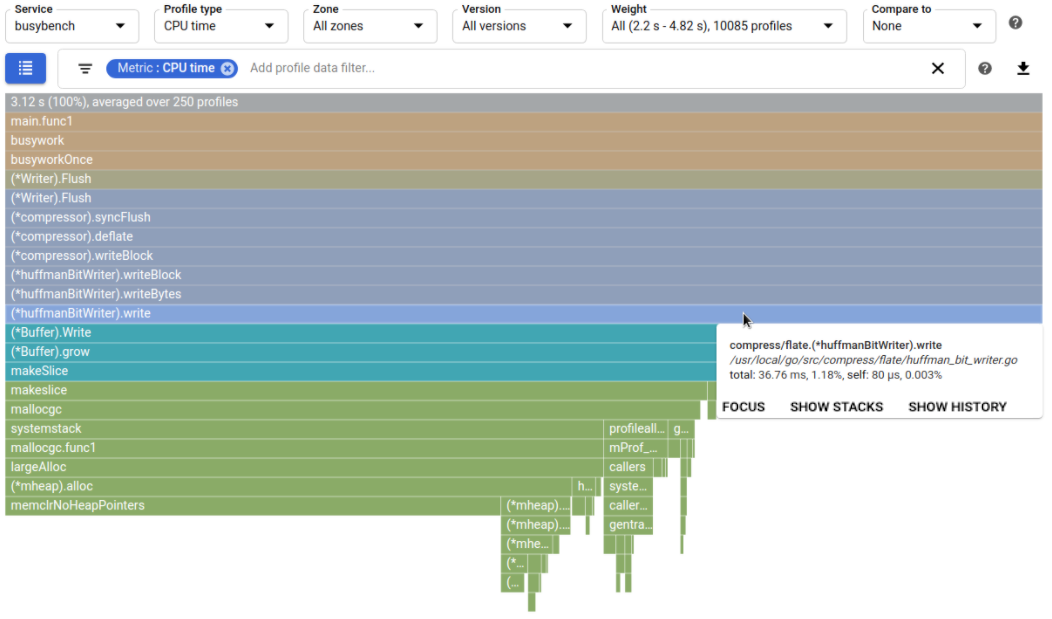
在以下示例中,指针位于一个极小的帧上,很难查看调用堆栈。提示工具将 (*huffmanBitWriter).write 识别为帧函数:
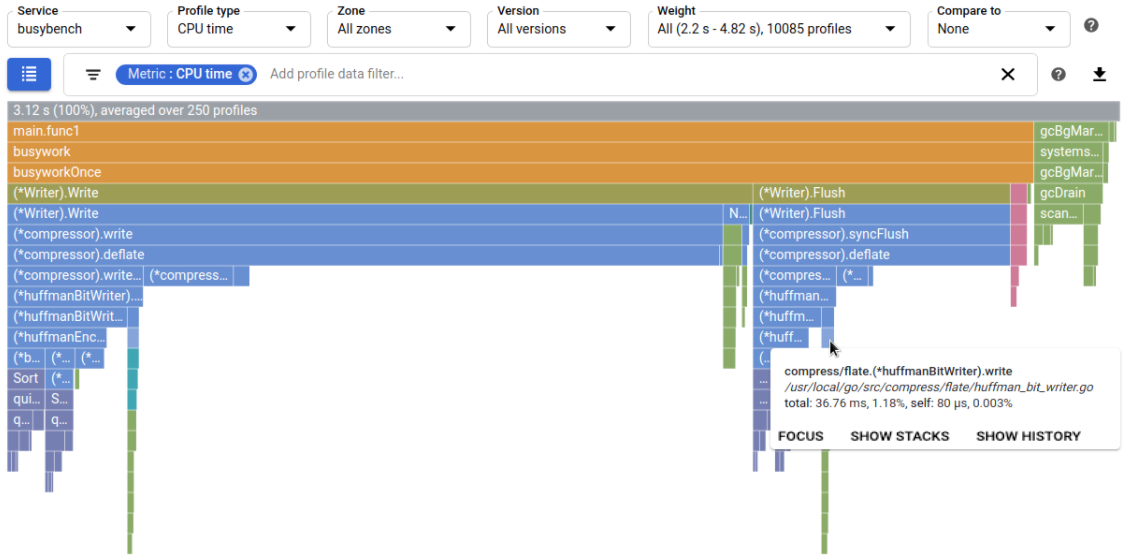
选择此帧后,系统会重新绘制此图,使调用堆栈更加醒目: