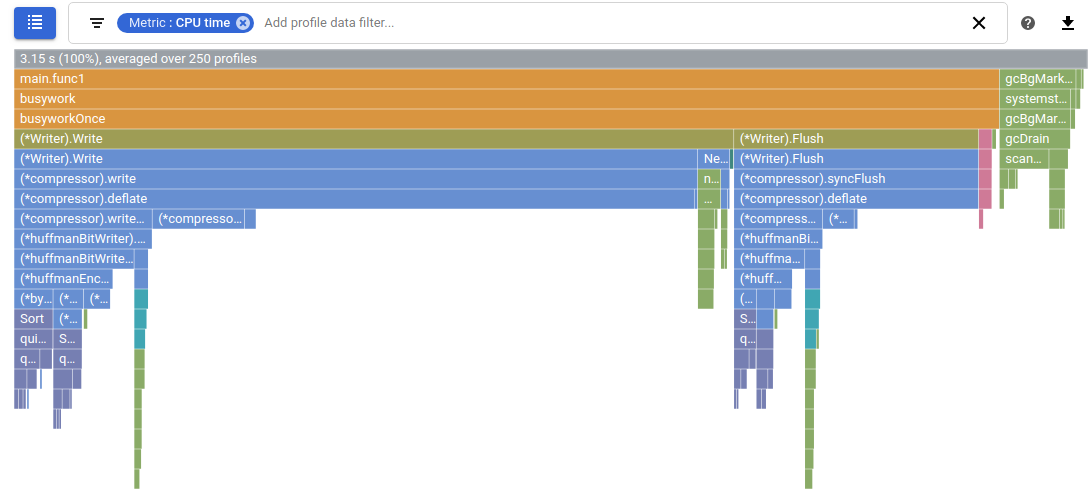
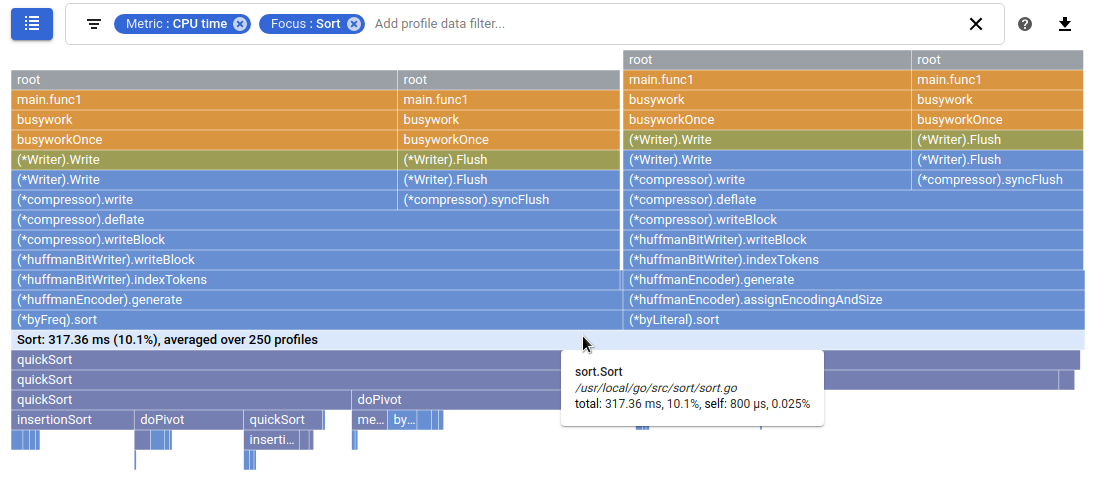
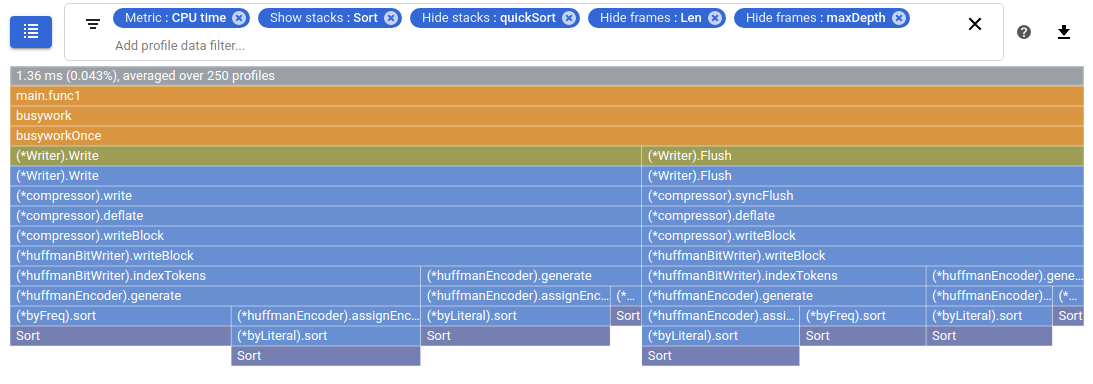
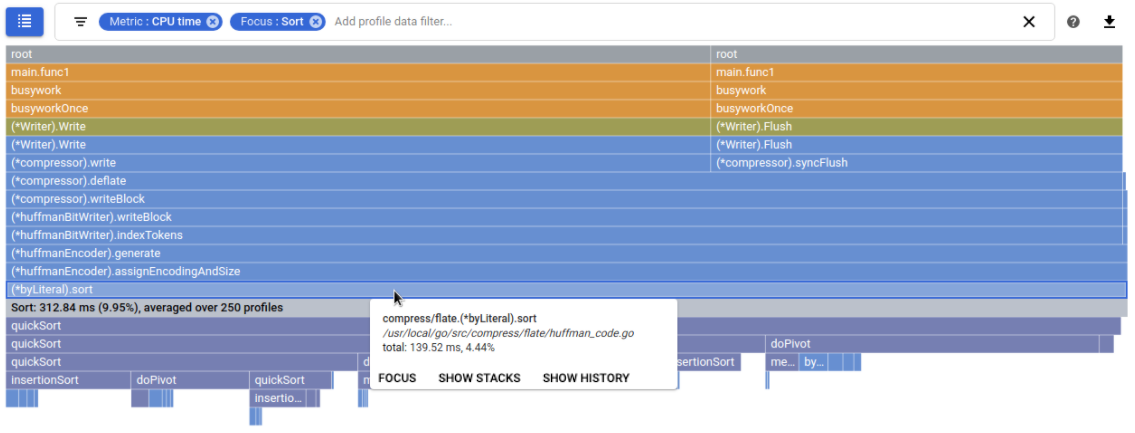
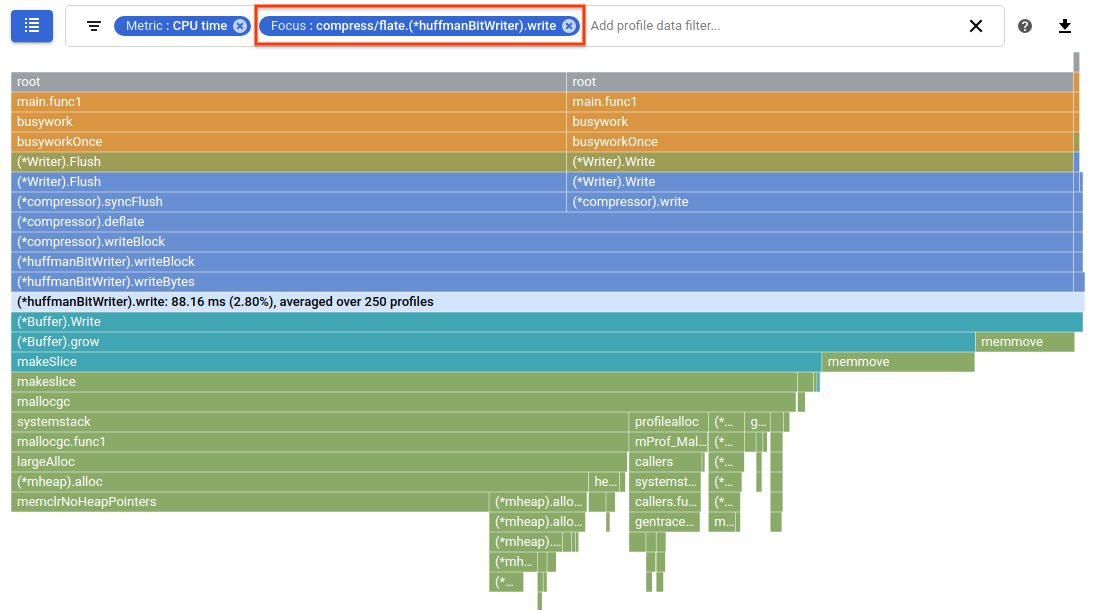
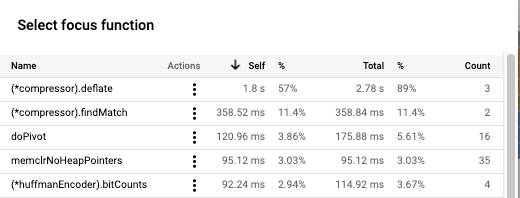
[[["易于理解","easyToUnderstand","thumb-up"],["解决了我的问题","solvedMyProblem","thumb-up"],["其他","otherUp","thumb-up"]],[["很难理解","hardToUnderstand","thumb-down"],["信息或示例代码不正确","incorrectInformationOrSampleCode","thumb-down"],["没有我需要的信息/示例","missingTheInformationSamplesINeed","thumb-down"],["翻译问题","translationIssue","thumb-down"],["其他","otherDown","thumb-down"]],["最后更新时间 (UTC):2025-08-18。"],[],[],null,["# Focus the flame graph\n=====================\n\nWhen you use the **Focus** filter, you\nselect a single *function*, and the flame graph displays the code paths\nthat flow into, and out of, that specific function. A focused graph lets you\nperform two common tasks:\n\n1. Analyzing the aggregate resource consumption of a given function that is called from multiple places.\n2. Analyzing the proportion of time spent in a function for different callers of the function.\n\nFor example, how do you analyze the resource consumption around the `Sort`\nfunction by using the standard flame graph?\n\nIn the next section, we focus the graph on `Sort` and answer this question.\nThe flame graphs on this page were constructed with the **Color mode**\nand **Compare to** set to the default values of **Name** and **None**\nrespectively.\n\nFocused graph explained\n-----------------------\n\nThe graph built by the **Focus** filter effectively creates two flame graphs\nfor the specified function and joins them together:\n\nIn the preceding graph, the frame corresponding to the `Sort` function\nis full width and highlighted. The frame text includes the function name, a\npercentage, and the number of profiles used for the analysis. In this case,\nthe metrics indicate that the `Sort` function, in aggregate, consumed\n8.85% of the CPU time.\n\nThe bottom half of the preceding graph treats the function `Sort` as the\nstarting point of a standard flame graph and shows all of its callees.\nYou can create this part with the standard flame graph using the\n**Show from frame** filter:\n\nThe top half of the graph shows the callers of `Sort` with the callees\nhidden. You can make an approximation of the top half using a series of filters.\nStart by adding a **Show stacks** filter for `Sort`. Next, for each function\ncalled by `Sort`, add either a **Hide stacks** or **Hide frames** . In this\nsituation, you would add a **Hide stacks** for `quickSort` to eliminate this\nfunction and its children, and then add **Hide frames** for `Len` and\n`maxDepth`:\n\nUsing these filters, the approximation of the top half of the focused graph\nshows that the `Sort` function is reached through different\ncall stacks. However, the metrics aren't aggregated so the graph doesn't\nillustrate overall metric consumption by `Sort`.\n\nThe focused graph is a little different than a graph that just combines\nthe two approximations:\n\n- There is a single frame for the focus function `Sort`.\n- The focus function frame is highlighted, is full-width frame, and displays metrics that are the aggregation of all call stacks.\n- There are multiple call stacks, each beginning with a `root` frame, so you can view the entire call stack.\n\n### Selecting a frame\n\nIf you select a frame in a focused graph, then the flame graph is redrawn\nwith that frame's call stack displayed in more detail. If the frame is reached\nthrough multiple call stacks, each of those call stacks is displayed. Call\nstacks that don't include the frame are hidden from view. To restore the graph\nto its original state, select the frame that corresponds to the focus function.\n\nIn the previous example, `Sort` is called by `(*byFreq).sort` and by\n`(*byLiteral).sort`. To view the call stack for `(*byLiteral).sort` in more\ndetail, select that frame.\nYou can select another frame and further refine the call stacks being displayed:\n\nTo restore a focused flame graph to its original state, select the frame that\ndisplays the value of the **Focus** filter. In this case, select the gray frame\nwith the label `Sort`. Note that to restore a standard flame graph to its\noriginal state you select the root frame.\n\n### Analyzing the graph\n\nTo analyze a focused flame graph, you use the same controls and filters\nthat you use to analyze a standard flame graph. However, there are\ndifferences in how the graphs interact with the pointer:\n\n- If your pointer hovers on a frame, the tooltip displays metric data.\n For a standard flame graph, total metric data for the frame is shown.\n For a focused flame graph, aggregate metric data for the function is shown.\n\n- If you select a frame, the flame graph is redrawn with that frame displayed\n full width. To restore a standard flame graph to its original form,\n you must select the top frame. To restore a focused flame graph to its\n original form, you must select the frame that displays the value of the\n focus filter.\n\nFor information on the focused graph when you are comparing profiles,\nsee [Focusing a comparison](/profiler/docs/comparing-profiles#with-focus).\n\nSetting the focus filter\n------------------------\n\nThere are different methods you can use to set a focus filter but they result in\nthe same graph.\n\n### By using the graph\n\nPlace your pointer on the frame of interest, and then click **Focus** in the\nframe tooltip.\nThe focus function is extracted from the frame.\nIn this example the flame graph, which is expanded around the function\n`(*huffmanBitWriter).write`, displays three different call stacks:\n\n### By using the focus list\n\nTo focus the flame graph on a specific function, do the following:\n\n1. Click **List** *list* to open the **Select focus function** table.\n2. Select a function name from the table or, for a specific function, click **Actions** *more_vert* and then select **Focus**:\n\nIf the function you selected can be called through different call stacks,\neach call stack is shown in the flame graph.\n\nYou can sort the table rows in ascending *arrow_upward* or\ndescending *arrow_downward*\norder by selecting a table header element.\nEach row in the table displays a function name and\nstatistics related to the function's execution.\nThis table shows that the `(*compressor).deflate` function requires 2.78 s to\nexecute, with 1.8 s spent in the function itself and the remainder of the\ntime spent in its call stack.\nOne percentage column reports that 57% of the total execution time is spent\nin the function `(*compressor).deflate`. Another column reports that 89% of the\ntime, `(*compressor).deflate` or a function in its call stack, is executing.\nLastly, the count column reports\nthat there are three sequences that invoke the function `(*compressor).deflate`.\n\nWhen you are comparing profiles, the content of the focus list is different.\nFor more information, see [Focusing a comparison](/profiler/docs/comparing-profiles#with-focus).\n\n### By using the filter bar\n\nClick the gray text **Add profile data filter** in the filter\nbar, and then enter `Focus:` and a string that identifies\nthe function to focus on. You can use a substring, including package prefixes,\nor the full name. When you supply an ambiguous string, the function that is the\nbest match to the string is selected.\n\nIf you prefer, you can click **Filters** ,\nselect **Focus**, and then enter the identifying string.\n\nIf the function you selected can be called through different call stacks,\neach call stack is shown in the flame graph.\n\nRemoving the focus filter\n-------------------------\n\nTo remove the focus filter, click **Close**\n*close* on the filter.\n\nWhat's next\n-----------\n\n- [View historical trends](/profiler/docs/history-view).\n- [Download profile data](/profiler/docs/downloading-profiles)."]]