Flame graphs
Cloud Profiler displays profiling data by using Flame Graphs. Unlike trees and graphs, flame graphs make efficient use of screen space by representing a large amount of information in a compact and readable format.
To introduce flame graphs, this page illustrates how to convert a tree into a flame graph and summarizes key features of flame graphs.
Creating a flame graph
To create a flame graph from a tree, complete the steps illustrated in the following diagram:
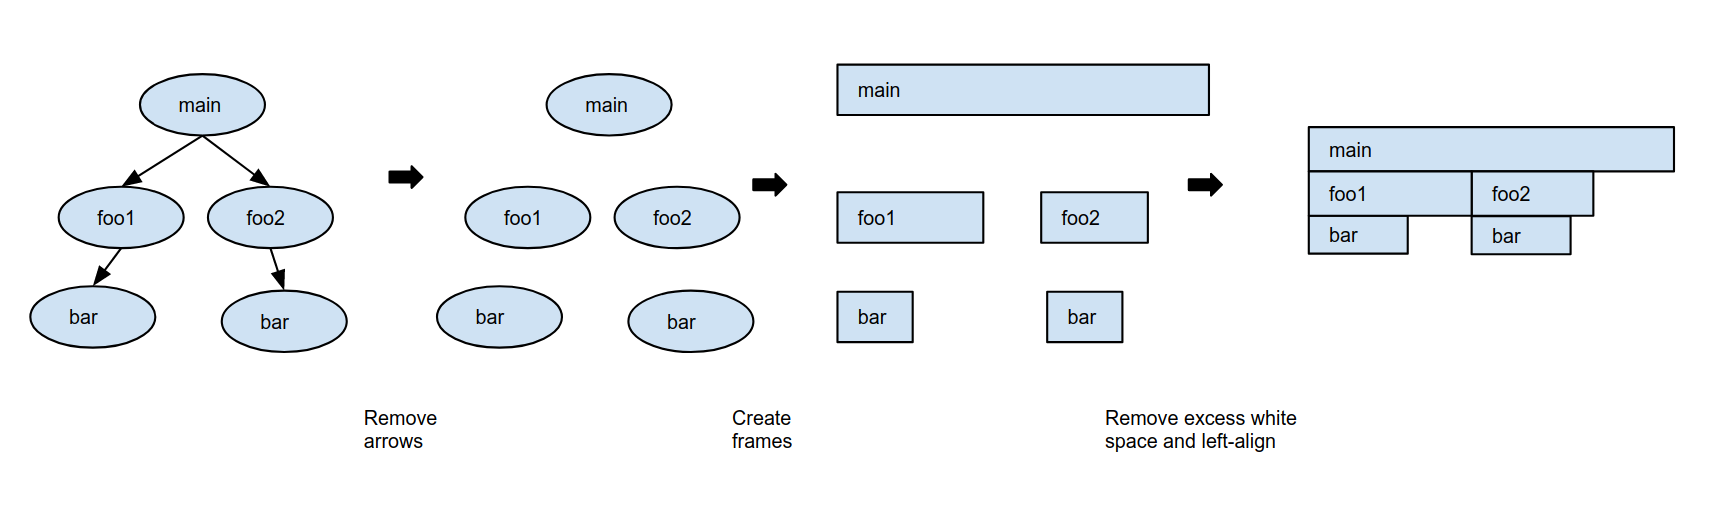
Remove from the tree the arrows that indicate function calls.
Replace each tree node with a frame.
Frames are rectangular in shape and all frames have the same height. For the example on this page, the total CPU time used by the function named in the frame determines the frame width.
The pseudo code for each of the functions is described in the following table. The CPU intensive work performed during a function's execution defines the self CPU time:
Function pseudo code self CPU time
(seconds)total CPU time
(seconds)func main(): foo1() foo2() // CPU intensive work // for 2 seconds2 4 + 3 + 2 = 9 func foo1(): bar() // CPU intensive work // for 1.5 seconds1.5 2.5 + 1.5 = 4 func foo2(): bar() // CPU intensive work // for 0.5 seconds0.5 2.5 + 0.5 = 3 func bar(): // CPU intensive work // for 2.5 seconds2.5 2.5 The next step is to remove the vertical space between the frames and left align frames while preserving call sequences. Optionally, you can define a color scheme and color the frames according to the definition. For example, you can color frames by their package, by total CPU time, by self CPU time, or by a different measure.
After removing excess whitespace and coloring frames by the self CPU time, the flame graph now appears as follows:
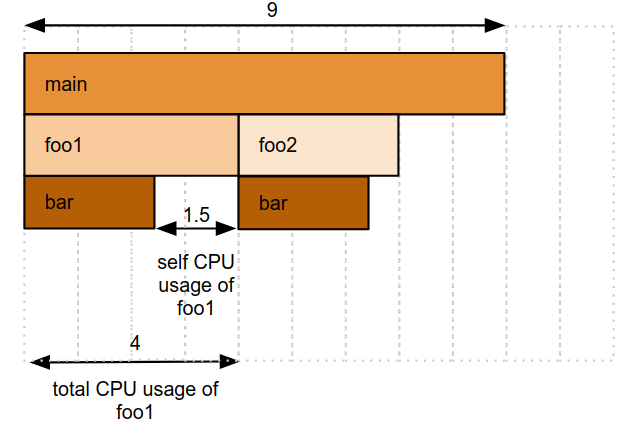
Notice that the call stacks for
foo1andfoo2have been preserved, even though the call stack starting withfoo2is now next to the frame forfoo1.
Summary
This simple example illustrates the following:
- Flame graphs are a compact representation of a tree and you can recreate a call stack by tracing frames from the top downwards.
- Frames name a function and the frame width is the relative measure
of that function's total CPU time.
In this example, because the total CPU time of
foo2is one third of the total CPU time ofmain, the frame forfoo2is one third the width of the frame formain. - The width of the empty space below a frame is the relative measure of
the self CPU time for the function named in the frame.
For example, below the frame
foo1, 1.5 units are empty and 2.5 units are occupied bybar. Therefore the self CPU time offoo1is 37.5% of its total CPU time, or 1.5 s. As you follow a call stack, the widths of the frames decrease because the total CPU time of a callee can never be more than the total CPU time of the caller. This behavior is what causes the flame shape.
In the example,
foo1callsbarand the total CPU time offoo1is defined to be the total CPU time ofbarplus the self CPU time offoo1. Therefore, the total CPU time ofbarcannot be more than the total CPU time offoo1.
What's next
- Select the profiles to analyze
- Interact with the flame graph
- Filter the flame graph
- Focus the flame graph
- Compare profiles