This document describes the tools and files you can use to monitor and troubleshoot Serverless for Apache Spark batch workloads.
Troubleshoot workloads from the Google Cloud console
When a batch job fails or has poor performance, a recommended first step is to open to its Batch details page from the Batches page in the Google Cloud console.
Use the Summary tab: your troubleshooting Hub
The Summary tab, which is selected by default when the Batch details page opens, displays critical metrics and filtered logs to help you make a quick initial assessment of batch health. After this initial assessment, you can perform a deeper analysis using more specialized tools available from the Batch details page, such as the Spark UI, the Logs Explorer, and Gemini Cloud Assist.
Batch metric highlights
The Summary tab on the Batch details page includes charts that display important batch workload metric values. The metric charts populate after the completes, and offer a visual indication of potential issues such as resource contention, data skew, or memory pressure.
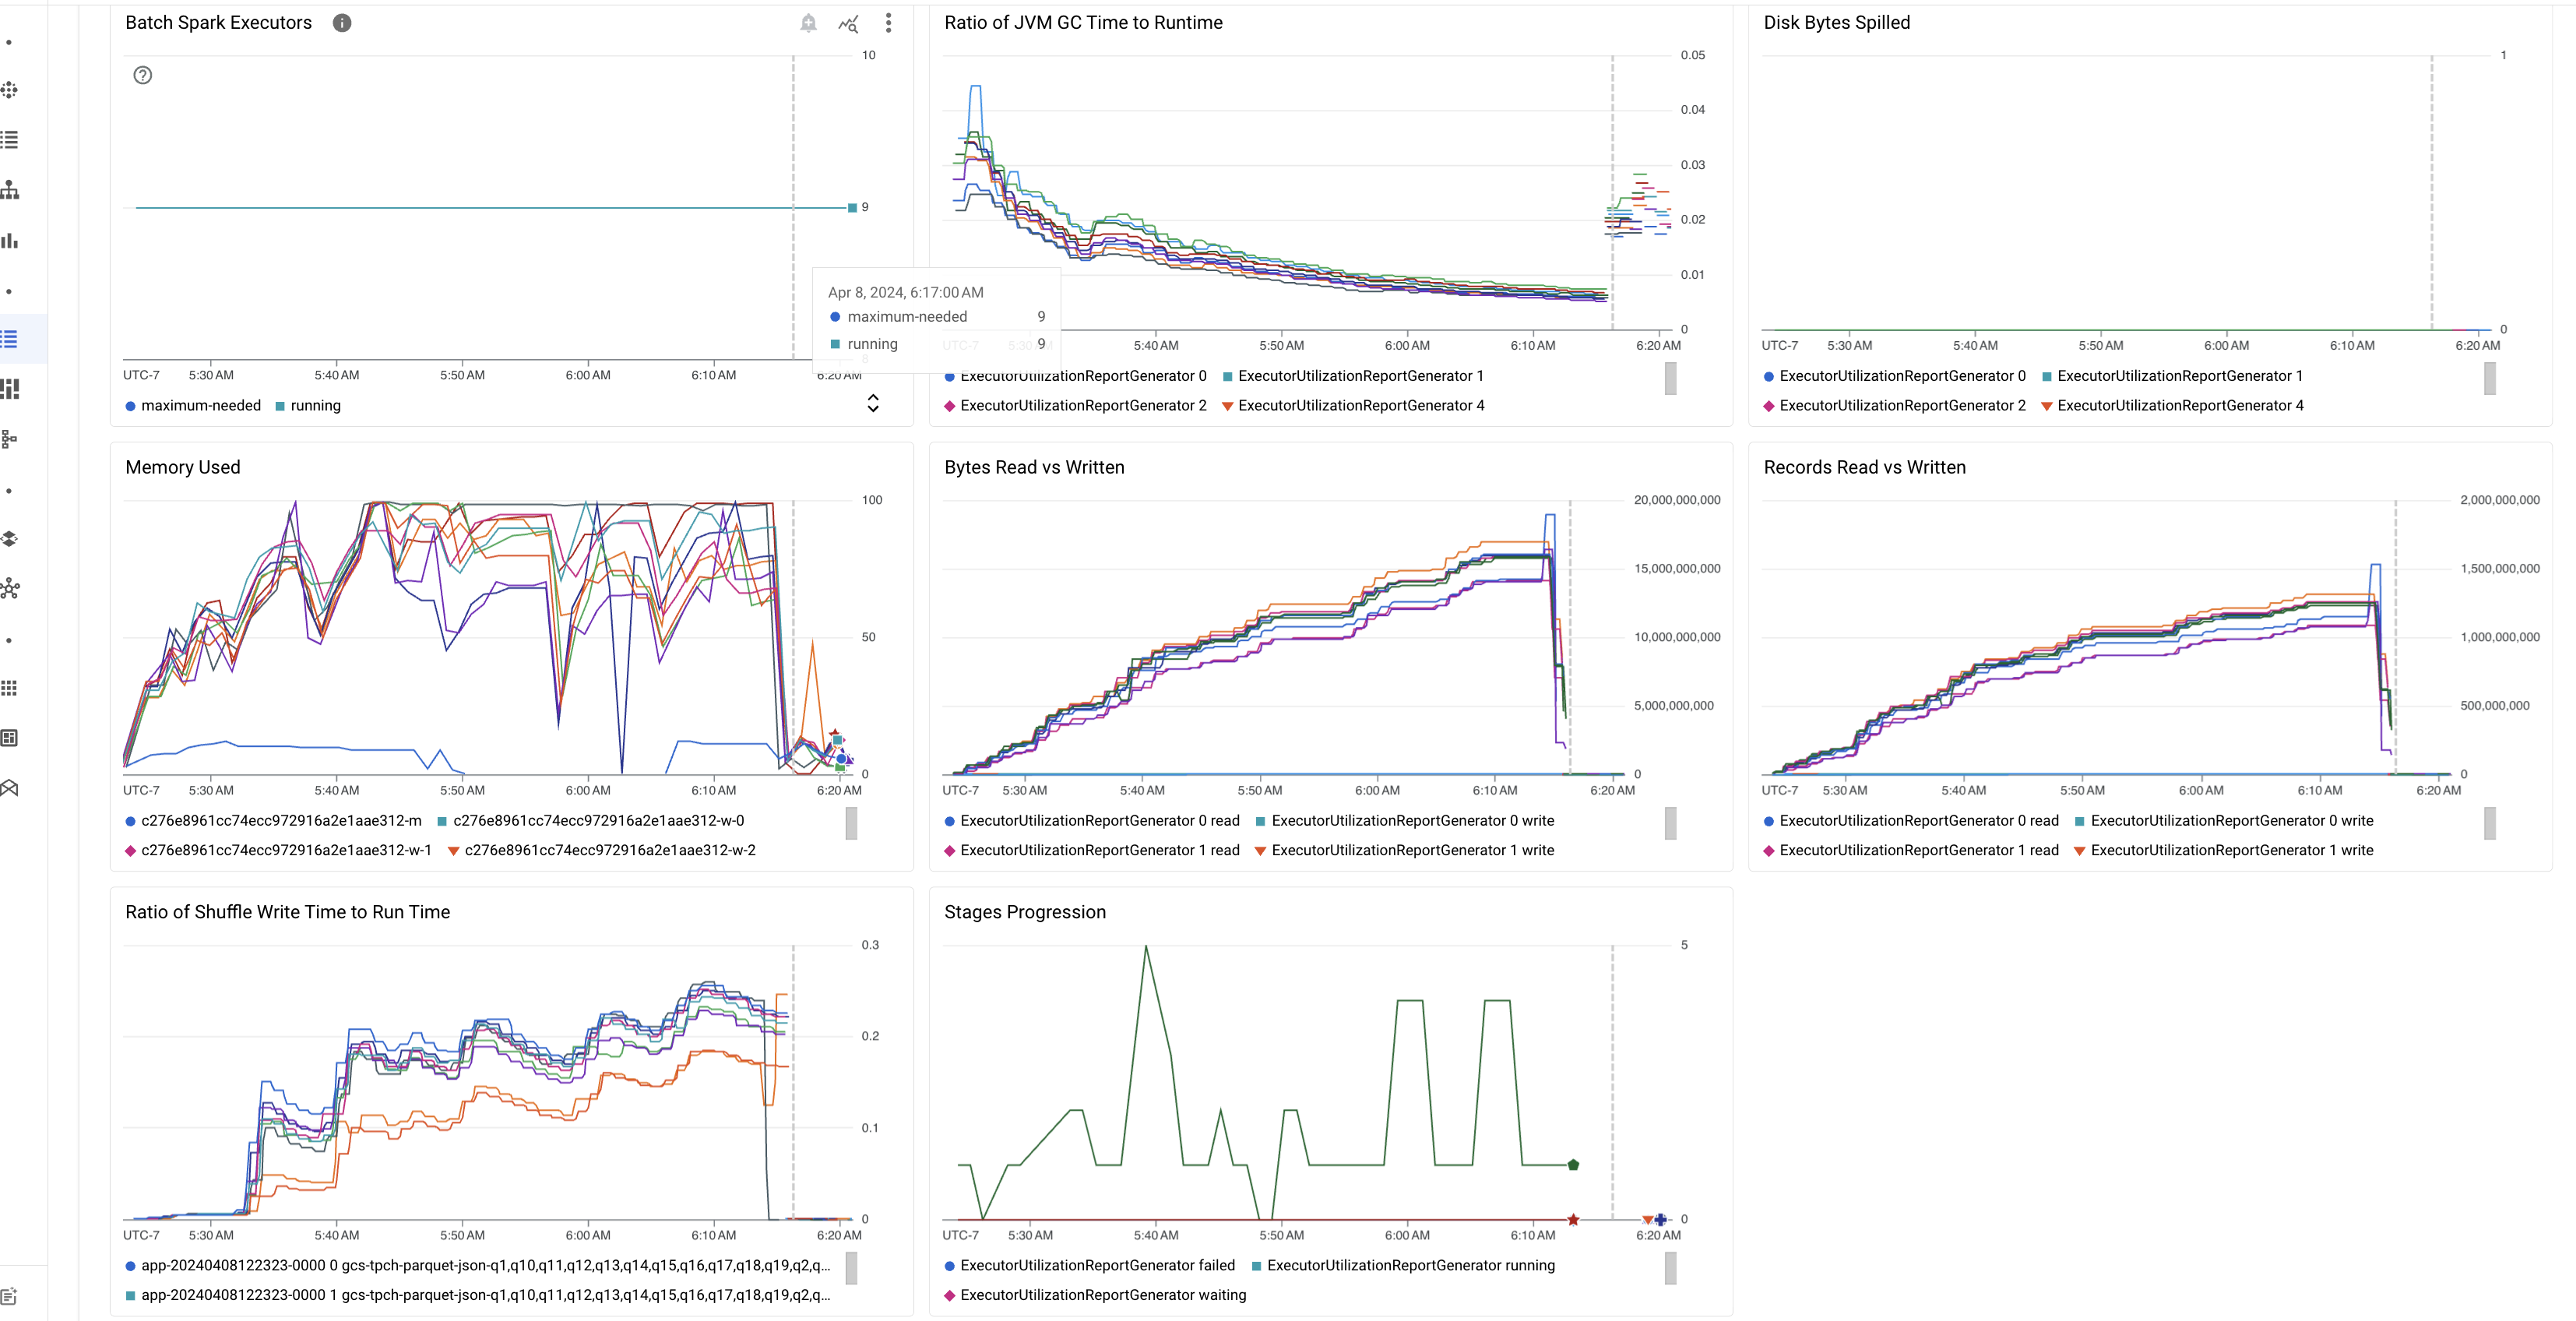
The following table lists the Spark workload metrics displayed on the Batch details page in the Google Cloud console, and describes how metric values can provide insight into workload status and performance.
| Metric | What does it show? |
|---|---|
| Metrics at the Executor level | |
| Ratio of JVM GC Time to Runtime | This metric shows the ratio of JVM GC (garbage collection) time to runtime per executor. High ratios can indicate memory leaks within tasks running on particular executors or inefficient data structures, which can lead to high object churn. |
| Disk Bytes Spilled | This metric shows the total number of disk bytes spilled across different executors. If an executor shows high disk bytes spilled, this can indicate data skew. If the metric increases over time, this can indicate that there are stages with memory pressure or memory leaks. |
| Bytes Read and Written | This metric shows the bytes written versus bytes read per executor. Large discrepancies in bytes read or written can indicate scenarios where replicated joins lead to data amplification on specific executors. |
| Records Read and Written | This metric shows records read and written per executor. Large numbers record read with low numbers of records written can indicate a bottleneck in processing logic on specific executors, leading to records being read while waiting. Executors that consistently lag in reads and writes can indicate resource contention on those nodes or executor-specific code inefficiencies. |
| Ratio of Shuffle Write Time to Run Time | The metric shows the amount of time the executor spent in shuffle runtime as compared to overall runtime. If this value is high for some executors, it can indicate data skew or inefficient data serialization. You can identify stages with long shuffle write times in the Spark UI. Look for outlier tasks within those stages taking more than the average time to complete. Check whether the executors with high shuffle write times also show high disk I/O activity. More efficient serialization and additional partitioning steps might help. Very large record writes compared to record reads can indicate unintended data duplication due to inefficient joins or incorrect transformations. |
| Metrics at the Application level | |
| Stages Progression | This metric shows the number of stages in failed, waiting, and running stages. A large number of failed or waiting stages can indicate data skew. Check for data partitions, and debug the reason for stage failure using the Stages tab in the Spark UI. |
| Batch Spark Executors | This metric shows the number of executors that might be required versus the number of executors running. A large difference between required and running executors can indicate autoscaling issues. |
| Metrics at the VM level | |
| Memory Used | This metric shows the percentage of VM memory in use. If the master percentage is high, it can indicate that the driver is under memory pressure. For other VM nodes, a high percentage can indicate that the executors are running out of memory, which can lead to high disk spillage and a slower workload runtime. Use the Spark UI to analyze executors to check for high GC time and high task failures. Also debug Spark code for large dataset caching and unnecessary broadcast of variables. |
Job logs
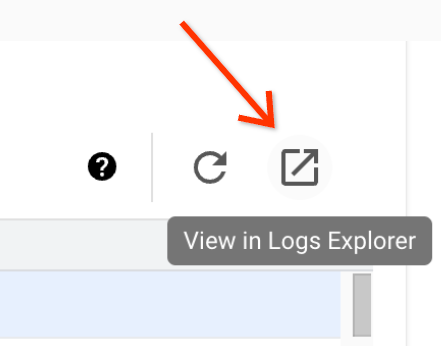
The Batch details page includes a Job logs section that lists warnings and errors filtered from the job (batch workload) logs. his feature allows for quick identification of critical issues without needing to manually parse through extensive log files. You can select a log Severity (for example, Error) from the drop-down menu and add a text Filter to narrow down the results. To perform a more in-depth analysis, click the View in Logs Explorer icon
to open the selected batch logs in the Logs Explorer.
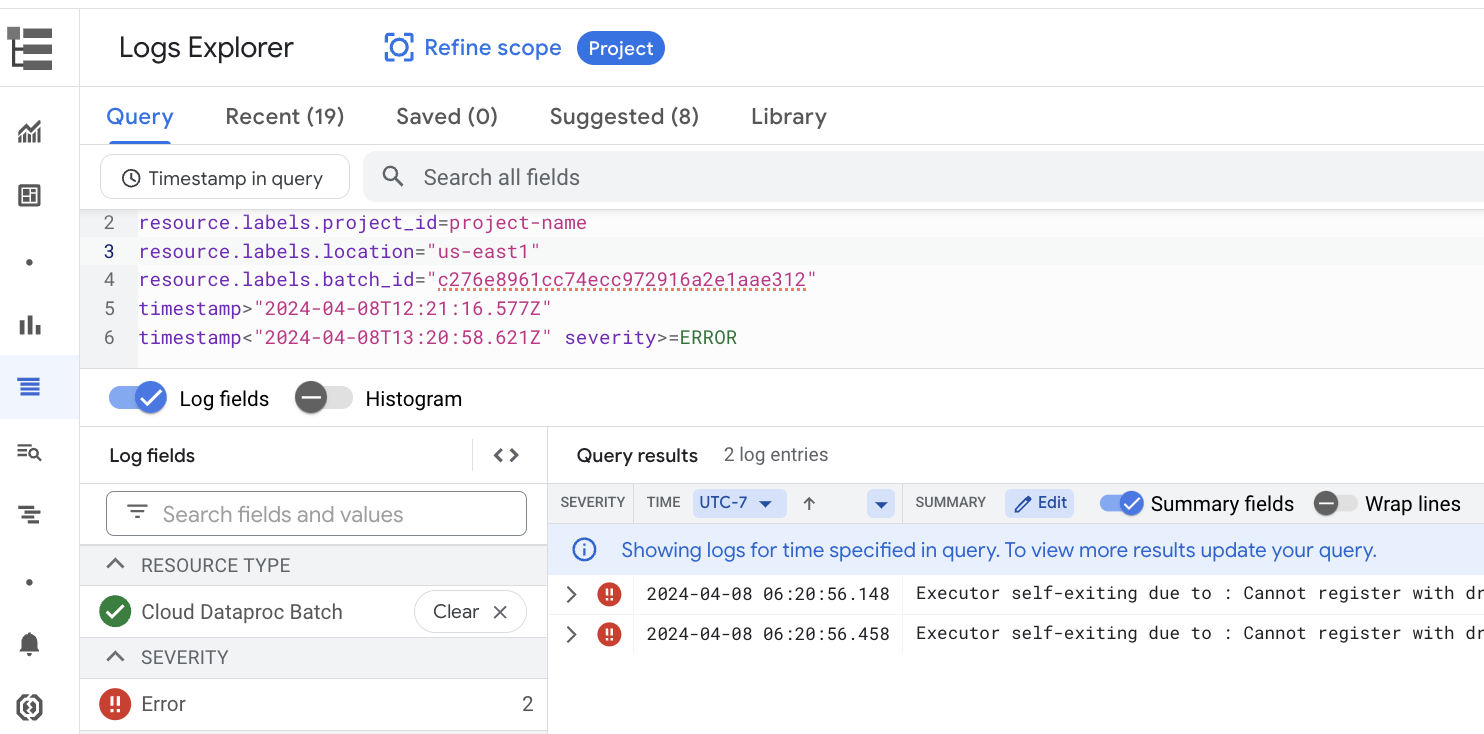
Example: Logs Explorer opens after choosing Errors from the Severity
selector on the Batch details page in the Google Cloud console.
Spark UI
The Spark UI collects Apache Spark execution details from Serverless for Apache Spark batch workloads. There is no charge for the Spark UI feature, which is enabled by default.
Data collected by the Spark UI feature is retained for 90 days. You can use this web interface to monitor and debug Spark workloads without having to create a Persistent History Server.
Required Identity and Access Management permissions and roles
The following permissions are required to use the Spark UI feature with batch workloads.
Data collection permission:
dataproc.batches.sparkApplicationWrite. This permission must be granted to the service account that runs batch workloads. This permission is included in theDataproc Workerrole, which is automatically granted to the Compute Engine default service account that Serverless for Apache Spark uses by default (see Serverless for Apache Spark service account). However, if you specify a custom service account for your batch workload, you must add thedataproc.batches.sparkApplicationWritepermission to that service account (typically, by granting the service account the DataprocWorkerrole).Spark UI access permission:
dataproc.batches.sparkApplicationRead. This permission must be granted to a user to access the Spark UI in the Google Cloud console. This permission is included in theDataproc Viewer,Dataproc EditorandDataproc Administratorroles. To open the Spark UI in the Google Cloud console, you must have one of these roles or have a custom role that includes this permission.
Open the Spark UI
The Spark UI page is available in the Google Cloud console batch workloads.
Go to the Serverless for Apache Spark interactive sessions page.
Click a Batch ID to open the Batch details page.
Click View Spark UI in the top menu.
The View Spark UI button is disabled in the following cases:
- If a required permission isn't granted
- If you clear the Enable Spark UI checkbox on the Batch details page
- If you set the
spark.dataproc.appContext.enabledproperty tofalsewhen you submit a batch workload
Serverless for Apache Spark logs
Logging is enabled by default in Serverless for Apache Spark, and workload logs persist after a
workload finishes. Serverless for Apache Spark collects workload logs in Cloud Logging.
You can access Serverless for Apache Spark logs under the
Cloud Dataproc Batch resource in the Logs Explorer.
Query Serverless for Apache Spark logs
The Logs Explorer in the Google Cloud console provides a query pane to help you build a query to examine batch workload logs. Here are steps you can follow to build a query to examine batch workload logs:
- Your current project is selected. You can click Refine scope Project to select a different project.
Define a batch logs query.
Use filter menus to filter for a batch workload.
Under All resources, select the Cloud Dataproc Batch resource.
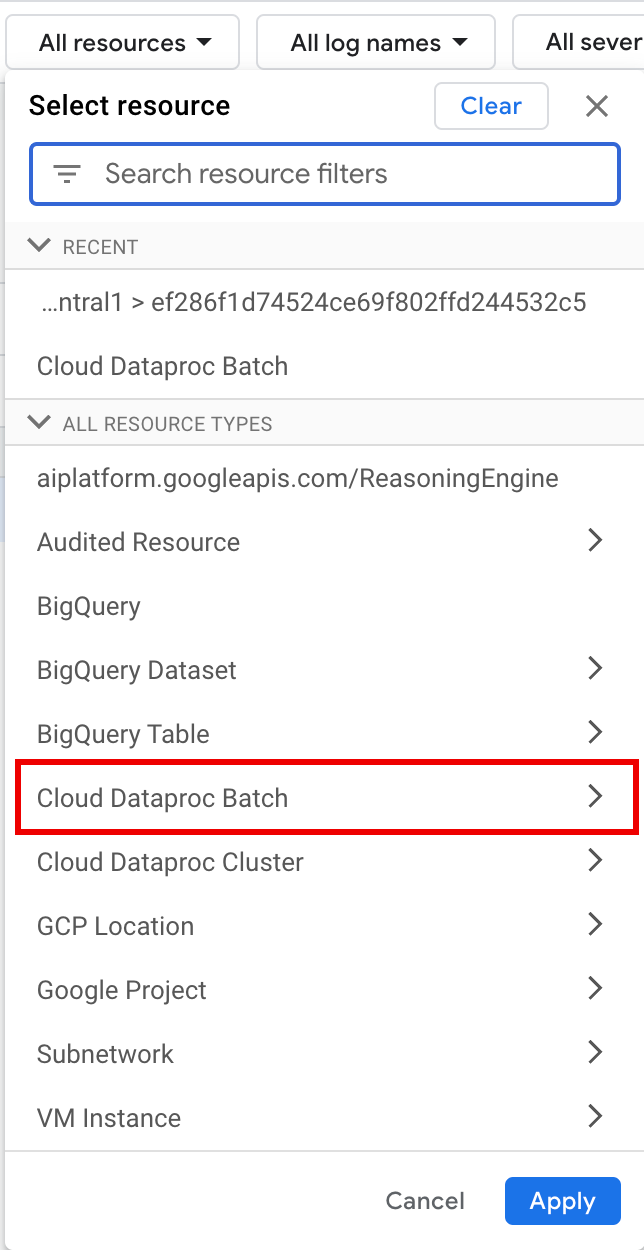
In the Select resource panel, select the batch LOCATION, then the BATCH ID. These batch parameters are listed on the Dataproc Batches page in the Google Cloud console.
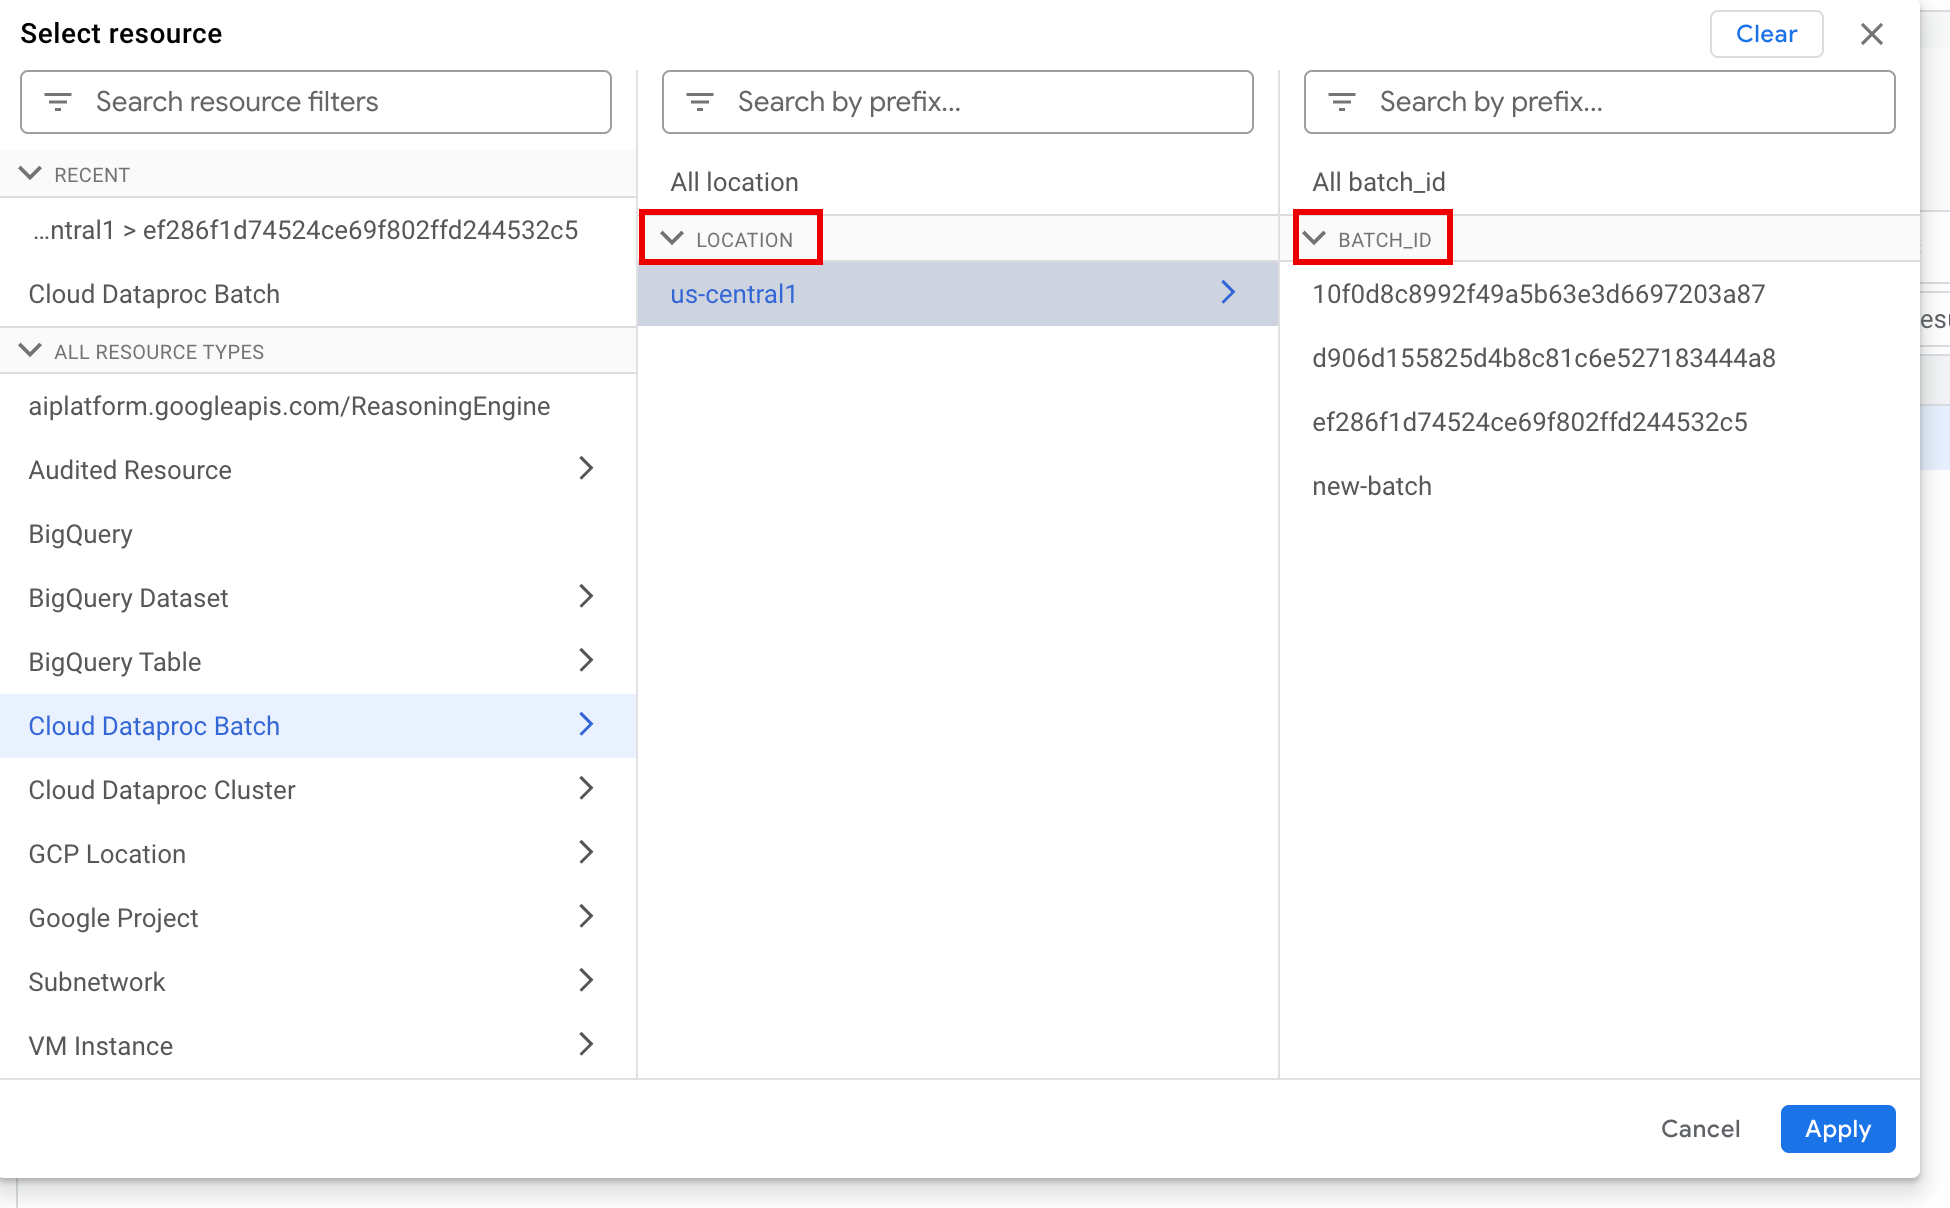
Click Apply.
Under Select log names. enter
dataproc.googleapis.comin the Search log names box to limit the log types to query. Select one or more of the listed log file names.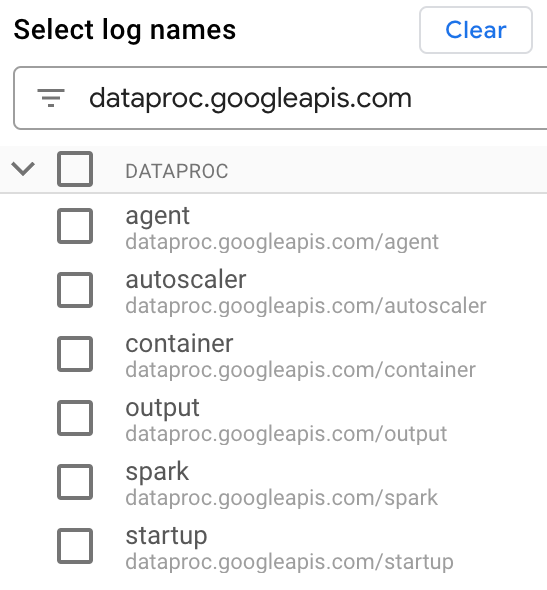
Use the query editor to filter for VM-specific logs.
Specify the resource type and VM resource name as shown in the following example:
resource.type="cloud_dataproc_batch"
labels."dataproc.googleapis.com/resource_name"="gdpic-srvls-batch-BATCH_UUID-VM_SUFFIX"
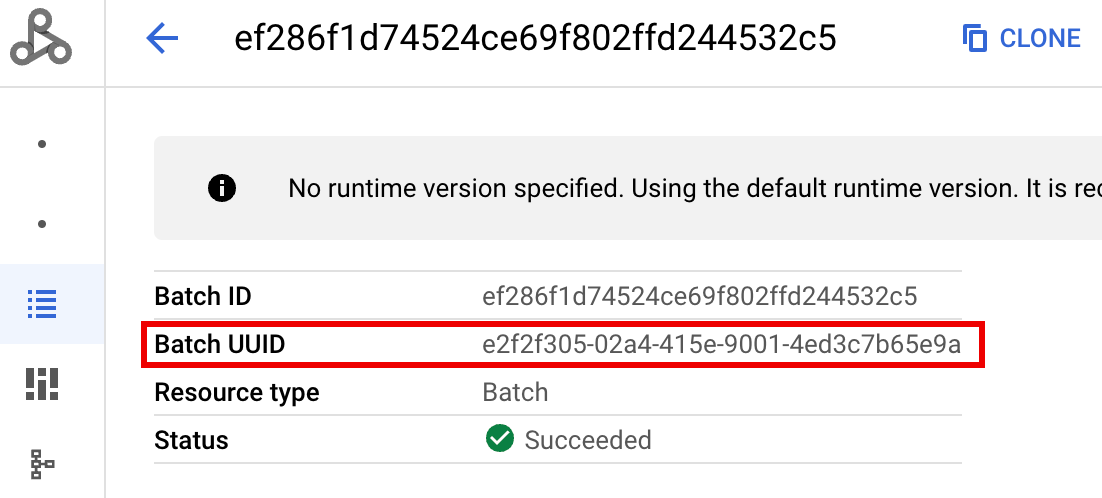
- BATCH_UUID: The batch UUID is listed in the Batch details
page in the Google Cloud console, which opens when you click the
Batch ID on the Batches page.
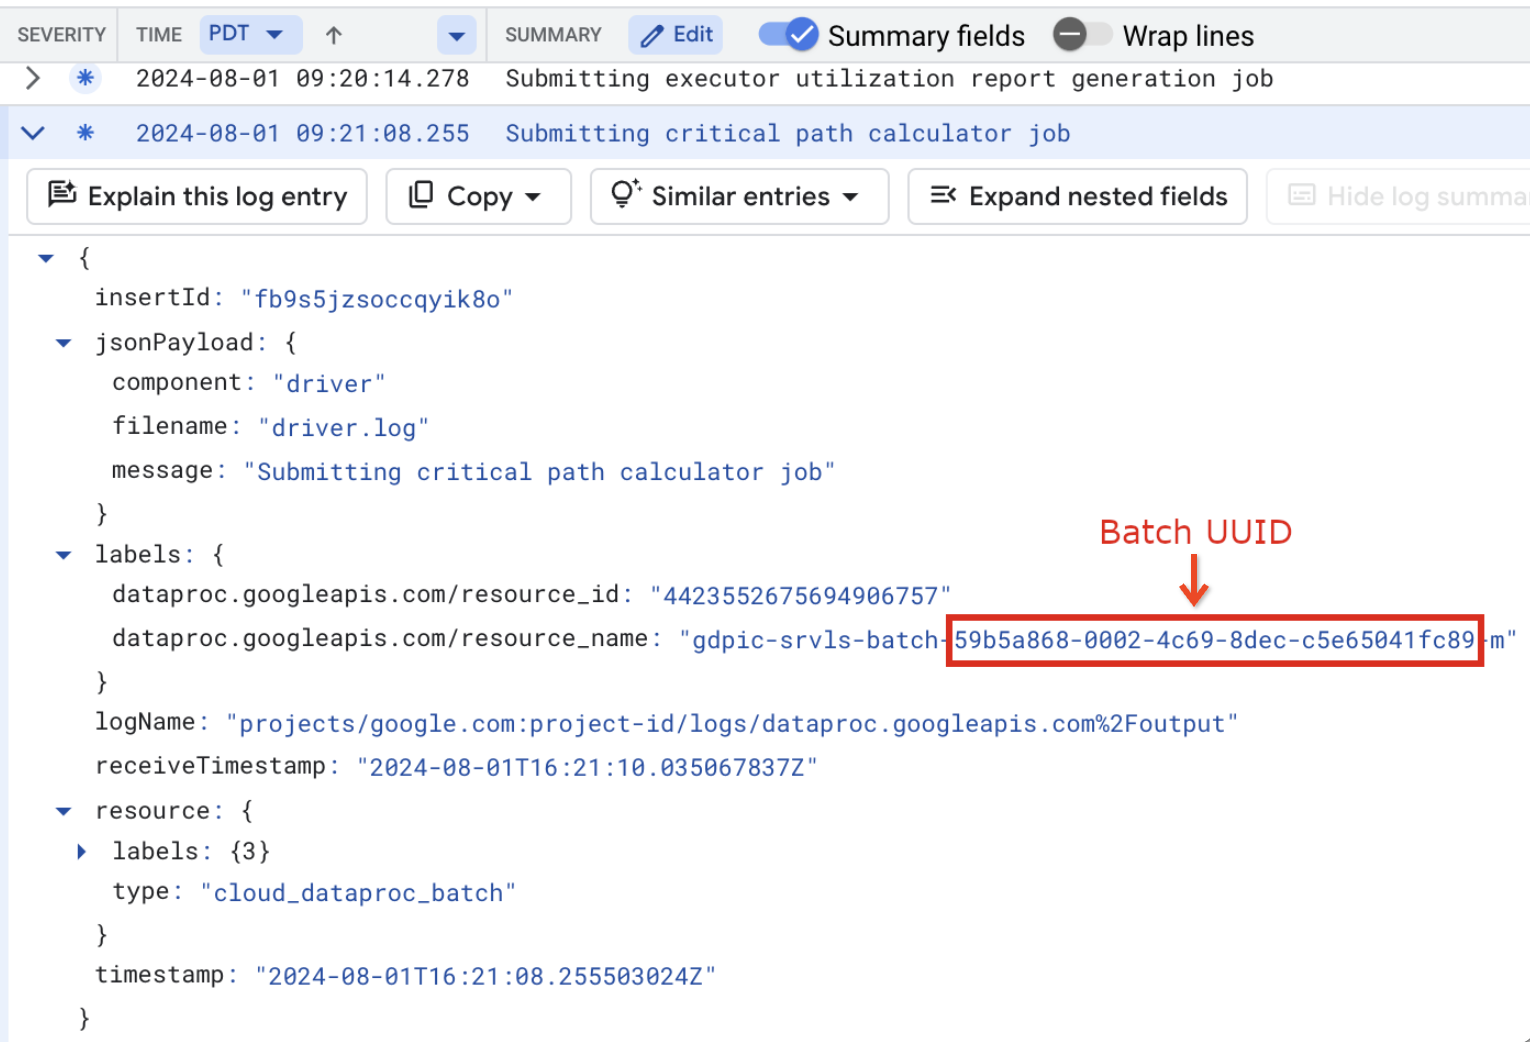
The batch logs also list the batch UUID in the VM resource name. Here's an example from a batch driver.log:
- BATCH_UUID: The batch UUID is listed in the Batch details
page in the Google Cloud console, which opens when you click the
Batch ID on the Batches page.
Click Run query.
Serverless for Apache Spark log types and sample queries
The following list describes different Serverless for Apache Spark log types and provides sample Logs Explorer queries for each log type.
dataproc.googleapis.com/output: This log file contains batch workload output. Serverless for Apache Spark streams batch output to theoutputnamespace, and sets the filename toJOB_ID.driver.log.Sample Logs Explorer query for output logs:
resource.type="cloud_dataproc_batch"
resource.labels.location="REGION"
resource.labels.batch_id="BATCH_ID"
logName="projects/PROJECT_ID/logs/dataproc.googleapis.com%2Foutput"
dataproc.googleapis.com/spark: Thesparknamespace aggregates Spark logs for daemons and executors running on Dataproc cluster master and worker VMs. Each log entry includes amaster,workerorexecutorcomponent label to identify the log source, as follows:executor: Logs from user-code executors. Typically, these are distributed logs.master: Logs from the Spark standalone resource manager master, which are similar to Dataproc on Compute Engine YARNResourceManagerlogs.worker: Logs from the Spark standalone resource manager worker, which are similar to Dataproc on Compute Engine YARNNodeManagerlogs.
Sample Logs Explorer query for all logs in the
sparknamespace:resource.type="cloud_dataproc_batch" resource.labels.location="REGION" resource.labels.batch_id="BATCH_ID" logName="projects/PROJECT_ID/logs/dataproc.googleapis.com%2Fspark"
Sample Logs Explorer query for Spark standalone component logs in the
sparknamespace:resource.type="cloud_dataproc_batch" resource.labels.location="REGION" resource.labels.batch_id="BATCH_ID" logName="projects/PROJECT_ID/logs/dataproc.googleapis.com%2Fspark" jsonPayload.component="COMPONENT"
dataproc.googleapis.com/startup: Thestartupnamespace includes the batch (cluster) startup logs. Any initialization script logs are included. Components are identified by label, for example:startup-script[855]: ... activate-component-spark[3050]: ... enable spark-worker
resource.type="cloud_dataproc_batch"
resource.labels.location="REGION"
resource.labels.batch_id="BATCH_ID"
logName="projects/PROJECT_ID/logs/dataproc.googleapis.com%2Fstartup"
labels."dataproc.googleapis.com/resource_name"="gdpic-srvls-batch-BATCH_UUID-VM_SUFFIX"
dataproc.googleapis.com/agent: Theagentnamespace aggregates Dataproc agent logs. Each log entry includes filename label that identifies the log source.Sample Logs Explorer query for agent logs generated by a specified worker VM:
resource.type="cloud_dataproc_batch"
resource.labels.location="REGION"
resource.labels.batch_id="BATCH_ID"
logName="projects/PROJECT_ID/logs/dataproc.googleapis.com%2Fagent"
labels."dataproc.googleapis.com/resource_name"="gdpic-srvls-batch-BATCHUUID-wWORKER#"
dataproc.googleapis.com/autoscaler: Theautoscalernamespace aggregates Serverless for Apache Spark autoscaler logs.Sample Logs Explorer query for agent logs generated by a specified worker VM:
resource.type="cloud_dataproc_batch"
resource.labels.location="REGION"
resource.labels.batch_id="BATCH_ID"
logName="projects/PROJECT_ID/logs/dataproc.googleapis.com%2Fautoscaler"
labels."dataproc.googleapis.com/resource_name"="gdpic-srvls-batch-BATCHUUID-wWORKER#"
For more information, see Dataproc logs.
For information on Serverless for Apache Spark audit logs, see Dataproc audit logging.
Workload metrics
Serverless for Apache Spark provides batch and Spark metrics that you can view from the Metrics Explorer or the Batch details page in the Google Cloud console.
Batch metrics
Dataproc batch resource metrics provide insight into batch resources,
such as the number of batch executors. Batch metrics are prefixed with
dataproc.googleapis.com/batch.
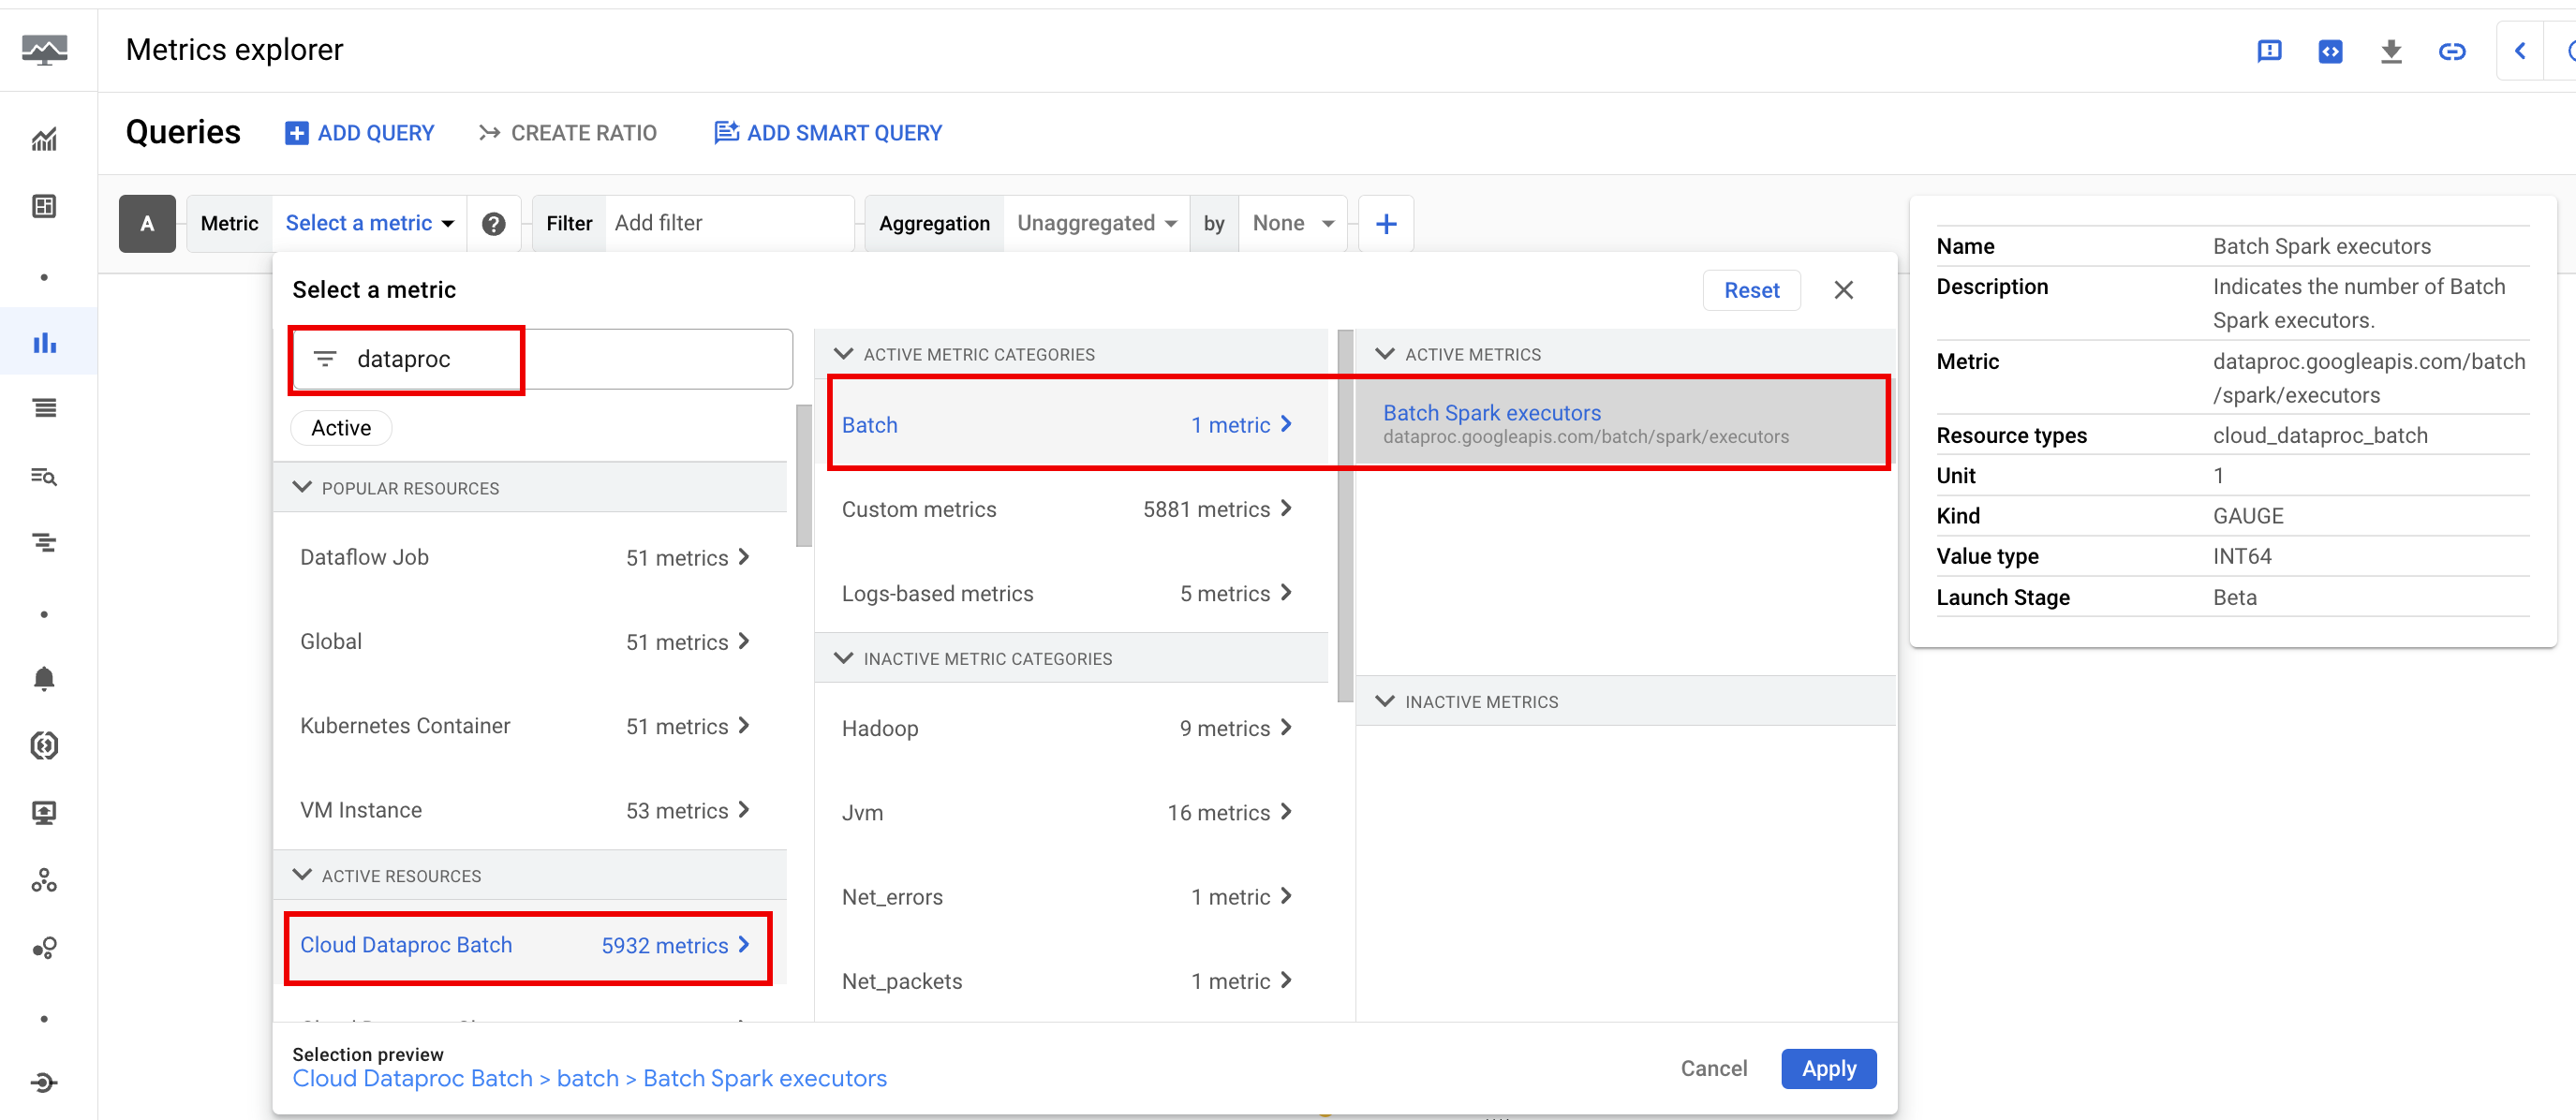
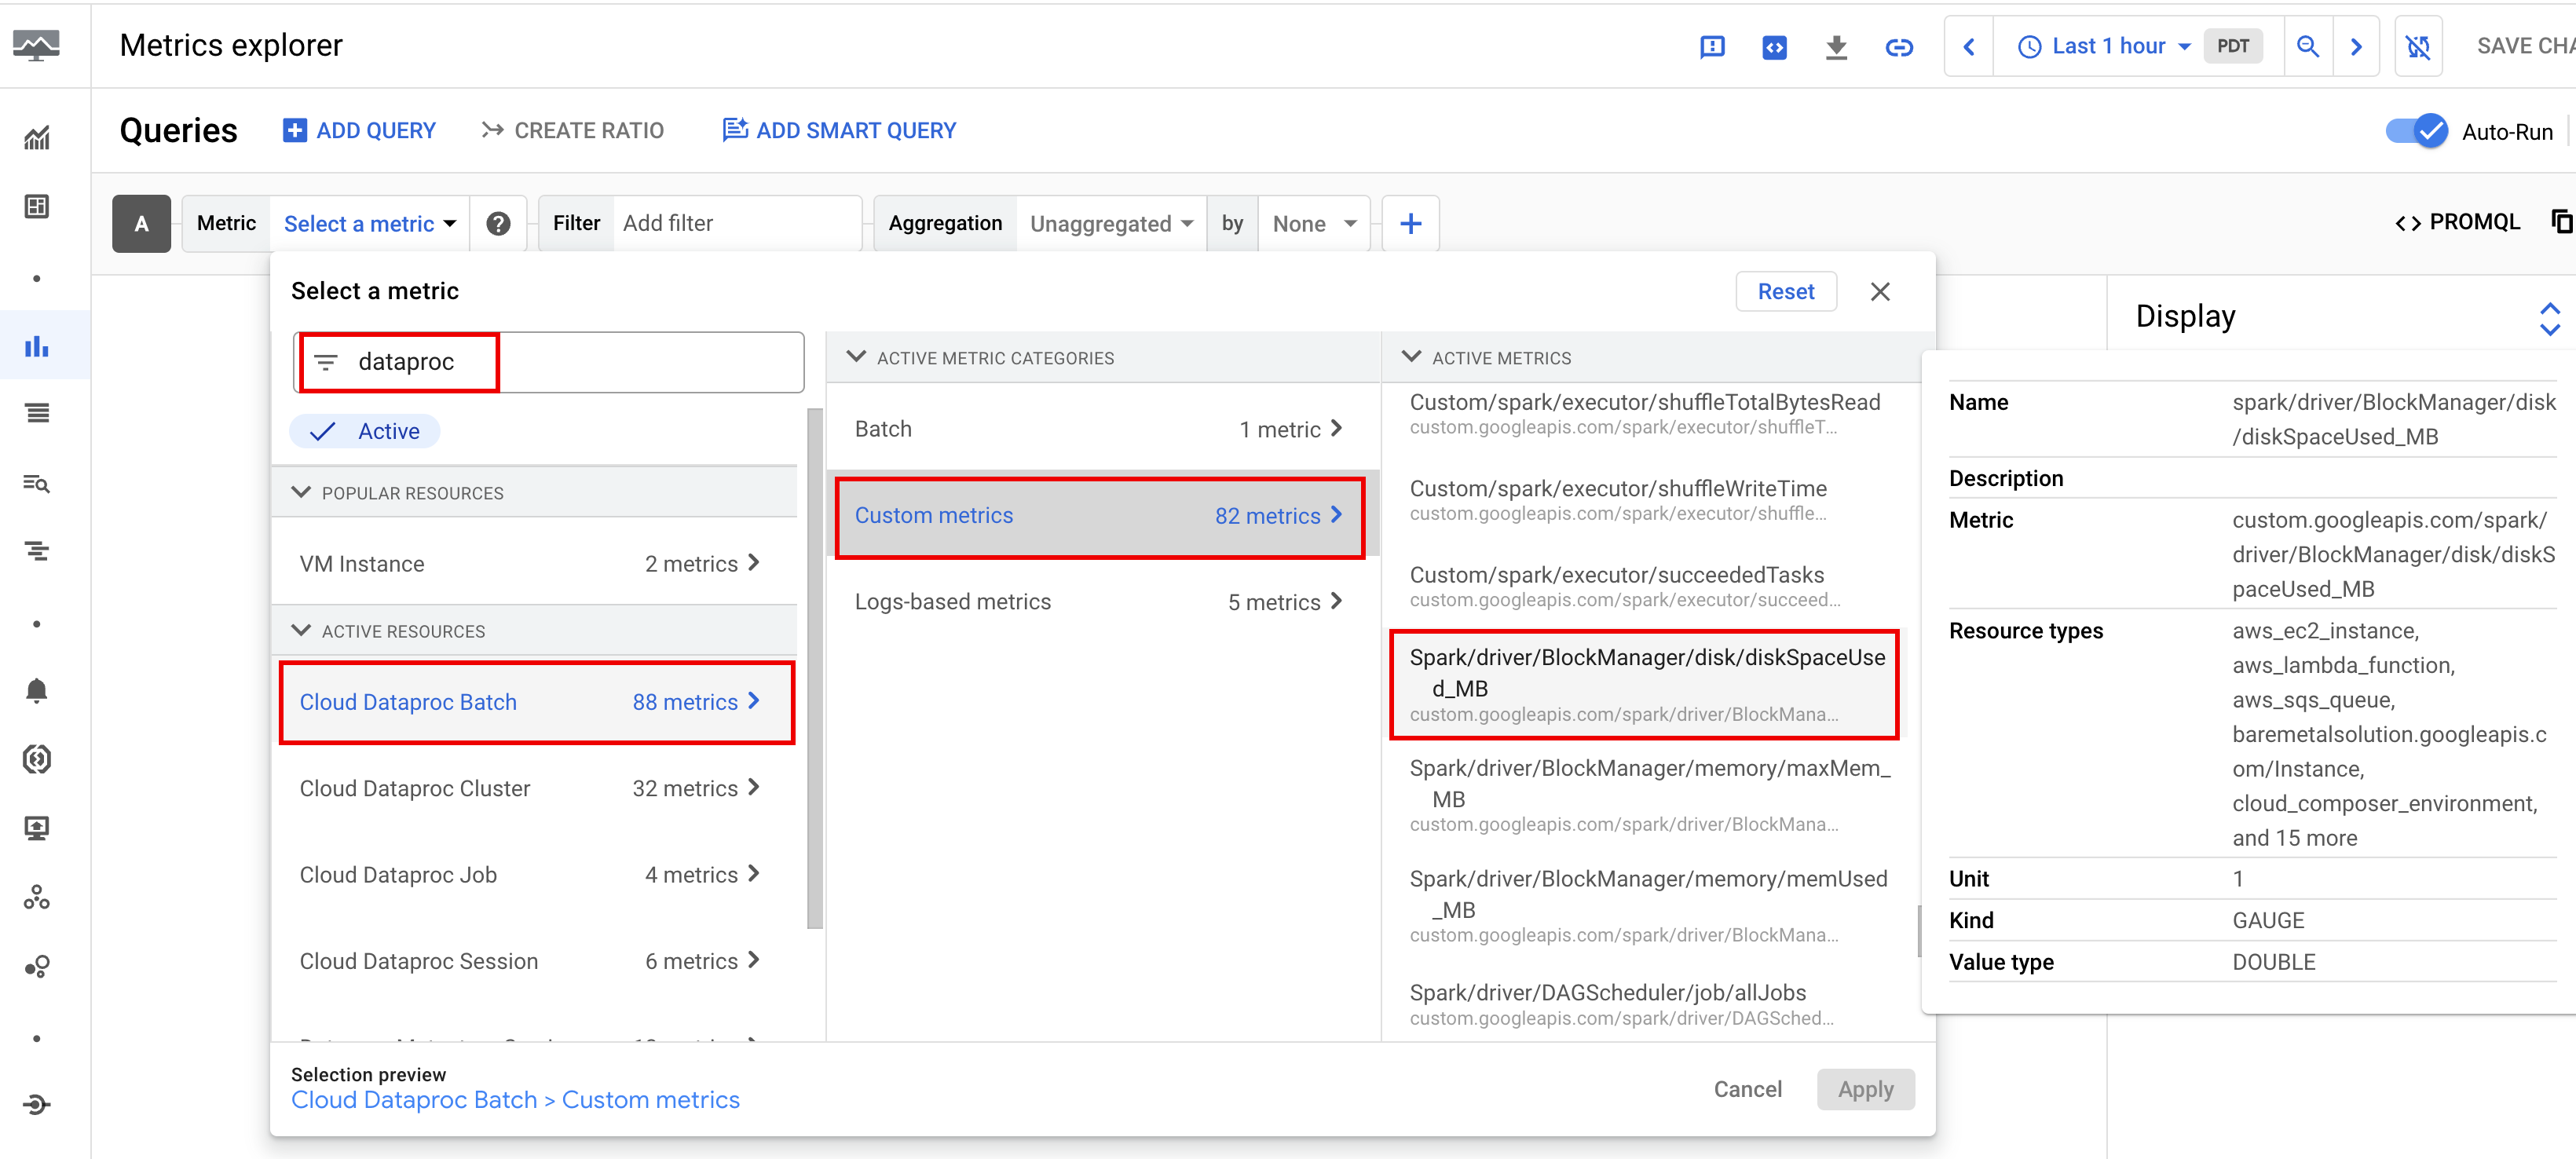
Spark metrics
By default, Serverless for Apache Spark enables the collection of available Spark metrics, unless you use Spark metrics collection properties to disable or override the collection of one or more Spark metrics.
Available Spark metrics
include Spark driver and executor metrics, and system metrics. Available Spark metrics are prefixed
with custom.googleapis.com/.
Set up metric alerts
You can create Dataproc metric alerts to receive notice of workload issues.
Create charts
You can create charts that visualize workload metrics by using the
Metrics Explorer in the
Google Cloud console. For example, you can
create a chart to display disk:bytes_used, and then filter by batch_id.
Cloud Monitoring
Monitoring uses workload metadata and metrics to provide insights into the health and performance of Serverless for Apache Spark workloads. Workload metrics include Spark metrics, batch metrics, and operation metrics.
You can use Cloud Monitoring in the Google Cloud console to explore metrics, add charts, create dashboards, and create alerts.
Create dashboards
You can create a dashboard to monitor workloads using metrics from multiple projects and different Google Cloud products. For more information, see Create and manage custom dashboards.
Persistent History Server
Serverless for Apache Spark creates the compute resources that are needed to run a workload, runs the workload on those resources, and then deletes the resources when the workload finishes. Workload metrics and events don't persist after a workload completes. However, you can use a Persistent History Server (PHS) to retain workload application history (event logs) in Cloud Storage.
To use a PHS with a batch workload, do the following:
Specify your PHS when you submit a workload.
Use the Component Gateway to connect to the PHS to view application details, scheduler stages, task level details, and environment and executor information.
Autotuning
- Enable autotuning for Serverless for Apache Spark: You can enable Autotuning for Serverless for Apache Spark when you submit each recurring Spark batch workload using the Google Cloud console, gcloud CLI, or the Dataproc API.
Console
Perform the following steps to enable autotuning on each recurring Spark batch workload:
In the Google Cloud console, go to the Dataproc Batches page.
To create a batch workload, click Create.
In the Container section, fill in the Cohort name, which identifies the batch as one of a series of recurring workloads. Gemini-assisted analysis is applied to the second and subsequent workloads that are submitted with this cohort name. For example, specify
TPCH-Query1as the cohort name for a scheduled workload that runs a daily TPC-H query.Fill in other sections of the Create batch page as needed, then click Submit. For more information, see Submit a batch workload.
gcloud
Run the following gcloud CLI
gcloud dataproc batches submit
command locally in a terminal window or in Cloud Shell
to enable autotuning on each recurring Spark batch workload:
gcloud dataproc batches submit COMMAND \
    --region=REGION \
    --cohort=COHORT \
    other arguments ...
Replace the following:
- COMMAND: the Spark workload type, such as
Spark,PySpark,Spark-Sql, orSpark-R. - REGION: the region where your workload will run.
- COHORT: the cohort name, which
identifies the batch as one of a series of recurring workloads.
Gemini-assisted analysis is applied to the second and subsequent workloads that are submitted
with this cohort name. For example, specify
TPCH Query 1as the cohort name for a scheduled workload that runs a daily TPC-H query.
API
Include the RuntimeConfig.cohort
name in a batches.create
request to enable autotuning on each recurring Spark
batch workload. Autotuning is applied to the second and subsequent workloads submitted with this cohort name. For example, specify TPCH-Query1 as the cohort name for a scheduled workload that runs a daily TPC-H query.
Example:
...
runtimeConfig:
  cohort: TPCH-Query1
...