Cloud Composer 3 | Cloud Composer 2 | Cloud Composer 1
This page describes how to access and use the monitoring dashboard for a Cloud Composer environment.
For more information about specific metrics, see Monitor environments with Cloud Monitoring.
For a tutorial on monitoring key environment metrics, see Monitor environment health and performance with key metrics.
Access the monitoring dashboard
The monitoring dashboard contains metrics and charts for monitoring trends in the DAG runs in your environment, and identifing issues with Airflow components and Cloud Composer resources.
To access the monitoring dashboard for your environment:
In the Google Cloud console, go to the Environments page.
In the list of environments, click the name of your environment. The Environment details page opens.
Go to the Monitoring tab.
Set up alerts for metrics
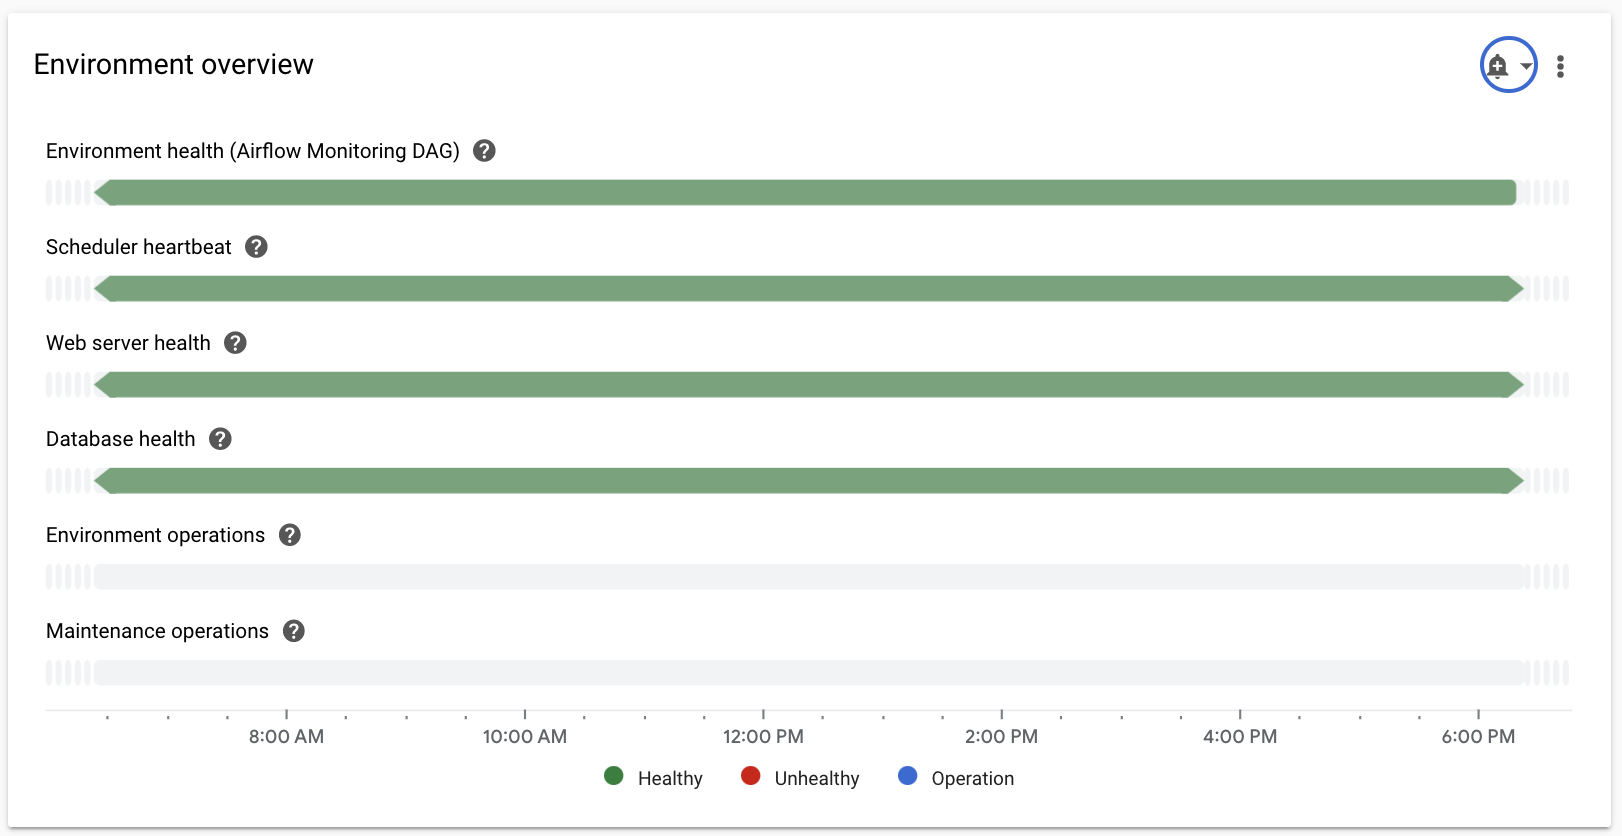
You can set up alerts for a metric by clicking the bell icon in the corner of the monitoring card.

View a metric in Monitoring
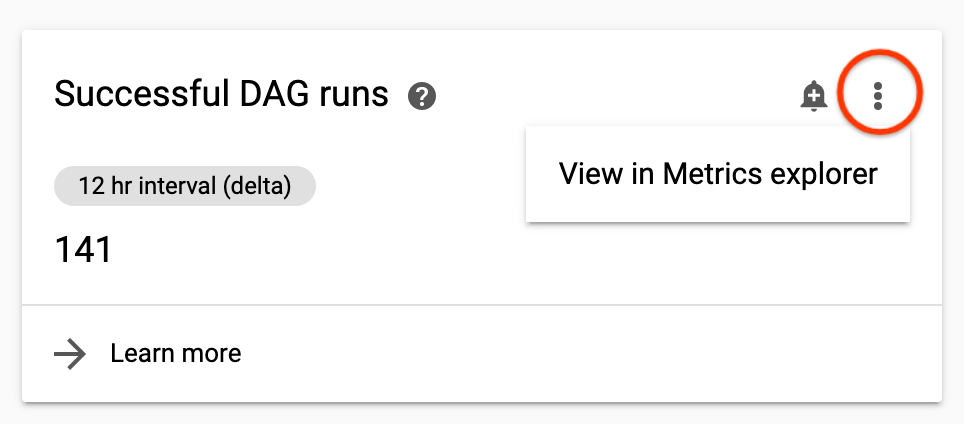
You can get a closer look at a metric by viewing it in Monitoring.
To navigate there from the Cloud Composer monitoring dashboard, click the three dots in the upper-right corner of a metric card and select View in Metrics explorer.

Metric descriptions
Each Cloud Composer environment has its own monitoring dashboard. Metrics displayed on a monitoring dashboard for a particular environment only track the DAG runs, Airflow components, and environment details for this environment only. For example, if you have two environments, the dashboard does not aggregate metrics from both environments.
Environment overview
| Environment metric | Description |
|---|---|
| Environment health (Airflow monitoring DAG) | A timeline showing the health of the Composer deployment. Green status only reflects the status of the Composer deployment. It doesn't mean that all Airflow components are operational and DAGs are able to run. |
| Scheduler heartbeat | A timeline showing the Airflow scheduler's heartbeat. Check for red areas to identify Airflow scheduler issues. If your environment has more than one scheduler, then the heartbeat status is healthy as long as at least one of schedulers is responding. |
| Web server health | A timeline showing the status of the Airflow web server. This status is generated based on HTTP status codes returned by the Airflow web server. |
| Database health | A timeline showing the status of the connection to the Cloud SQL instance that hosts the Airflow DB. |
| Environment operations | A timeline showing operations that modify the environment, such as performing configuration updates or loading environment snapshots. |
| Maintenance operations | A timeline showing periods when maintenance operations are performed on the environment's cluster. |
| Environment dependencies | A timeline showing the status of reachability and permissions checks for the environment's operation. |
DAG statistics
| Environment metric | Description |
|---|---|
| Successful DAG runs | The total number of successful runs for all DAGs in the environment during the selected time range. If the number of successful DAG runs drops below expected levels, this might indicate failures (see Failed DAG runs) or a scheduling issue. |
| Failed DAG runs Failed tasks | The total number of failed runs for all DAGs in the environment during the selected time range. The total number of tasks that failed in the environment during the selected time range. Failed tasks don't always cause a DAG run to fail, but they can be a useful signal for troubleshooting DAG errors. |
| Completed DAG runs | The number of DAG successes and failures for intervals in the selected time range. This can help to identify transient issues with DAG runs and correlate them with other events, like Worker Pod evictions. |
| Completed tasks | The number of tasks completed in the environment with a breakdown of successful and failed tasks. |
| Median DAG run duration | The median duration of DAG runs. This chart can help to identify performance problems and spot trends in DAG duration. |
| Airflow tasks | The number of tasks in running, queued or deferred state at a given time. Airflow tasks are tasks that are in a queued state in Airflow, they can go either to Celery or Kubernetes Executor broker queue. Celery queued tasks are task instances that are put into the Celery broker queue. |
| Zombie tasks killed | The number of zombie tasks killed in a small time window. Zombie tasks are often caused by the external termination of Airflow processes. The Airflow scheduler kills zombie tasks periodically, which is reflected in this chart. |
| DAG bag size | The number of DAGs deployed to the bucket of your environment and processed by Airflow at a given time. This can be helpful when analyzing performance bottlenecks. For example, an increased number of DAG deployments may degrade performance because of excessive load. |
| DAG processor errors | The number of errors and timeouts per second that were encountered while processing DAG files. The value indicates the frequency of errors reported by the DAG processor (it is a different value than the number of failed DAGs). |
| Total parse time for all DAGs | A chart showing the total time required for Airflow to process all DAGs in the environment. Increased parsing time can affect scheduling efficiency. See Difference between DAG parse time and DAG execution time for more information. |
Scheduler statistics
| Environment metric | Description |
|---|---|
| Scheduler hearbeat | See Environment overview. |
| Total scheduler CPU usage | The total usage of vCPU cores by containers running in all Airflow scheduler pods, and the combined vCPU limit for all schedulers. |
| Total scheduler memory usage | The total usage of memory by containers running in all Airflow scheduler pods, and the combined vCPU limit for all schedulers. |
| Total scheduler disk usage | The total usage of disk space by containers running in all Airflow scheduler pods, and the combined disk space limit for all schedulers. |
| Scheduler container restarts | The total number of restarts for individual scheduler containers. |
| Scheduler Pod evictions | Number of Airflow scheduler Pod evictions. Pod eviction can happen when a particular Pod in your environment's cluster reaches its resource limits. |
Worker statistics
| Environment metric | Description |
|---|---|
| Total worker CPU usage | The total usage of vCPU cores by containers running in all Airflow worker pods, and the combined vCPU limit for all workers. |
| Total worker memory usage | The total usage of memory by containers running in all Airflow worker pods, and the combined vCPU limit for all workers. |
| Total worker disk usage | The total usage of disk space by containers running in all Airflow worker pods, and the combined disk space limit for all workers. |
| Active workers | The current number of workers in your environment. In Cloud Composer 2, your environment automatically scales the number of active workers. |
| Worker container restarts | The total number of restarts for individual worker containers. |
| Worker Pod evictions | Number of Airflow worker Pod evictions. Pod eviction can happen when a particular Pod in your environment's cluster reaches its resource limits. If an Airflow worker Pod is evicted, all task instances running on that Pod are interrupted, and later marked as failed by Airflow. |
| Airflow tasks | See Environment overview. |
| Unacknowledged Celery tasks |
The number of unacknowledged tasks in the Celery broker queue. Unacknowledged tasks include Airflow task instances in the queued and running task states. Both states are normal to Airflow task's execution. The Unacknowledged Celery tasks graph will output tasks in these states as unacknowledged while they are processed by Airflow. If an Airflow task instance is abnormally interrupted (for example, detected as a zombie), it will also remain unacknowledged until the visibility_timeout is reached. In this case, the graph will display a task that consistently stays unacknowledged for a long time. The visibility timeout value is set to 7 days in Cloud Composer. After this period of time, the task will be redelivered and will have a possibility to be acknowledged. If it fails again, it might stay unacknowledged for another 7 days. |
| Celery broker publishing timeouts |
The total number of AirflowTaskTimeout errors raised when publishing tasks to Celery Brokers. This metric corresponds to the celery.task_timeout_error Airflow metric. |
| Celery execute command failures |
The total number of non-zero exit codes from Celery tasks. This metric corresponds to the celery.execute_command.failure Airflow metric. |
| System terminated tasks | The number of workflow tasks where the task runner got terminated with a SIGKILL (for example due to worker memory or heartbeat issues). |
Triggerer statistics
| Environment metric | Description |
|---|---|
| Deferred tasks | The number of tasks that are in the deferred state at a given time. For more information about deferred tasks, see Use deferrable operators |
| Completed triggers | The number of triggers completed in all triggerer pods. |
| Running triggers | The number of triggers running per triggerer instance. This chart shows separate lines for every triggerer. |
| Blocking triggers | Number of triggers that blocked the main thread (likely because of not being fully asynchronous). |
| Total triggerers CPU usage | The total usage of vCPU cores by containers running in all Airflow triggerer pods, and the combined vCPU limit for all triggerers. |
| Total triggerers memory usage | The total usage of memory by containers running in all Airflow triggerer pods, and the combined vCPU limit for all triggerers. |
| Total triggerers disk usage | The total usage of disk space by containers running in all Airflow triggerer pods, and the combined disk space limit for all triggerers. |
| Active triggerers | The number of active triggerer instances. |
| Triggerer container restars | The number of triggerer container restarts. |
Web server statistics
| Environment metric | Description |
|---|---|
| Web server health | See Environment overview. |
| Web server CPU usage | The total usage of vCPU cores by containers running in all Airflow web server Pods , and the combined vCPU limit for all web servers. |
| Web server memory usage | The total usage of memory by containers running in all Airflow web server Pods , and the combined vCPU limit for all web servers. |
| Total web server disk usage | The total usage of disk space by containers running in all Airflow web server Pods , and the combined disk space limit for all web servers. |
SQL database statistics
| Environment metric | Description |
|---|---|
| Database health | See Environment overview. |
| Database CPU usage | The usage of CPU cores by the Cloud SQL database instances of your environment. |
| Database memory usage | The total usage of memory by the Cloud SQL database instances of your environment. |
| Database disk usage | The total usage of disk space by the Cloud SQL database instances of your environment. This metric applies to the Cloud SQL database instance itself, so the metric doesn't decrease when the Airflow database size is reduced. For a metric that shows the size of the contents of the Airflow database, see Airflow metadata database size. |
| Airflow metadata database size | Size of the Airflow metadata database. This metric applies to the Airflow component of your environment and shows the amount of disk space taken by the Airflow metadata database on the Cloud SQL database instance. This metric decreases when the Airflow metadata database size is reduced (for example, after the Airflow database maintenance) and determines if it's possible to create snapshots and upgrade environments. This metric is different from the Database disk usage metric, which shows the amount of disk space used by the Cloud SQL database instances. |
| Database connections | The total number of active connections to the database, and the total connections limit. |
Difference between DAG parse time and DAG execution time
The monitoring dashboard of an environment displays the total time required to parse all DAGs in your Cloud Composer environment and the average time it takes to execute a DAG.
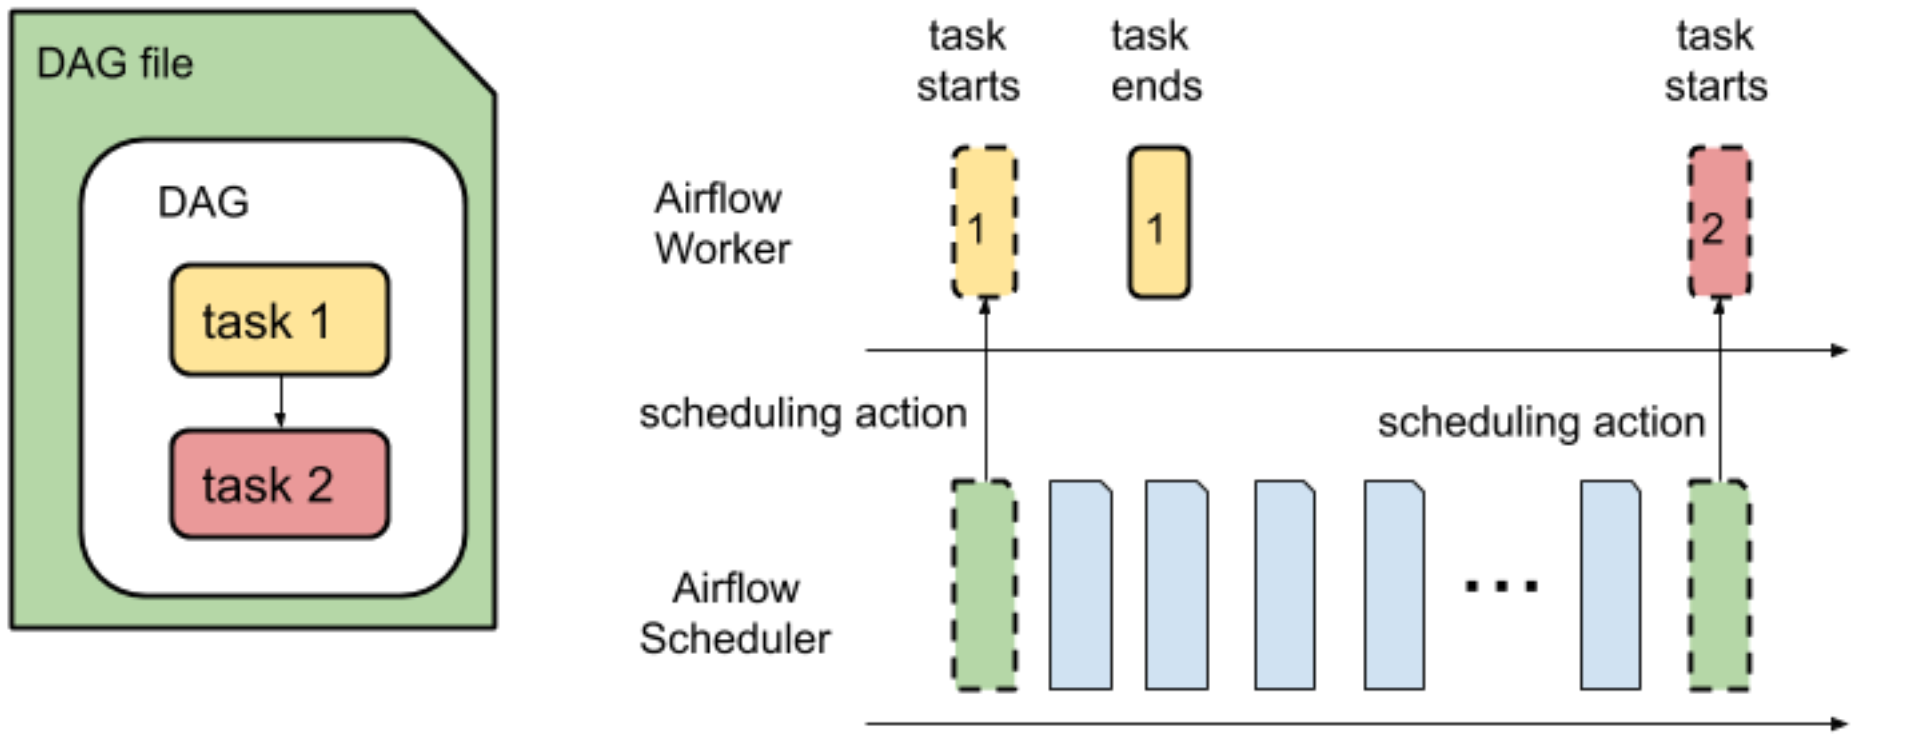
Parsing a DAG and scheduling tasks from a DAG for execution are two separate operations performed by the Airflow scheduler.

DAG parse time is the amount of time it takes for the Airflow Scheduler to read a DAG file and parse it.
Before the Airflow scheduler can schedule any task from a DAG, the scheduler must parse the DAG file to discover the structure of the DAG and defined tasks. After the DAG file is parsed, the scheduler can start scheduling tasks from the DAG.
DAG execution time is the sum of all task execution times for a DAG.
To see how long it takes to execute a particular Airflow task from a DAG, in the Airflow web interface, select a DAG and open the Task duration tab. This tab displays task execution times for the specified number of last DAG runs.
