You can combine Cloud Billing data export to BigQuery with Looker Studio to stay up to date on your Google Cloud costs.
This document shows you how to set up the Billing usage and cost insights dashboard with your Cloud Billing data. You can use the dashboard to answer questions about your Google Cloud spend, such as How much am I spending on Compute Engine resources?, and Which environments are costing me the most?.
You can set up your dashboard by following this tutorial, or watching the following video:
Objectives
This tutorial shows you how to complete the following tasks:
Set up your own copy of the Billing usage and cost insights dashboard using Cloud Shell.
You can use either Terraform or Python to follow the steps in this tutorial.
Configure the dashboard's filters to use the labels that you use in your Google Cloud environment.
Learn about modifying the dashboard's data source for advanced cases, such as if you have multiple Cloud Billing accounts, or a Cloud Billing account in a currency other than US Dollars (USD).
Costs
In this document, you use the following billable components of Google Cloud:
The cost of storing your Cloud Billing data in BigQuery is typically free or minimal. Depending on the size of the BigQuery dataset, you might incur costs for querying the data for analysis.
To generate a cost estimate based on your projected usage,
use the pricing calculator.
Before you begin
Ensure that you can access the sample Billing usage and cost insights dashboard. If you can't access the sample, your organization might have domain restrictions enabled. Your administrator can temporarily turn off domain restriction for your account.
Verify that your organization has enabled the Cloud Billing export to BigQuery, for the Standard usage cost data.
If the Cloud Billing data export isn't enabled, learn about enabling the Cloud Billing data export to BigQuery.
You must have permissions to create BigQuery views in the project that hosts the datasets for your Cloud Billing data export.
Optionally, if you want to create a new dataset for the BigQuery views, you must have permissions to create BigQuery datasets.
Get the following information about your Google Cloud environment:
- The project ID where your Cloud Billing BigQuery dataset is hosted.
- The dataset names for your Standard and Detailed cost data exports. Typically, the cost data exports are in the same dataset.
If you're sharing the dashboard with others in your organization, we recommend the following additional steps. These help you set up a Google Cloud service account, which can authenticate to the BigQuery data instead of requiring others to either use your credentials or their own to access the data.
Get the email address for the Looker Studio service agent from the Looker Studio service agent help page.
If you're using the Python script to create the dashboard, create a service account for the Looker Studio service agent.
If you're using Terraform, you don't need to create the service account manually. The Terraform configuration creates the service account when you apply the configuration.
If you're using the Python script, ensure that your Cloud Shell environment has a recent version of Python 3. To check Python version, in the Cloud Shell terminal, type
python --versionand press Enter.
Create your copy of the dashboard
Terraform
To create your own copy of the dashboard using Terraform, you first clone the GitHub repository that automates the process. This step uses Cloud Shell, which is an interactive shell environment for Google Cloud that you can use from your browser. Cloud Shell comes with Terraform pre-installed.
At a high level, the Terraform configuration in the repository does these tasks:
- Creates a new BigQuery view that fetches data from your Standard cost data export.
- Copies the dashboard template and connects the copy to the BigQuery view of your data.
- Gives you a Looker Studio link to your copy, which you can save to your Looker Studio dashboards.
- Gives you a Google Cloud service account ID, which you use as the authentication method for the dashboard.
Follow these steps to create your dashboard:
Open the GitHub repository in Cloud Shell:

Create a Terraform variable definitions file, with the information about your project and BigQuery dataset. Use the following command to create the file, called
variables.tfvars:cat << EOF > variables.tfvars project-id = "PROJECT_ID" bq-dashboard-dataset-name = "DATASET_NAME" bq-billing-export-table-id = "PROJECT_ID.DATASET_NAME.TABLE_ID" looker-studio-service-agent-name = "LOOKER_STUDIO_AGENT_NAME" EOFWhere the variables are as follows:
- PROJECT_ID: The project ID that hosts your Cloud Billing dataset.
- DATASET_NAME: The BigQuery dataset that contains your Standard cost data export.
- TABLE_ID: The name for the BigQuery table that contains the Standard billing data export.
- LOOKER_STUDIO_AGENT_NAME: The email address for the Looker Studio service agent, which you get from the Looker Studio service agent help page
To initialize the GitHub repository as the Terraform working directory, run the following command:
terraform initOptionally, to preview the changes that the Terraform configuration makes, run the following
terraform plancommand:terraform plan -var-file=variables.tfvarsYou might be prompted to authorize Cloud Shell to make API calls on your behalf.
Review the Terraform changes, and edit
variables.tfvarsif you need to change any variable values. When you're ready to create the resources, run the followingterraform applycommand:terraform apply -var-file=variables.tfvarsAfter the command runs, you get the service account that was created for authentication, and the link to your Looker Studio dashboard.
Copy the service account name. You need this information when you configure authentication for the Looker Studio data source.
Click the Looker Studio link to open the dashboard.
In Looker Studio, click Edit and share to save the dashboard. When you're prompted to review data access settings, click Acknowledge and save.
If you're prompted about adding data to the report, click Add to report.
You can now access your dashboard from your Looker Studio home page.
Python
To create your own copy of the dashboard using Python, you first clone the GitHub repository that automates the process. This step uses Cloud Shell, which is an interactive shell environment for Google Cloud that you can use from your browser.
At a high level, the setup script in the repository does these tasks:
- Creates a new BigQuery view in the dataset that has your Standard cost data export.
- Copies the dashboard template and connects the copy to the BigQuery view of your data.
- Gives you a Looker Studio link to your copy, which you can save to your Looker Studio dashboards.
Follow these steps to create your dashboard:
Open the GitHub repository in Cloud Shell:
Navigate to the
billboarddirectory:cd examples/billboardRun the following commands to set up the Python environment for the script:
rm -rf bill-env
python3 -m venv bill-env
source bill-env/bin/activate
pip install -r requirements.txt
Run the script that creates your dashboard. You might need to authorize Cloud Shell to make API calls on your behalf:
python billboard.py \
  -pr 'PROJECT_ID' \
  -se 'STANDARD_BILLING_EXPORT_DATASET' \
  -bb 'BILLBOARD_DATASET'
Where the variables are as follows:
- PROJECT_ID: The project ID that hosts your Cloud Billing datasets.
- STANDARD_BILLING_EXPORT_DATASET: The BigQuery dataset that contains your Standard usage cost data export.
- BILLBOARD_DATASET: The name for the
BigQuery dataset where the BigQuery view
for the dashboard is created, for example,
example_dashboard_view. If you don't already have a dataset for the views, the script creates a new one with this name.
When the script finishes running, you get a Looker Studio link to your dashboard.
Click the Looker Studio link to open the dashboard.
In Looker Studio, click Edit and share to save the dashboard. When you're prompted to add data sources to the report, click Add to report.
You can now access your dashboard from your Looker Studio home page.
(Optional) Configure the data source credentials
By default, the Billing usage dashboard uses your credentials to access the BigQuery data source. If you want to share the dashboard with others, we recommend using a Google Cloud service account to authenticate to the BigQuery dataset, so that the data source isn't dependent on your credentials.
If you used Terraform to copy the dashboard, you get the service account ID when
you run the terraform apply command. If you used the Python script, you must
manually create the service account, using these steps:
Get the email address for the Looker Studio service agent from the Looker Studio service agent help page.
Create a service account for the Looker Studio service agent.
Grant the service account the following permissions on the project that has the BigQuery view for the dashboard:
bigquery.dataViewerbigquery.jobUseriam.serviceAccountTokenCreator
When you have the service account ID, follow these steps to use the service account for authentication:
From your Looker Studio home page, open the dashboard.
Click Edit to edit the dashboard.
From the Resource menu, select Manage added data sources. The name of the data source for the dashboard starts with
billing-export-view.From the Actions column for the data source, click Edit.
Click Data credentials.
In the Update data credentials page, select Service account credentials, and enter the service account ID.
Click Update to use the service account credentials.
Click Done to save the changes to the data source.
To view the dashboard, click View.
Update the dashboard to use your organization's labels
Several charts in the dashboard, such as those in the Cost Reporting: Labels
page, are based on the labels on your resources. To see an accurate breakdown of
your costs by specific labels, you must modify the default filters to use your
own labels.
From your Looker Studio home page, open the dashboard.
Click Edit to edit the dashboard.
From the Resource menu, select Manage filters.
Review filters that are based on
labels.keyandproject.labels.key, and where applicable, click Edit to change the label keys to ones that your organization uses.For example, if you use the label key
departmentto organize resources by business unit, edit thebusiness_unitfilter, and change theproject.labels.keyfilter todepartment.Click Close to finish editing the filter.
Analyze your data in the dashboard
The pages in the Looker Studio dashboard break down your cost data so that you can look at quick summaries of your costs and trends, and get detailed information about your spending.
In most pages, you can filter the data by project, and by using the calendar to choose the period for which you want to analyze the costs.
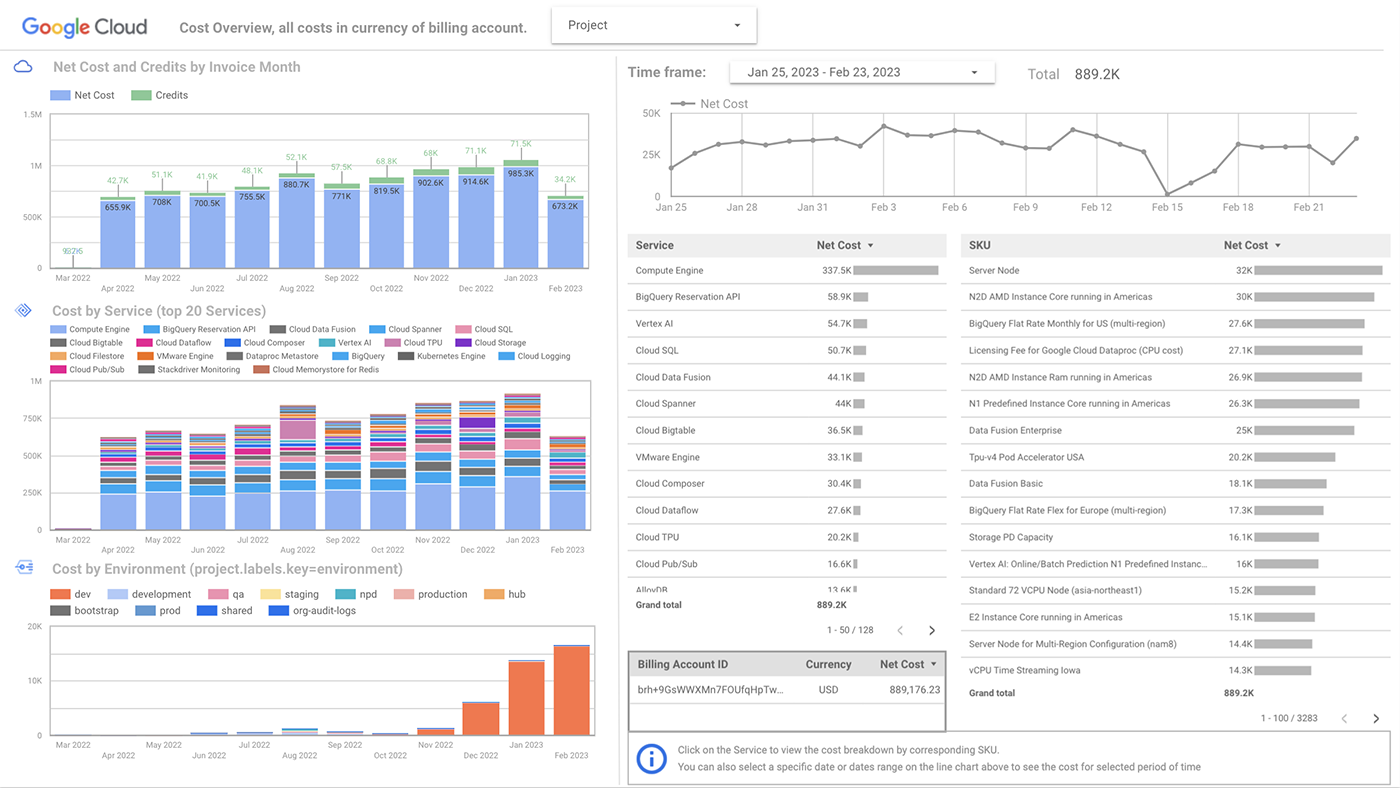
Get a high-level view of your costs
Use the Overview page for a high-level look at the net costs for the current and previous invoice months, the costs for your top services, and daily costs for the last 30 days.
Use the Trends page to compare your costs for different periods, such as the current month and the last month, or the current quarter and last quarter.
Use the Analysis page to analyze your costs over time, and identify anomalies such as unusually high or low spending.
Identify your cost drivers
Use the following pages to find where you're spending the most:
- Cost by service by month
- Cost by project by month
- Cost by project, service, and SKU
- Cost by region
For a detailed look at your costs for each service, use the service-specific pages. For example, the GKE Clusters page shows you the costs broken down by your GKE clusters and namespaces.
Identify opportunities to save with committed use discounts
Committed use discounts (CUDs) provide discounted prices in exchange for your commitment to use a minimum level of resources for a specified term.
The CUD pages in the dashboard show you your Compute Engine, Cloud SQL, and Memorystore usage that might be eligible for CUDs. If you already have one or more CUDs, these pages only show usage that isn't already covered by your existing CUDs.
View costs for Cloud Marketplace software and additional licenses
Use the Marketplace page to see your costs for software that you've purchased from Cloud Marketplace, such as Google Cloud NetApp Volumes.
Use the Licenses page to see how much you're spending on additional licences, such as licenses for Windows Server on Compute Engine, and third-party licences that you've purchased from Cloud Marketplace.
View costs by labels
You can customize the dashboard's filters to use your organization's labels. After you update the filters, you can use the following pages to view your costs across projects and folders:
The By application page shows costs for all resources under the label key
application. For example, if you have a web and mobile app, and label their resources withapplication:webandapplication:mobilerespectively, you can see your costs for each application separately.The Labels page shows your costs for specific labels, such as cost center and business code. If you customized the filters for the dashboard, you can change the titles on the charts to reflect your filters.
(Advanced) Modify the data for multiple Cloud Billing accounts
If you want the dashboard to include data from multiple Cloud Billing accounts, you can modify the BigQuery views to include the billing data exports for all the Cloud Billing accounts.
Before you begin
For each Cloud Billing account that you want to include, follow all the steps in the tutorial prerequisites.
Update the BigQuery views to include additional Cloud Billing exports
In the Google Cloud console, open the BigQuery page.
Select the project that contains the dataset that you created for the dashboard.
In the Explorer panel, expand your project, then expand the dataset.
Click the billboard view to see its details. This view queries your Standard cost and usage data export.
Click the Details tab, then click Edit Query. The query for the view looks similar to the following:
SELECT *,
  COALESCE((SELECT SUM(x.amount) FROM UNNEST(s.credits) x),0) AS credits_sum_amount,
  COALESCE((SELECT SUM(x.amount) FROM UNNEST(s.credits) x),0) + cost as net_cost,
  PARSE_DATE("%Y%m", invoice.month) AS Invoice_Month,
   date(usage_end_time) AS date
from `PROJECT_ID.BILLING_ACCOUNT_EXPORT` s
WHERE date(usage_end_time) > DATE_SUB(CURRENT_DATE(), INTERVAL 13 MONTH)
Where PROJECT_ID is the project that contains the BigQuery Standard cost data export for the Cloud Billing, and BILLING_ACCOUNT_EXPORT is the name of the BigQuery table with your Standard cost data.
Duplicate the existing query, and in the
FROMclause, replace the project ID and BigQuery table with information for the additional Cloud Billing account.Add the
UNION ALLoperator between the two queries to combine the data. Your final query looks something like the following example, which combines the data exports for BILLING_ACCOUNT_1 and BILLING_ACCOUNT_2, which are in PROJECT_ID_1 and PROJECT_ID_2 respectively.SELECT *, --query for BILLING_ACCOUNT_1 COALESCE((SELECT SUM(x.amount) FROM UNNEST(s.credits) x),0) AS credits_sum_amount, COALESCE((SELECT SUM(x.amount) FROM UNNEST(s.credits) x),0) + cost as net_cost, EXTRACT(DATE FROM _PARTITIONTIME) AS date FROM `PROJECT_ID_1.BILLING_ACCOUNT_1_EXPORT` s WHERE _PARTITIONTIME >"2021-01-01" UNION ALL SELECT *, --query for BILLING_ACCOUNT_2 COALESCE((SELECT SUM(x.amount) FROM UNNEST(s.credits) x),0) AS credits_sum_amount, COALESCE((SELECT SUM(x.amount) FROM UNNEST(s.credits) x),0) + cost as net_cost, PARSE_DATE("%Y%m", invoice.month) AS Invoice_Month, date(usage_end_time) AS date from `PROJECT_ID_2.BILLING_ACCOUNT_2_EXPORT` s WHERE date(usage_end_time) > DATE_SUB(CURRENT_DATE(), INTERVAL 13 MONTH)Repeat these steps for the billboard_detail view, which queries the Detailed cost and usage data.
If one of your accounts is in a different currency than USD, repeat these steps, and use the
currency_conversion_ratecolumn to convert to USD, similar to the following example:select *, (COALESCE((SELECT SUM(x.amount) FROM UNNEST(s.credits) x),0))/currency_conversion_rate AS credits_sum_amount, (COALESCE((SELECT SUM(x.amount) FROM UNNEST(s.credits) x),0))/currency_conversion_rate + cost/currency_conversion_rate as net_cost, 'USD' as net_cost_currency, PARSE_DATE("%Y%m", invoice.month) AS Invoice_Month, date(usage_end_time) AS date from `PROJECT_ID.BILLING_ACCOUNT_DATASET` s WHERE date(usage_end_time) > DATE_SUB(CURRENT_DATE(), INTERVAL 13 MONTH)
Clean up
Terraform
If you don't want to use the dashboard any more, open your Terraform working
directory again, and use the terraform apply command to delete the resources
that you created.
Open your Terraform working directory in Cloud Shell. If you used the GitHub repository in this tutorial, use the following link to open the repository:
Optionally, to preview which resources are deleted, run the following
terraform plancommand:terraform plan -destroyReview the Terraform changes. When you're ready to delete the resources, run the following
terraform applycommand:terraform apply -destroy
Python
If you don't want to use the dashboard any more, clone the GitHub repository and
run the dashboard script with the -clean option. The script deletes the
BigQuery views, but leaves your BigQuery export
dataset intact.
Open the GitHub repository in Cloud Shell:
Navigate to the
billboarddirectory:cd examples/billboardRun the following commands to set up the Python environment for the script:
pip install virtualenv
virtualenv bill-env
source bill-env/bin/activate
pip install -r requirements.txt
Run the cleanup command:
python billboard.py \
  -pr 'PROJECT_ID' \
  -se 'STANDARD_BILLING_EXPORT_DATASET' \
  -de 'DETAILED_BILLING_EXPORT_DATASET' \
  -bb 'BILLBOARD_DATASET' \
  -clean yes
Where the variables are as follows:
- PROJECT_ID: The project ID that hosts your Cloud Billing datasets.
- STANDARD_BILLING_EXPORT_DATASET: The BigQuery dataset that contains your Standard usage cost data export.
- DETAILED_BILLING_EXPORT_DATASET: The BigQuery dataset that contains your Detailed usage cost data export.
- BILLBOARD_DATASET: The BigQuery dataset where you created the BigQuery views for the dashboard.
To delete the Looker Studio dashboard, open Looker Studio locate the dashboard, and from the menu , click Remove.