This document describes how to view the system health status of your SAP workloads by using the observability service in Workload Manager. These metrics help you perform root cause analysis and troubleshoot issues with your workloads.
View system dashboard
To view the system dashboard for SAP workloads in a Google Cloud project, do the following:
In the Google Cloud console, go to the Workload Manager page.
Select a Google Cloud project.
Select Observability from the left navigation menu.
If prompted, enable the required APIs for observability and configure the Workload Manager service agent properly. For more information, see Prerequisites for SAP observability.
If you have all the required permissions, you can see a table on the dashboard that lists all SAP systems in the project.
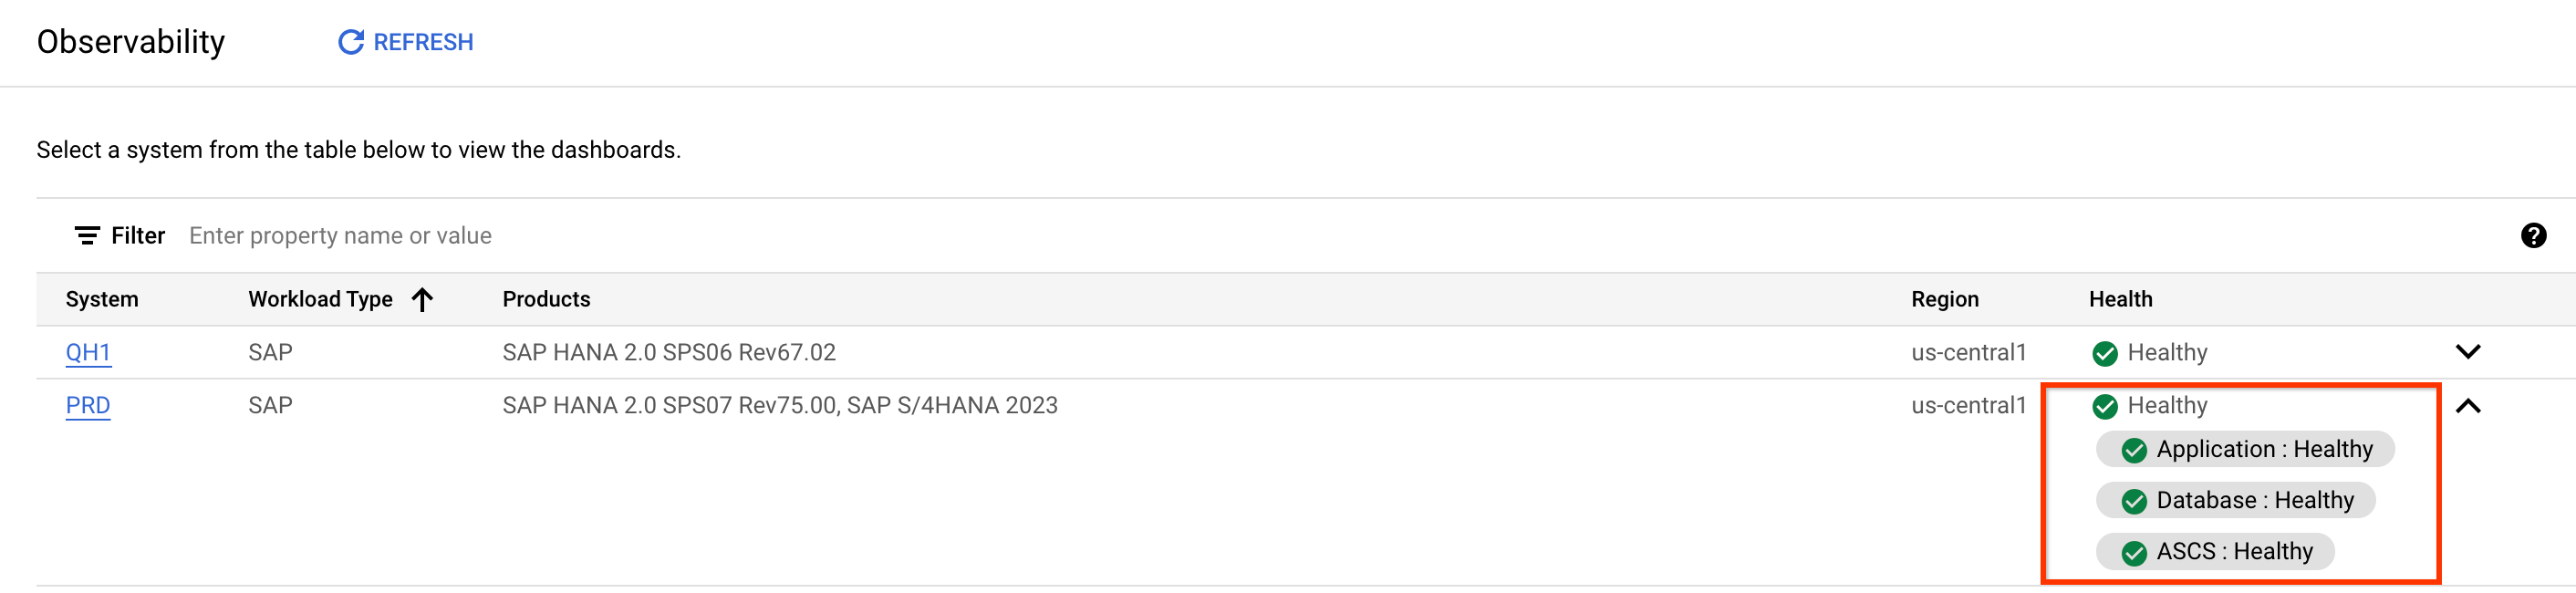
For each SAP system, review the following information:
- SAP system ID (SID)
- If the application and database SIDs are the same, the table contains one entry for both.
- If the application and database SIDs are different, the table contains an entry in the format [App SID]- [DB SID]
- Workload type
- In Preview, only SAP workloads are supported.
- Products
- The application version and SAP HANA version.
- Region
- The Google Cloud region where the VMs in the system are located.
- Health
- The overall system health for the system. You can expand the health status for a system to see the health individually at the application, database, and central services (ASCS) layers of the system.
- SAP system ID (SID)
Understand system health status
Workload Manager uses a color state to describe the status of an SAP system and it helps you identify its layers and sublayers. The following table describes each status you see on the observability dashboard.
| Status icon | Status | Description |
|---|---|---|
 |
Gray (Unspecified) |
|
 |
Green (Healthy) |
|
 |
Yellow (Caution) |
|
 |
Red (Critical) |
|
The system health is calculated based on the report metric values for each system layer and sublayer. The following figure provides a general representation of the system layers and sublayers:
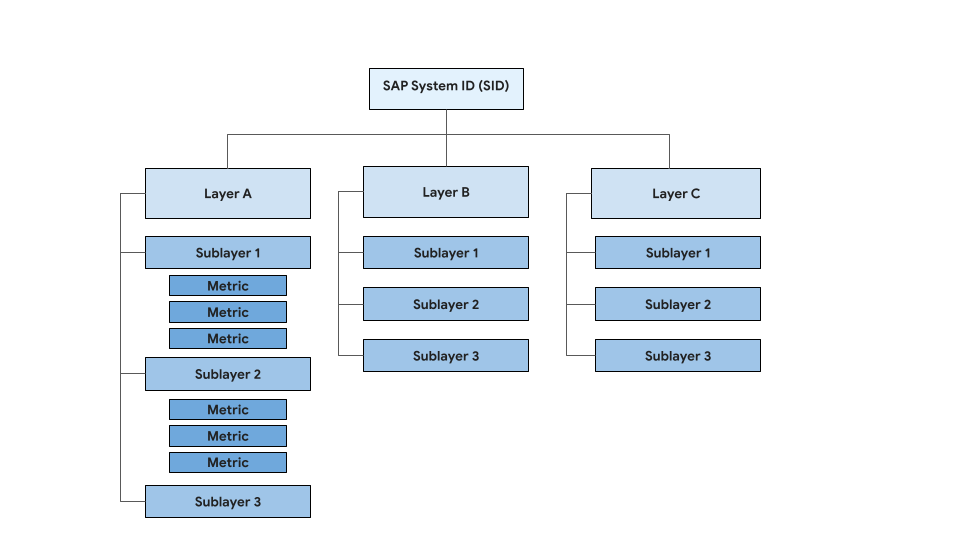
The system layers used for evaluating SAP workloads are:
- Central services
- Application servers
- Database servers
The number of sublayers depends on the architecture type of the SAP system that is being evaluated. For example, a centralized system has lesser number of sublayers than a distributed system and therefore the health status is tailored for the type of system that is displayed on the dashboard.
To get the overall status as Healthy for the system, all of the layers and sublayers need to have a Healthy status. Otherwise, the SAP system health status is marked as Unspecified. The following example shows a centralized system with the overall status as Unspecified due to missing metric values:
- Application servers:
- Application server 1 (Missing): Gray
- Application servers layer: Gray
- Central Services:
- Central Services: Green
- Central Services layer: Green
Database Servers:
- SAP HANA primary instance: Green
- Database Servers layer: Green
Overall Health: Gray (Unspecified)
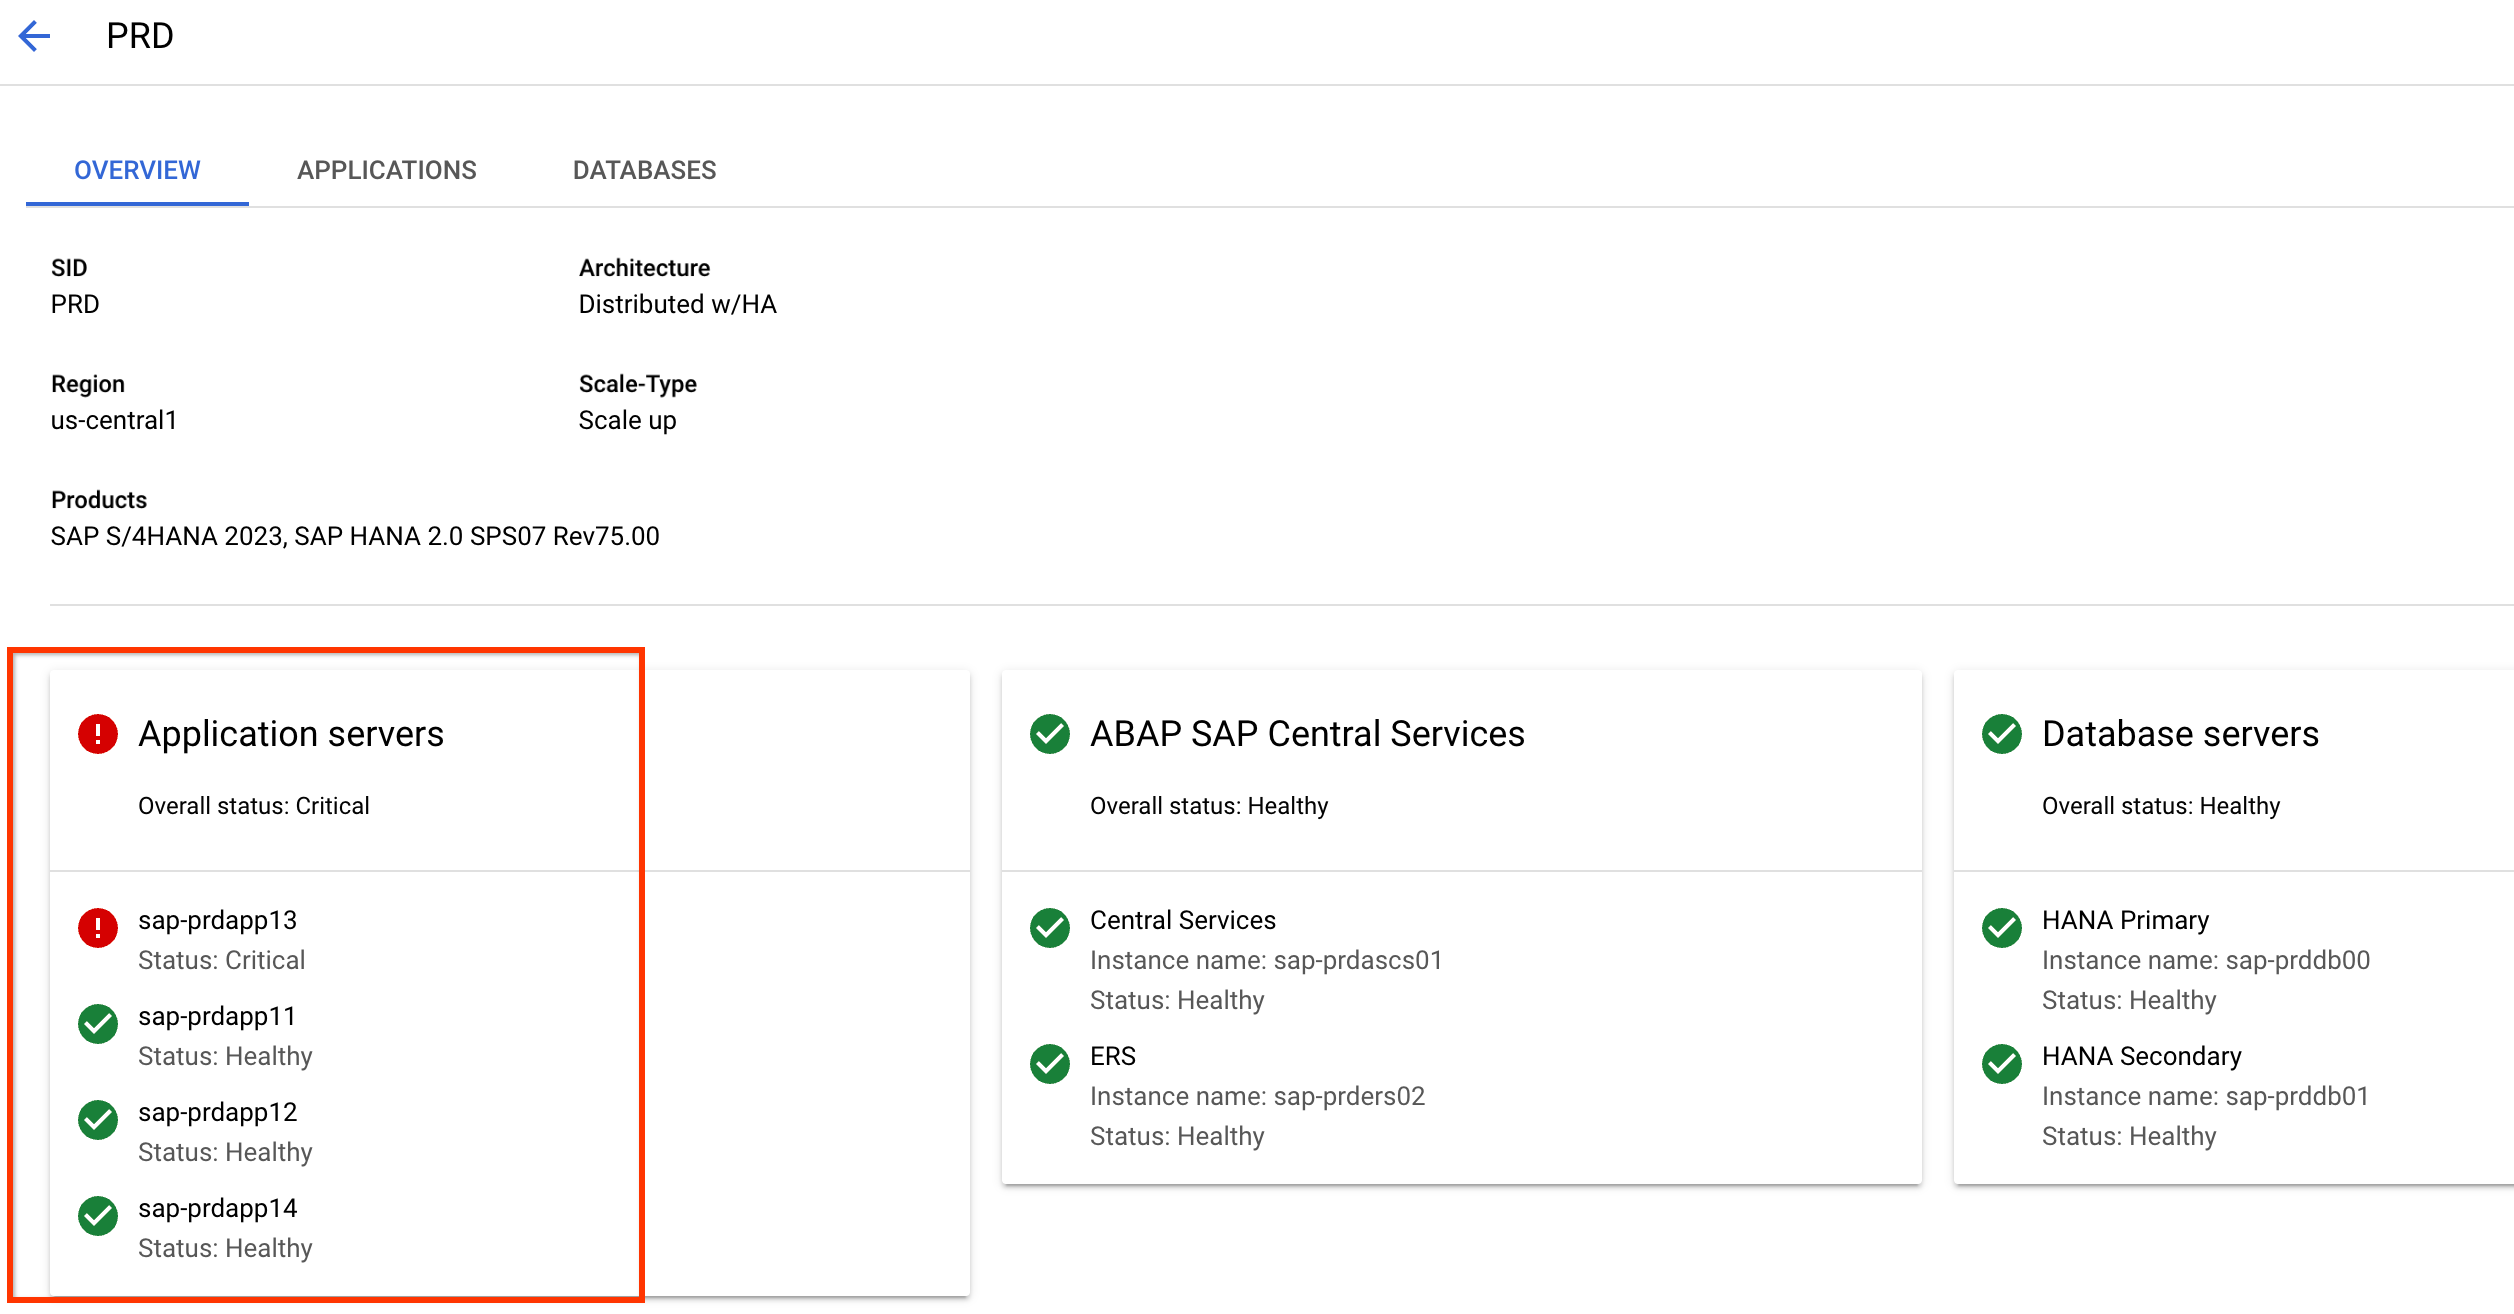
The following example shows a more complex scenario of a distributed deployment with high availability showing the overall health status as Red (Critical) due to missing metric values:
- Application servers:
- Application server 1: Red
- Application server 2: Green
- Application server N: Green
- Application servers layer: Red
- Central Services:
- Central Services: Green
- ERS: Green
- Central Services layer: Gray
Database Servers:
- HANA primary instance: Green
- HANA secondary instance: Green
- Database Servers layer: Green
Overall Health: Red (Critical)
SAP observability metrics
Workload Manager calculates the system health status for your SAP workloads by using the following metrics:
- Metrics from Compute Engine instances hosting the SAP workloads:
- Available by default, no external agent is required.
- Metrics are located under compute.googleapis.com.
Metrics collected by OPS Agent:
- Requires the OPS Agent to be installed and running on the VM to have the metrics reported to Cloud Monitoring.
- Metrics are located under
agent.googleapis.com.
- The required metrics using in observability for SAP are included in the non-chargeable tier.
Metrics collected by Agent for SAP:
- Requires the Agent for SAP to be installed and running on the VM to have the metrics reported to Cloud Monitoring.
Metrics are located under workload.googleapis.com/sap. The following metrics are used to calculate the health status:
workload.googleapis.com/sap/hana/availabilityworkload.googleapis.com/sap/hana/ha/availabilityworkload.googleapis.com/sap/hanamonitoring/system/replication_data_latency/total_timeworkload.googleapis.com/sap/hana/serviceworkload.googleapis.com/sap/cluster/nodesworkload.googleapis.com/sap/cluster/resourcesworkload.googleapis.com/sap/nw/instance/roleworkload.googleapis.com/sap/nw/serviceworkload.googleapis.com/sap/nw/availability
System details page
You can click a System ID (SID) from the observability dashboard to see a detailed view of the system.
Overview tab
The Overview tab shows high-level information about your SAP system, which is organized as follows:
The first section shows metadata about your SAP system such as SID, the architecture in use, the region where the system is deployed, whether it's a scale-up or scale-out system, and the applications and databases that are part of your SAP system.
The next section shows a card for each layer of your SAP system, such as application servers, SAP Central Services instance, and database servers. You can view their overall health status and names of the compute instances that host them.
The Health Insights section lists the unhealthy compute instances that are part of your SAP system. This table provides the reasons for why the compute instances are deemed unhealthy.
The Maintenance Events section lists the compute instances in your SAP system that either have an upcoming scheduled host maintenance event, or recently completed one.
For more information, see host maintenance for a list of supported machine families.
Applications and Databases tabs
The Applications and Database tabs show more detailed information about the respective layers of the system:
The Applications tab shows information about application servers and the SAP Central Services instance. The Databases tab shows information about the database servers running in your SAP system.
Both Applications and Databases tabs list the underlying compute instances and show the following information:
- VM Name: the name of the compute instance
- VM Status: whether the compute instance is running or not
- SAP #: the SAP instance number you've assigned to the app or database server while deploying your SAP system
- Role: the role you've assigned to the compute instance in your SAP
system, which includes the following:
- For instances used as application servers: Application Server, Central Services, ERS.
- For instances used as database servers: HANA Primary, HANA Secondary
- Zone: the Compute Engine zone where the compute instance is deployed
- Machine type: the machine type of the compute instance, for example
n2-highmem-32orc4-highmem-48 - Connect: the options such as SSH using which you can connect to the compute instance. Your users might require additional permission to connect to the compute instance.
Both Applications and Databases tabs also include a variety of charts and metrics that are filtered to only include the applicable resources in the chosen layer of your SAP system.
- You can switch between the predefined and custom dashboards.
The predefined dashboard in the Applications tab shows the following high-level sections:
- Availability
- Performance
- Storage
- Networking
- Application server performance
- Work process utilization
- NetWeaver memory
- Workload statistics
The dashboard in the Databases tab shows the following high-level sections:
- Availability
- Performance
- Database Performance
- Storage
- Network
- Database Utilization
- Database Capacity
- Database Backups
View SAP events on predefined dashboards
You can configure the predefined dashboards in the Applications and Databases tabs to view annotations for supported SAP event types.
Viewing SAP events as annotations on observability dashboards can help you correlate the events with issues that you might experience in your SAP systems. For more information about event annotations, see About event annotations.
For information about the SAP event types that you can view as annotations on predefined observability dashboards, see Supported SAP event types.
To view the supported SAP event types as annotations on your observability dashboard, complete the following steps:
Make sure that the compute instances that are part of your SAP system run version 3.7 or later of Agent for SAP.
For information about how to update the agent instance, see Update Google Cloud's Agent for SAP.
In the Google Cloud console, go to the Workload Manager Observability page.
To view SAP events in the application layer of your SAP system, go to the Applications tab. To view SAP events in the database layer, go to the Databases tab.
Click Annotations, select the event types that you want to view on your dashboard, and then click Apply.
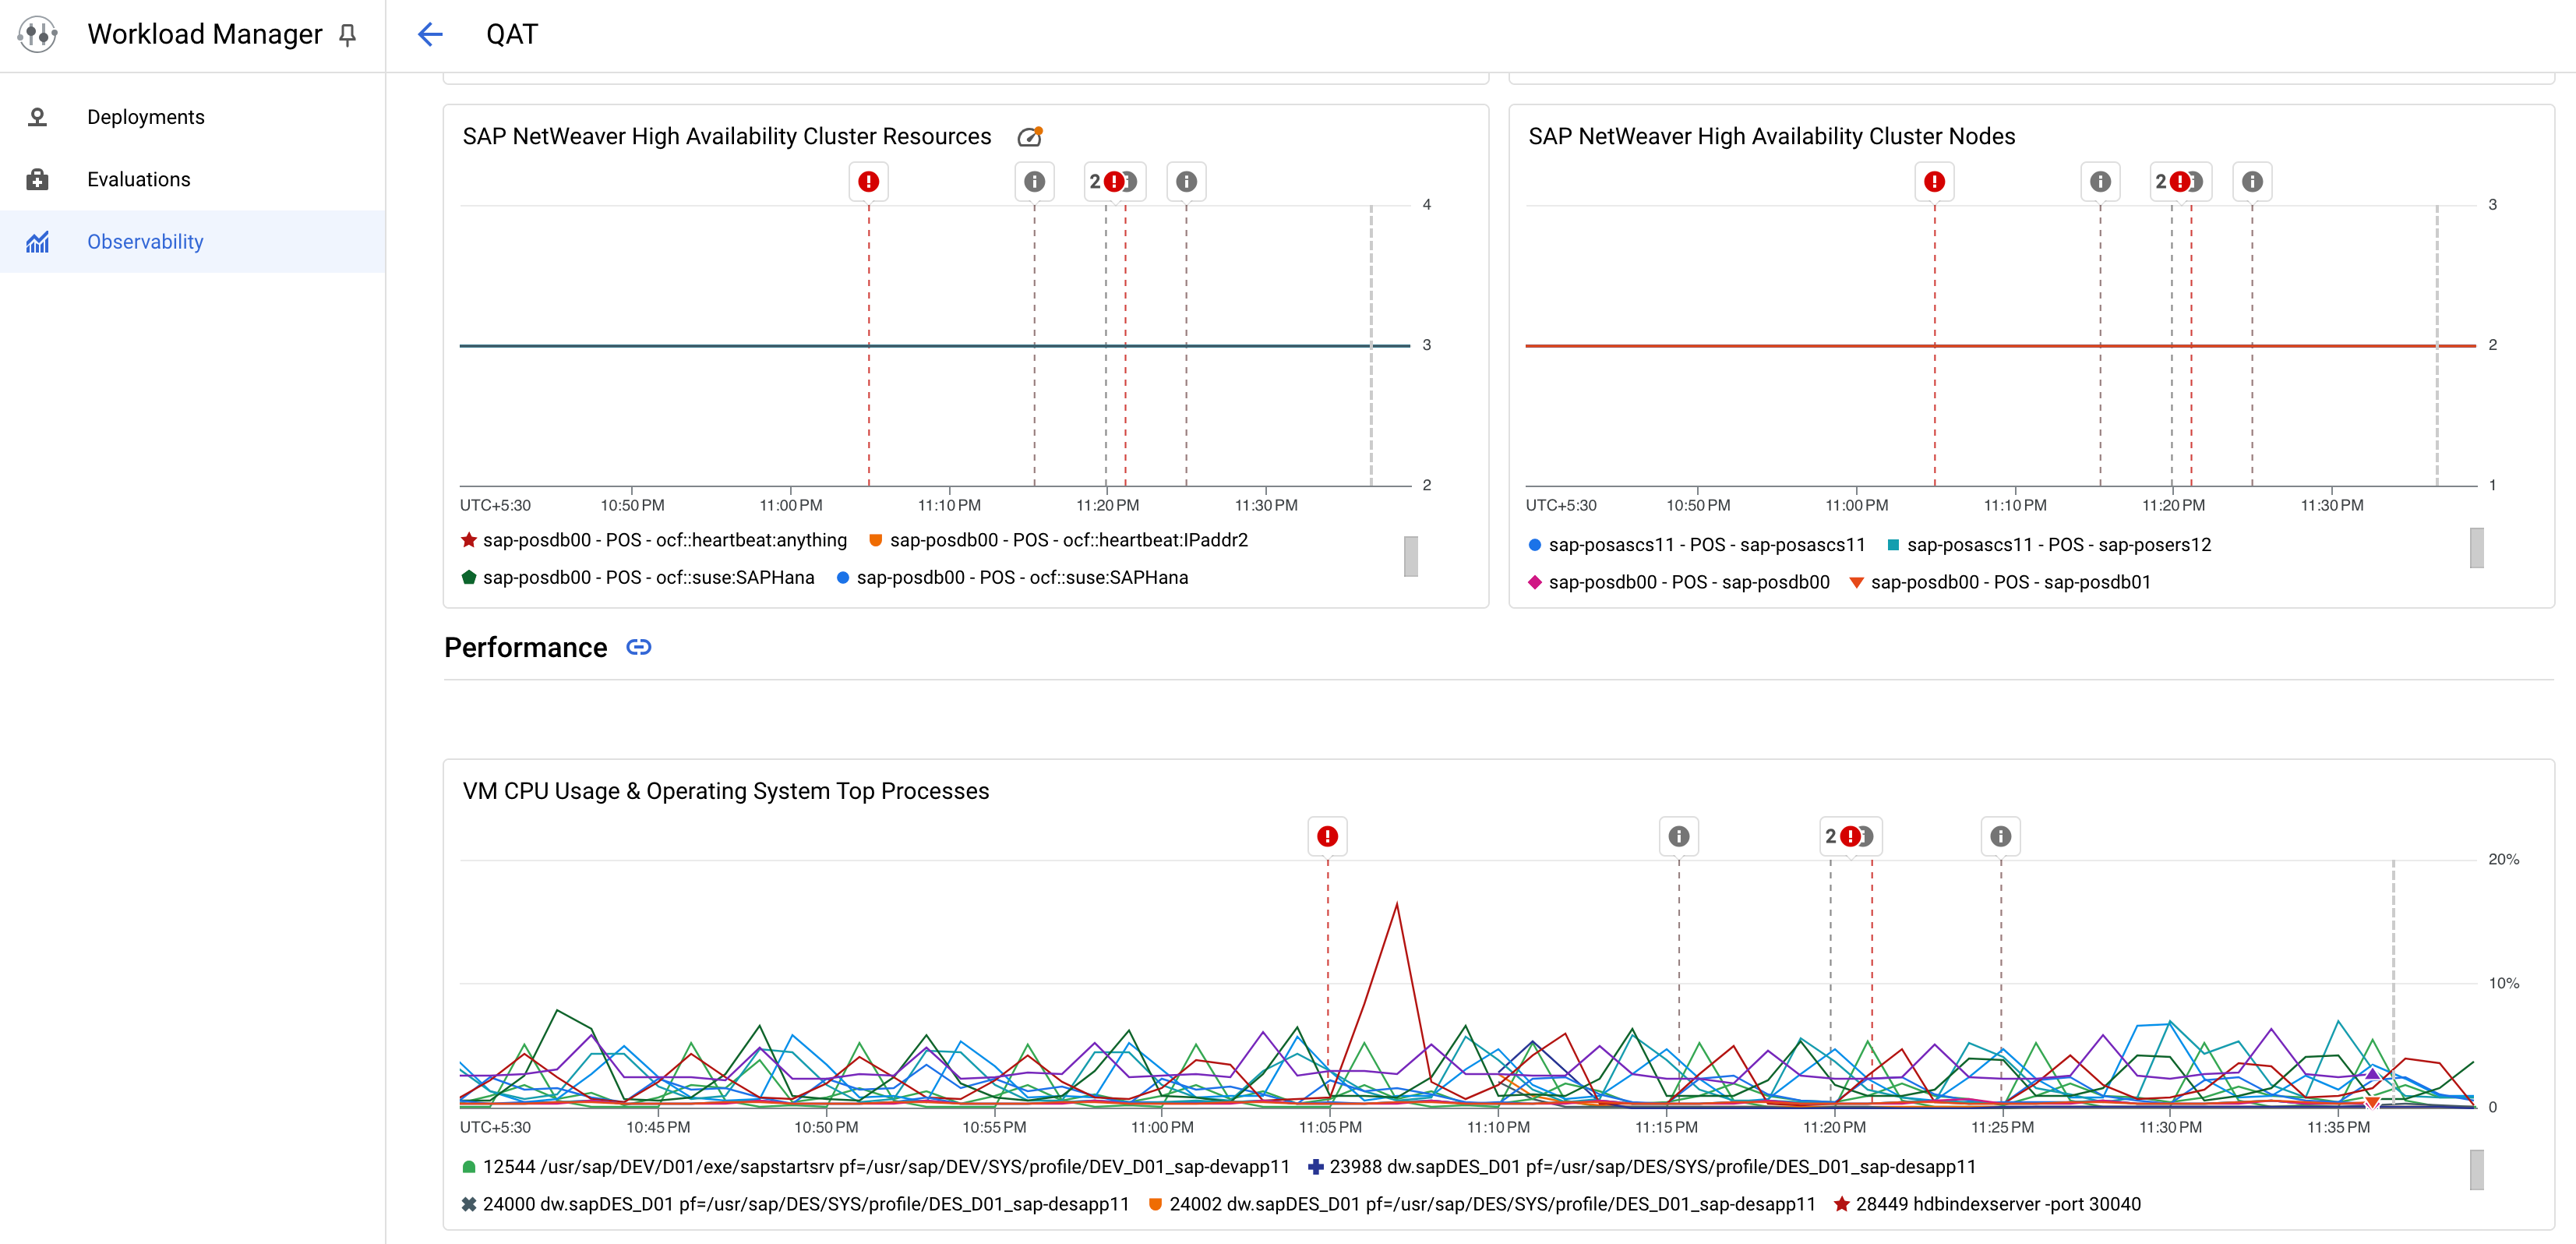
Occurrences of the selected SAP events start appearing in the charts of the predefined observability dashboard. The following image shows an example observability dashboard in the Applications tab, with annotations for the SAP Availability types of events:
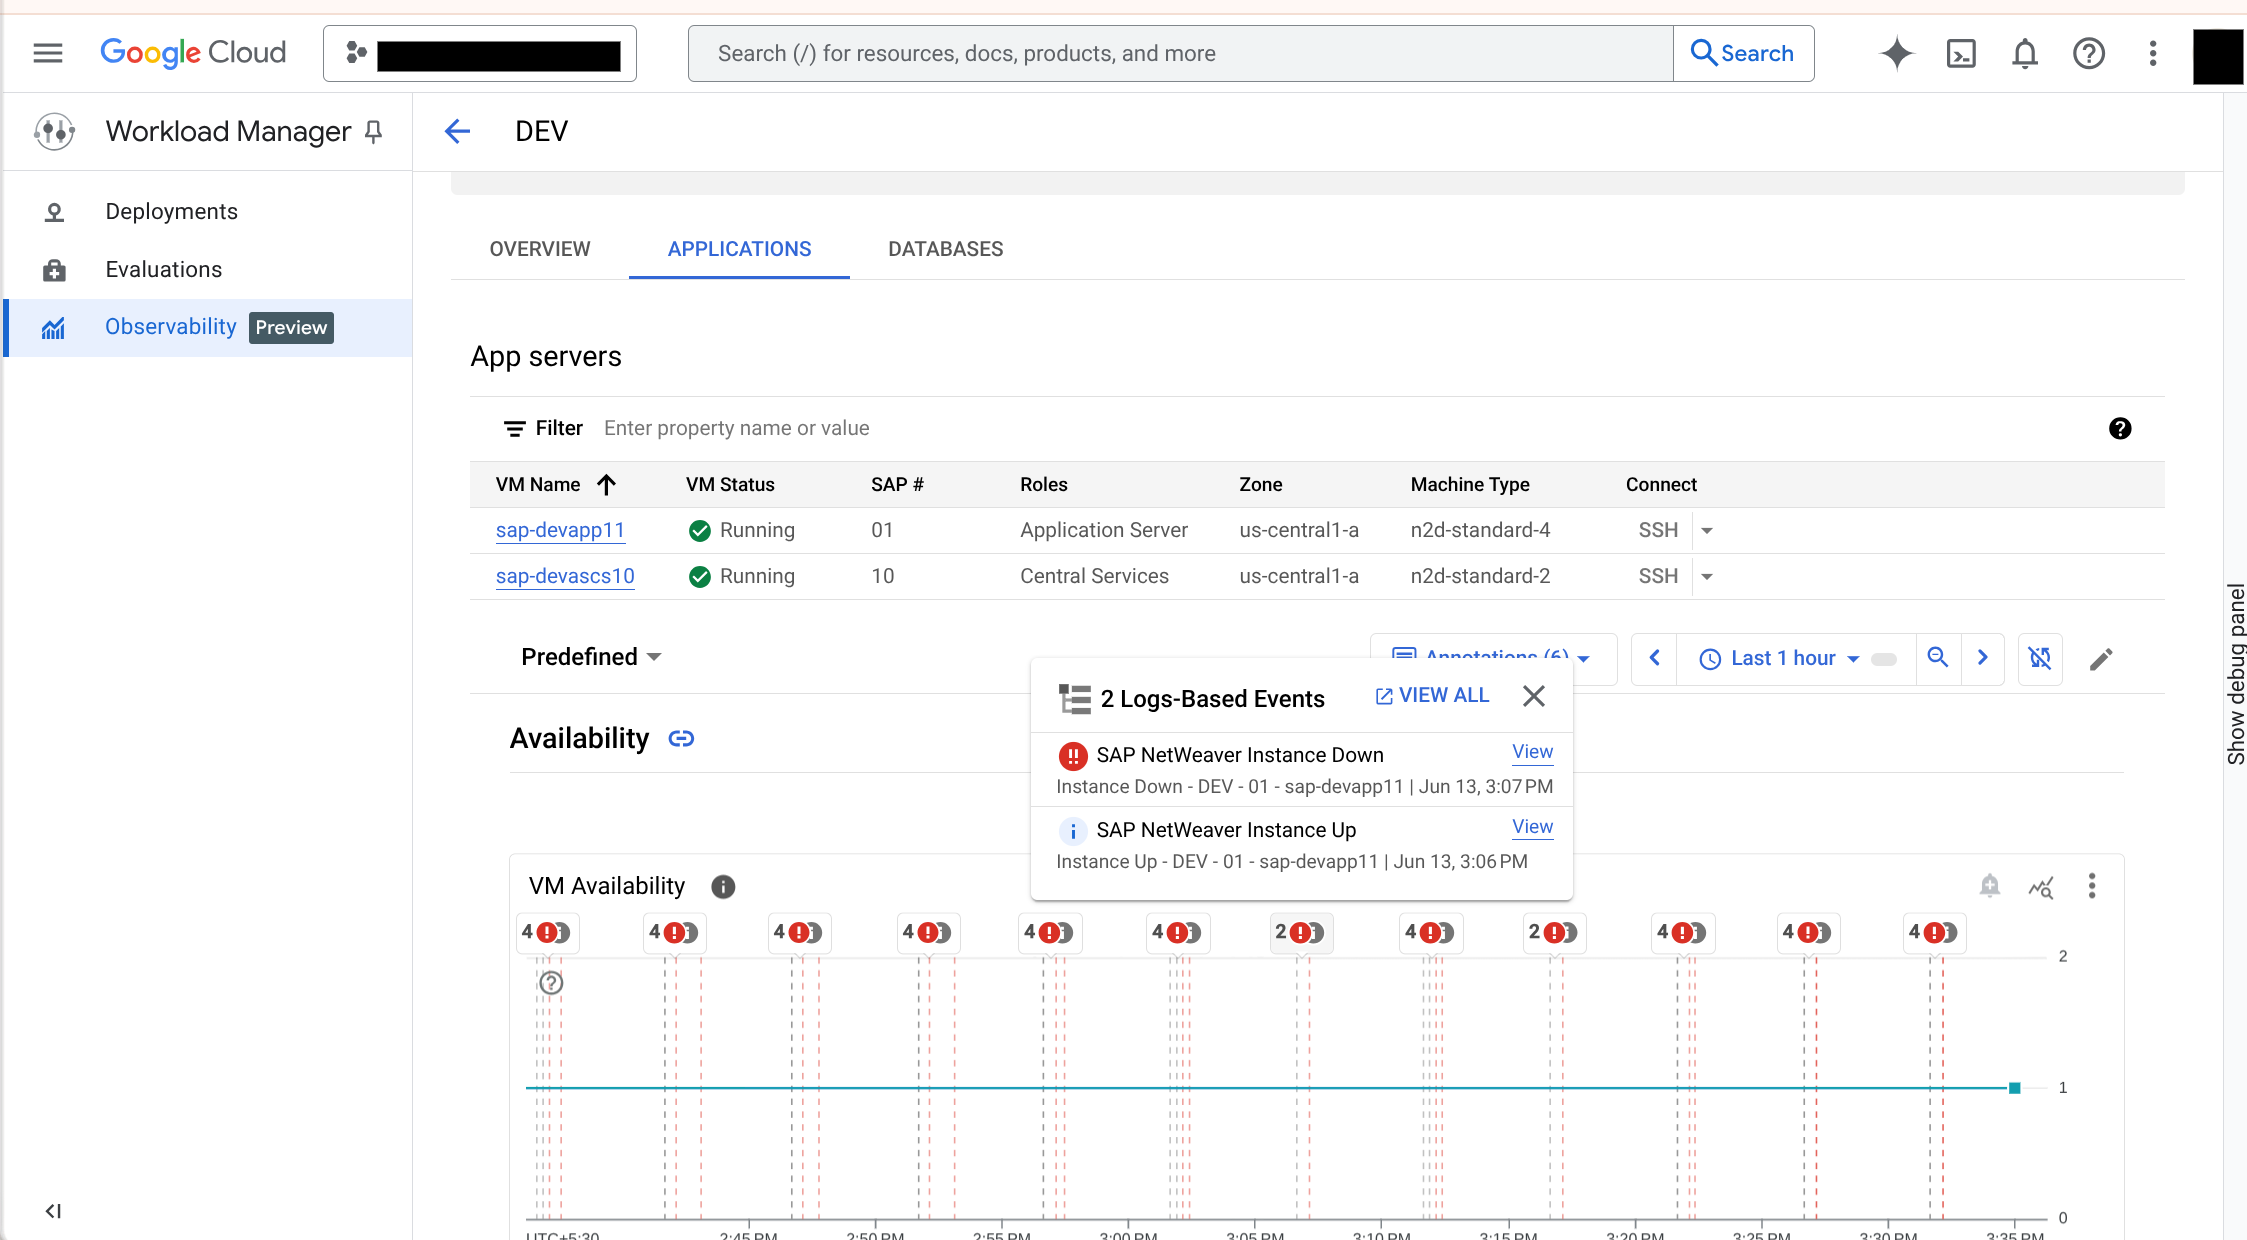
To view additional information about the event, hover over the event, and then click View.
The Logs Explorer appears, filtered to show information about the selected event.
Supported SAP event types
The following table describes the SAP event types that you can show as annotations on predefined observability dashboards. Each event type requires Agent for SAP to collect the required metrics.
| Event type | Description |
|---|---|
| SAP Availability |
Provides information about the status of the following resources whenever they stop, start, or face any errors: SAP HANA, SAP NetWeaver, and the nodes and resources in Pacemaker-managed Linux high-availability (HA) clusters. Showing events of this type as annotations requires Agent for SAP to collect the following Process Monitoring metrics:
|
| SAP Backint |
Provides information about Backint based backup and recovery operations. Showing events of this type as annotations requires Agent for SAP to collect the Backint metrics. For information about these metrics, see Backint metrics collection. |
| SAP Operations |
Provides information about the status of data replication in SAP HANA high-availability (HA) systems. Showing events of this type as annotations requires
Agent for SAP to collect the following
Process Monitoring metric: |
Remove workloads from the observability dashboard
To remove an SAP workload from the observability dashboard, disable the discovery feature in the configuration file of Google Cloud's Agent for SAP on each VM by running the following command:
sudo /usr/bin/google_cloud_sap_agent configure -feature=sap_discovery -disable
Restart the agent for the changes to take effect.
Create custom alerts
You can use the alerting policies in Cloud Monitoring and create custom alerts based on the displayed metrics on the observability dashboards. Once you create an alerting policy, you receive notifications based on the configured threshold for each of the available Cloud Monitoring metrics including metrics related to SAP workloads.