This document describes how you can use AI assistance in Cloud SQL to troubleshoot high database load in Cloud SQL. You can use the AI assistance capabilities of Cloud SQL and Gemini Cloud Assist to investigate, analyze, obtain recommendations, and finally implement those recommendations to optimize your queries in Cloud SQL.
By accessing the Query insights dashboard in the Google Cloud console, you can analyze your database and troubleshoot events when your system experiences a higher database load than average. Cloud SQL uses the 24 hours of data that occurs prior to your selected time range to calculate the expected load of your database. You can look into the reasons for the higher load events and analyze the evidence behind reduced performance. Finally, Cloud SQL provides recommendations for optimizing your database to improve performance.
Before you begin
To troubleshoot high database load with AI assistance, do the following:
Required roles and permissions
For the roles and permissions required to troubleshoot high database load with AI assistance, see Observe and troubleshoot with AI.
Use AI assistance
To use AI assistance with troubleshooting high database load, go to the Instance Overview page or the Query insights dashboard in the Google Cloud console.
Instance overview page
Troubleshoot high database load with AI assistance in the Instance overview page by using the following steps:
-
In the Google Cloud console, go to the Cloud SQL Instances page.
- To open the Overview page of an instance, click the instance name.
- In the Overview page, from the Chart menu, select a metric for the database. You can select any metric.
- Optional: To select a specific analysis time period, use the Time range filter to select either 1 hour, 6 hours, 1 day, 7 days, 30 days or a custom range .
- Click Analyze instance performance to start troubleshooting high database load with AI assistance. This generates the Analyzing database load page.
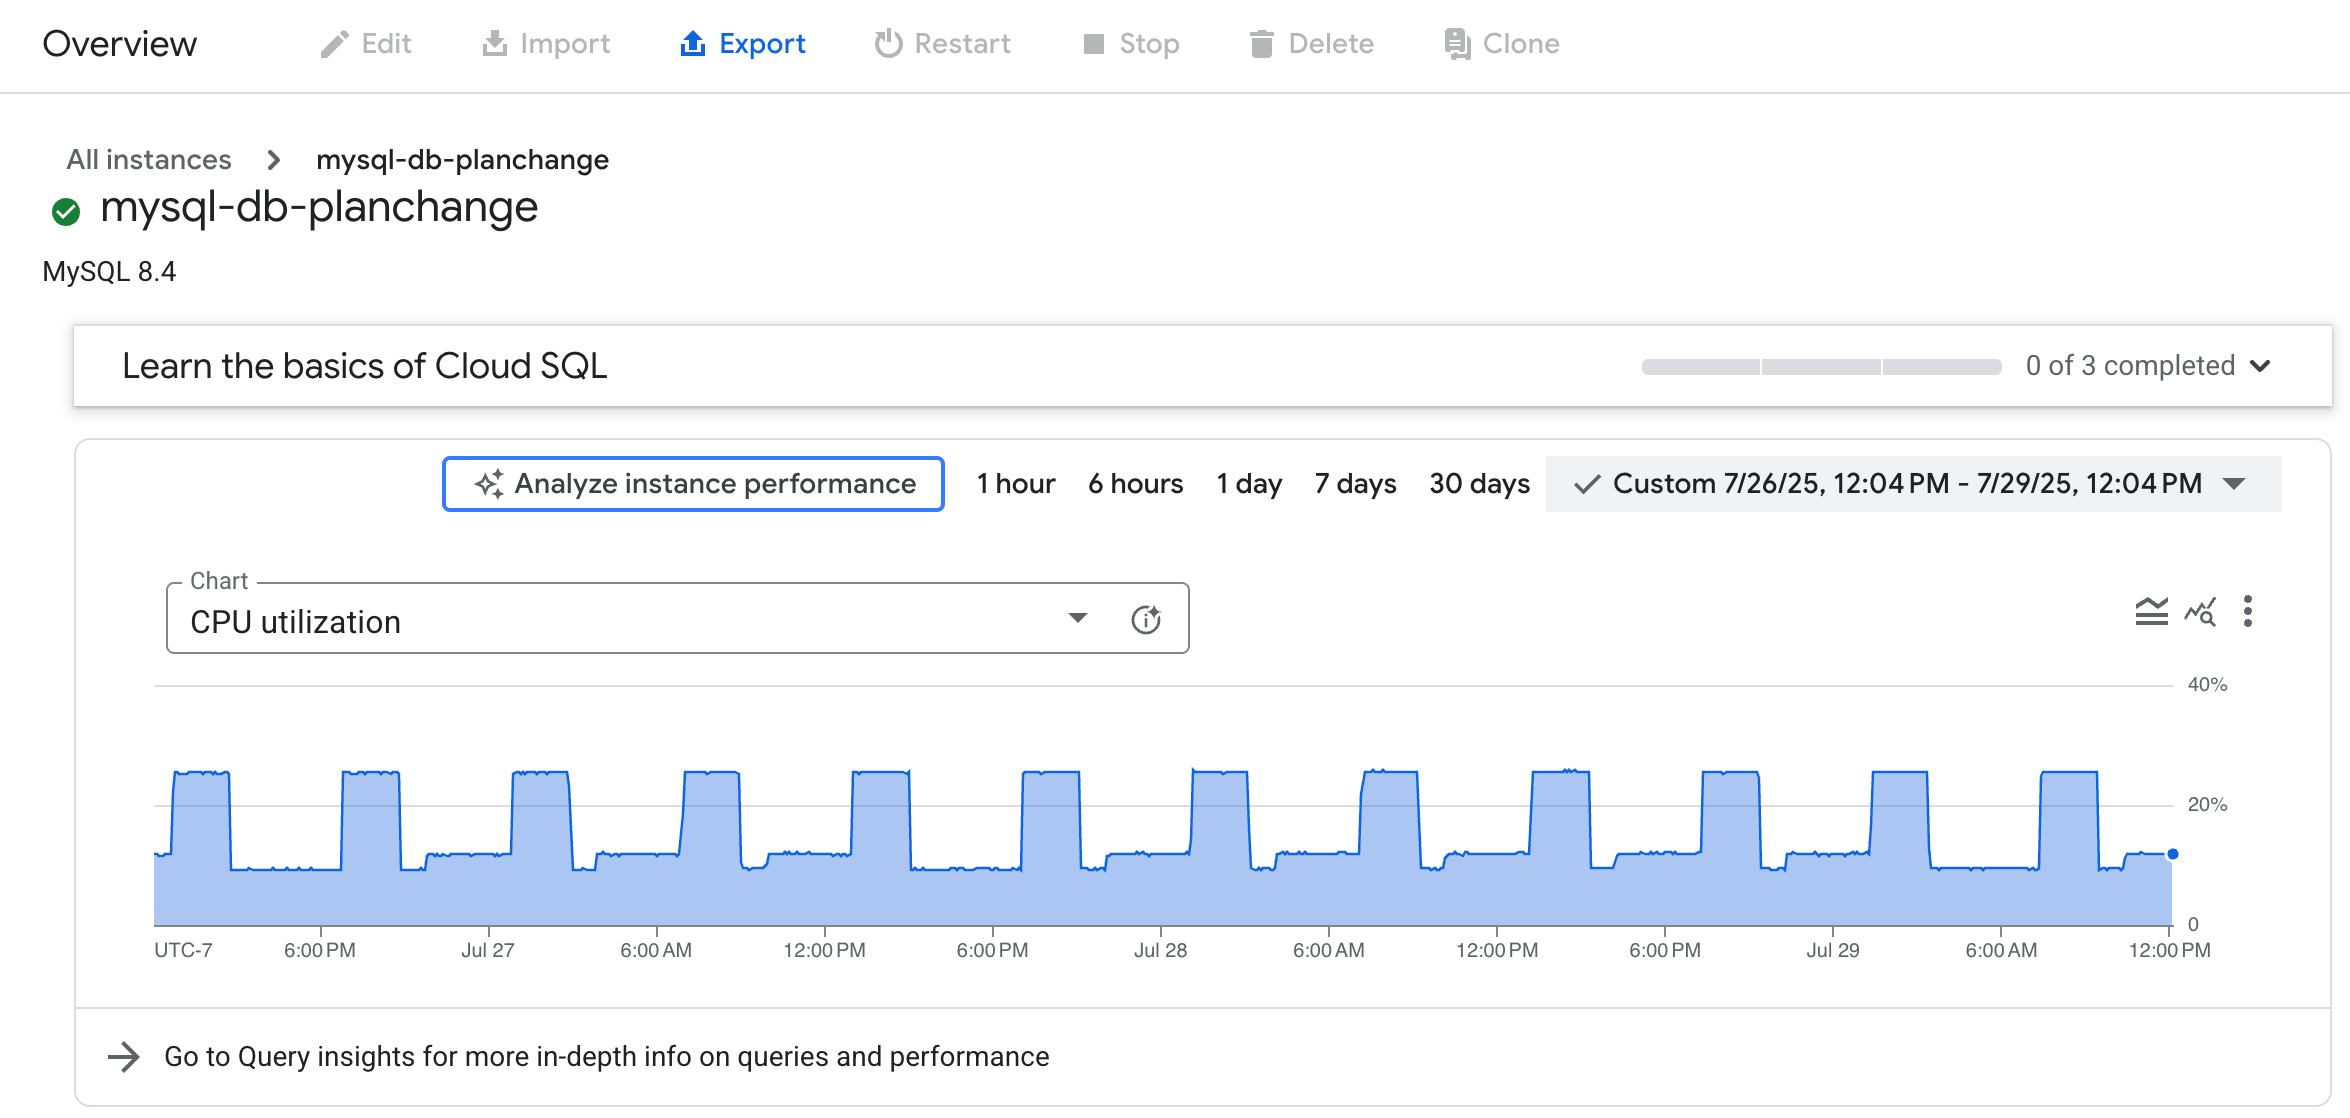
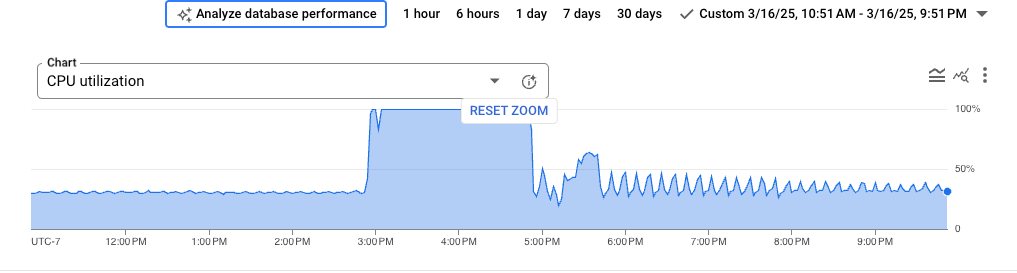
You can zoom in to specific sections of the chart where you notice areas of high load that you want to analyze. For example, an area of high load might display CPU utilization levels closer to 100%. To zoom in, click and select a portion of the chart.
Query insights dashboard
Troubleshoot high database load with AI assistance in the Query insights dashboard using the following steps:
-
In the Google Cloud console, go to the Cloud SQL Instances page.
- To open the Overview page of an instance, click the instance name.
- Click Query insights to open the Query insights dashboard.
- Optional: Use the Time range filter to select either 1 hour, 6 hours, 1 day, 7 days, 30 days or a custom range.
- In the Database load chart, click Analyze instance performance to start troubleshooting high database load with AI assistance. This generates the Analyzing database load page.
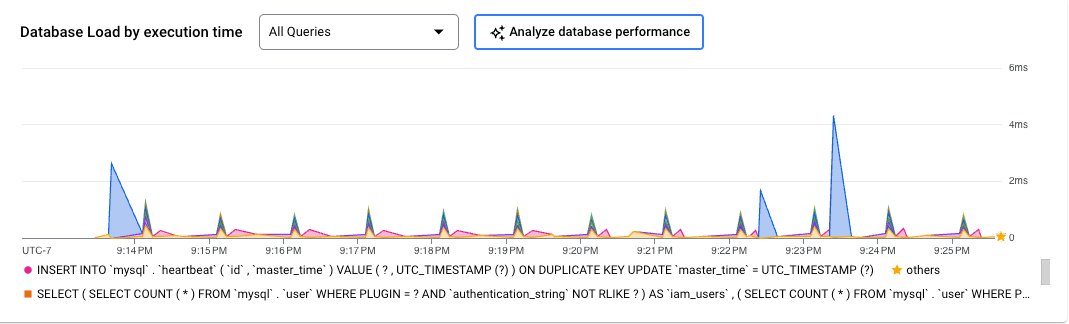
You can zoom in to specific sections of the chart where you notice areas of higher database load by query execution time. To zoom in, click and select a portion of the chart.
Analyze high database load
Using AI assistance, you can analyze and troubleshoot the details of your database load.
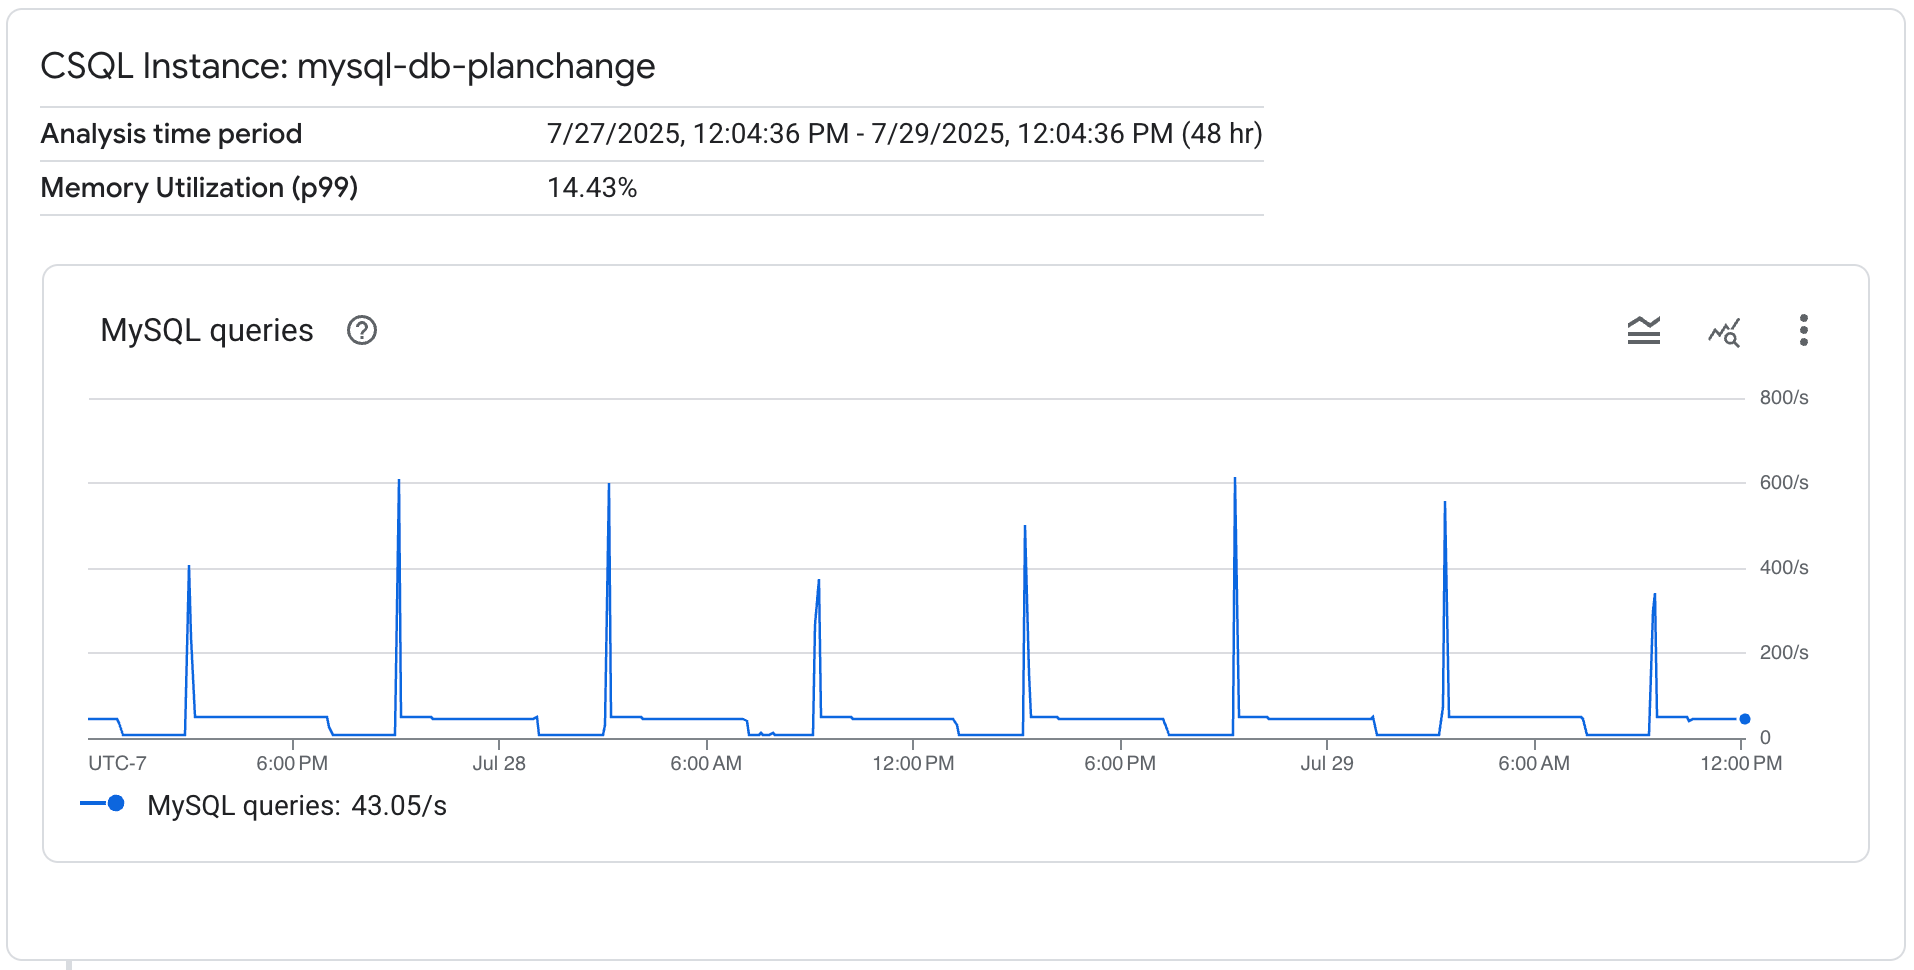
In the Analyzing database load page, you can view following details for your Cloud SQL instance:
- Analysis time period
- CPU utilization (p99)
- Memory utilization (p99)
Cloud SQL displays a MySQL queries chart where you can look at query activity during the selected time period. You can check for sudden spikes in activity during a particular time period.
Analysis time period
Cloud SQL analyzes your database for the time period that you select in your database load chart from the Query insights dashboard or the Instance overview page. If you select a time period of less than 24 hours, then Cloud SQL analyzes the entire time period. If you select a time period greater than 24 hours, then Cloud SQL selects only the last 24 hours of the time period for analysis.
To calculate the baseline performance analysis of your database, Cloud SQL includes 24 hours of a baseline time period in its analysis time period. If your selected time period occurs on a day other than Monday, then Cloud SQL uses a baseline time period of the 24 hours previous to your selected time period. If your selected time period occurs on a Monday, then Cloud SQL uses a baseline time period of the 7th day previous to your selected time period.
Situation
When Cloud SQL starts the analysis, Cloud SQL checks for significant changes in the following key metrics:
- Queries per second (QPS)
- CPU
- Memory
- Disk I/O
Cloud SQL compares the baseline aggregated data for your database within the performance data of your analysis time window. If Cloud SQL detects a significant change in threshold for a key metric, then Cloud SQL indicates a possible situation with your database. The identified situation might explain a root cause for the high load on your database over the selected time period.
For example, you might see multiple situations identified for why your database is experiencing high load:
- High thread concurrency
- Significant changes in CPU utilization
- Significant changes in disk IOPS
- Significant changes in QPS
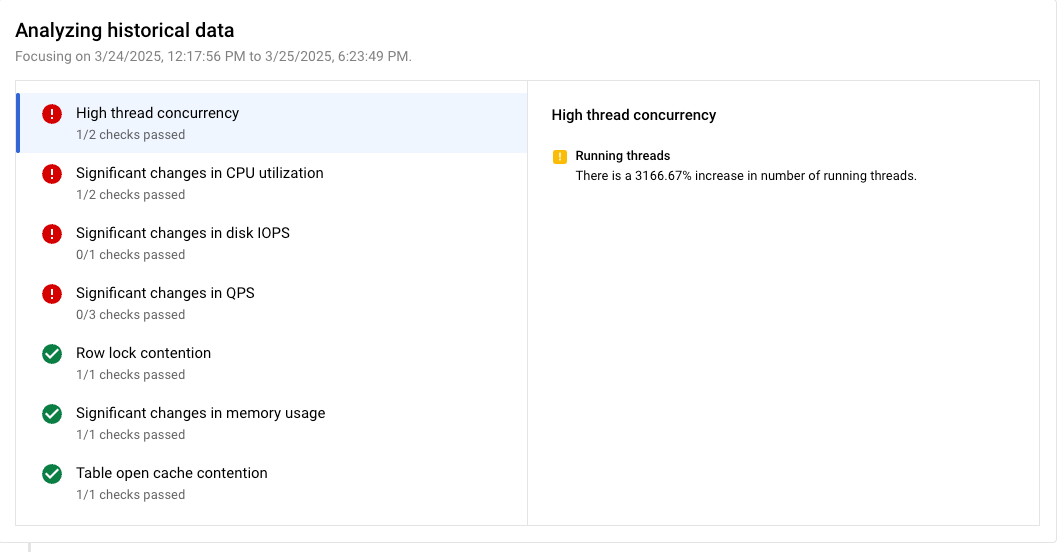
Evidence
For each situation, Cloud SQL provides a list of evidence to support the finding. Cloud SQL bases evidence on metrics gathered from the instance.
Each situation has supporting evidence that's used to detect anomalies in system performance. Cloud SQL detects an anomaly when system performance surpasses certain thresholds or meets specific time-bound criteria. Cloud SQL defines these thresholds or criteria for each situation.
To support the situations where significant changes in key metrics are detected, you might see the following pieces of evidence:
- Total QPS: Average changed from 18,534.22 to 37,619.86, p20 changed from 3.55 to 5.45, p80 changed from 5.62 to 112,050.8.
- Read QPS: Average changed from 1,802.98 to 3,657.93, p20 changed from 1.17 to 2.1, p80 changed from 2.12 to 10,908.8.
- Write QPS: Average changed from 1,751.61 to 3,553.48, p20 changed from 0.2 to 0.2, p80 changed from 0.2 to 10,600.13.
- Change in CPU Usage: Significant changes in CPU utilization detected. Average changed by 183.85%. p80 changed by 2,630.49%. p20 changed by 6.75%.
- Disk IOPS: Significant change in disk IOPS is detected. Average changed by 173.39%. p80 changed by 20,832.44%. p20 changed by 1.88%.
- Running threads: There is a 3,166.67% increase in number of running threads.
To view the evidence retrieved during analysis, click each situation. The evidence appears in the pane next to its corresponding situation.
Recommendations
Based on all of the situations analyzed, Cloud SQL provides you with one or more actionable recommendations to help remediate the problems of your high database load. Cloud SQL presents the recommendations with a cost-benefit analysis so you can make an informed decision on whether to implement the recommendation.
For some situations, based on the analysis, there might not a recommendation.
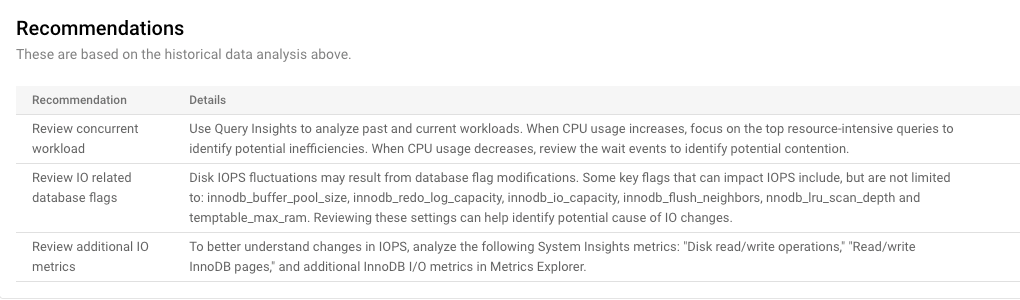
For example, you might receive the following recommendations:
Review concurrent workload: Use Query insights to analyze past and current workloads.
- When CPU usage increases, focus on the top resource-intensive queries to identify potential inefficiencies.
- When CPU usage decreases, review the wait events to identify potential contention.
Review IO related database flags: Disk IOPS fluctuations may result from database flag modifications.
Some key flags that can impact IOPS include, but are not limited to:
innodb_buffer_pool_sizeinnodb_redo_log_capacityinnodb_io_capacityinnodb_flush_neighborsinnodb_lru_scan_depthtemptable_max_ram
Reviewing these settings can help identify potential cause of IO changes.
Review additional IO metrics: To better understand changes in IOPS, analyze the following System Insights metrics:
Disk read/write operationsRead/write InnoDB pages
In addition, review other InnoDB I/O metrics in Metrics Explorer.
If you want to continue troubleshooting or get more assistance with system performance, then you can also open Gemini Cloud Assist. For more information, see Observe and troubleshoot with AI assistance.
What's next
- Monitor active queries
- Optimize high CPU usage
- Optimize high memory usage
- Use system insights to improve system performance