Mit Sammlungen den Überblick behalten
Sie können Inhalte basierend auf Ihren Einstellungen speichern und kategorisieren.
Flame-Diagramme
Cloud Profiler zeigt Profildaten in Form von Flame-Diagrammen an. Im Gegensatz zu Baumdiagrammen und Grafiken nutzen Flame-Diagramme den Bildschirmbereich effizient aus, da sie eine große Menge an Informationen in einem kompakten und lesbaren Format darstellen.
Zur Einführung in Flame-Diagramme wird auf dieser Seite veranschaulicht, wie ein Baumdiagramm in ein Flame-Diagramm umgewandelt wird. Außerdem werden die wichtigsten Merkmale von Flame-Diagrammen zusammengefasst.
Flame-Diagramm erstellen
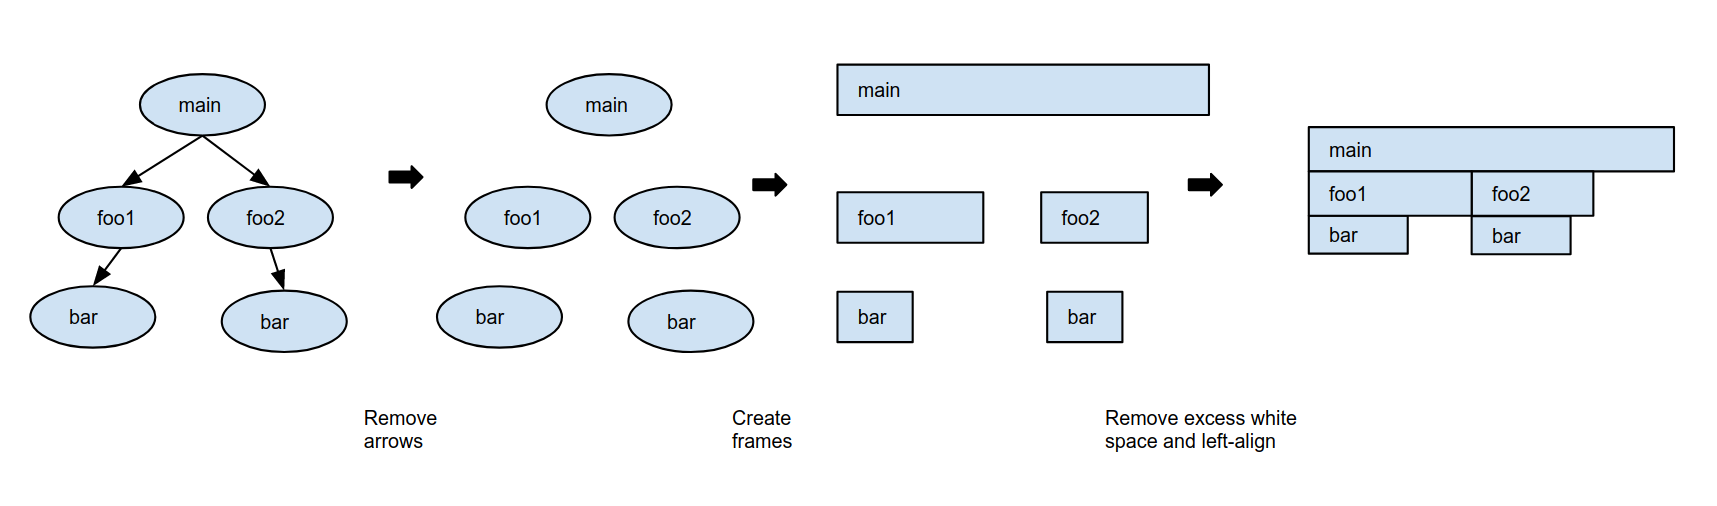
Führen Sie die im folgenden Diagramm dargestellten Schritte aus, um ein Baumdiagramm in ein Flame-Diagramm umzuwandeln:
Entfernen Sie die Pfeile, die auf Funktionsaufrufe hinweisen, aus dem Baumdiagramm.
Ersetzen Sie jeden Baumknoten durch einen Frame.
Frames haben eine rechteckige Form und immer die gleiche Höhe.
Für das Beispiel auf dieser Seite wird die Frame-Breite durch die CPU-Gesamtzeit bestimmt, die von der im Frame genannten Funktion verwendet wird.
Der Pseudocode für die einzelnen Funktionen wird in der folgenden Tabelle beschrieben. Die eigene CPU-Zeit wird durch die CPU-intensive Arbeit definiert, die während dem Ausführen einer Funktion aufgewendet wird:
Pseudocode der Funktion
Eigene CPU-Zeit ("self") (Sekunden)
CPU-Gesamtzeit ("total") (Sekunden)
func main():
     foo1()
     foo2()
     // CPU intensive work
     // for 2 seconds
2
4 + 3 + 2 = 9
func foo1():
     bar()
     // CPU intensive work
     // for 1.5 seconds
1,5
2,5 + 1,5 = 4
func foo2():
     bar()
     // CPU intensive work
     // for 0.5 seconds
0,5
2,5 + 0,5 = 3
func bar():
     // CPU intensive work
     // for 2.5 seconds
2,5
2,5
Der nächste Schritt besteht darin, den vertikalen Abstand zwischen den Frames zu entfernen und die Frames linksbündig auszurichten, ohne die Aufrufsequenzen zu verändern.
Optional können Sie ein Farbschema definieren und die Frames entsprechend der Definition farblich darstellen. Sie können Frames beispielsweise nach Paket, CPU-Gesamtzeit, eigene CPU-Zeit oder nach einem anderen Messwert farblich hervorheben.
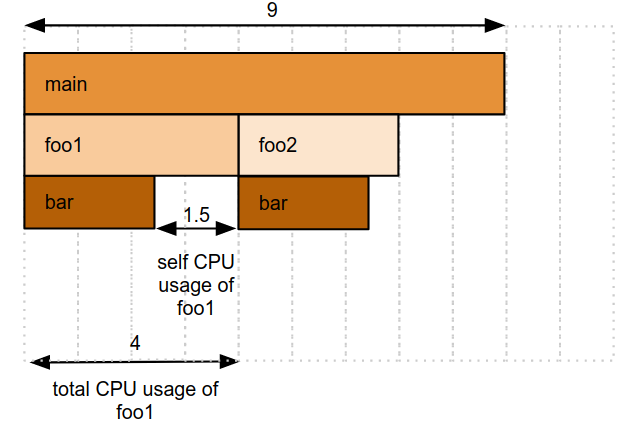
Nachdem die überschüssigen Leerräume entfernt und die Frames farblich nach der eigenen CPU-Zeit hervorgehoben wurden, sieht das Flame-Diagramm nun so aus:
Beachten Sie, dass die Aufrufstacks für foo1 und foo2 beibehalten wurden, obwohl der Aufrufstack, der mit foo2 beginnt, jetzt neben dem Frame für foo1 angezeigt wird.
Fazit
Mit diesem einfachen Beispiel wird Folgendes veranschaulicht:
Flame-Diagramme sind eine kompakte Darstellung eines Baumdiagramms. Aufrufstacks können neu erstellt werden. Hierzu folgen Sie den Frames von oben nach unten.
Frames benennen eine Funktion; die Frame-Breite ist das relative Maß für die CPU-Gesamtzeit dieser Funktion.
In diesem Beispiel hat der Frame für foo2 ein Drittel der Breite des Frames für main, da die CPU-Gesamtzeit von foo2 ein Drittel der CPU-Gesamtzeit von main beträgt.
Die Breite des leeren Bereichs unter einem Frame ist das relative Maß für die eigene CPU-Zeit der im Frame genannten Funktion.
Beispielsweise sind 1,5 Einheiten unter dem Frame foo1 leer und 2,5 Einheiten werden von bar belegt. Daher beträgt die eigene CPU-Zeit von foo1 37,5 % der CPU-Gesamtzeit bzw. 1,5 s.
Wenn Sie einem Aufrufstack folgen, nimmt die Breite der Frames ab, da die CPU-Gesamtzeit eines Aufgerufenen niemals mehr als die CPU-Gesamtzeit des Aufrufers betragen kann. Dieses Verhalten verursacht die Flammenform.
Im Beispiel wird bar von foo1 aufgerufen und die CPU-Gesamtzeit von foo1 wird als die CPU-Gesamtzeit von barplus die eigene CPU-Zeit von foo1 definiert. Daher kann die CPU-Gesamtzeit von bar nicht höher als die CPU-Gesamtzeit von foo1 sein.
[[["Leicht verständlich","easyToUnderstand","thumb-up"],["Mein Problem wurde gelöst","solvedMyProblem","thumb-up"],["Sonstiges","otherUp","thumb-up"]],[["Schwer verständlich","hardToUnderstand","thumb-down"],["Informationen oder Beispielcode falsch","incorrectInformationOrSampleCode","thumb-down"],["Benötigte Informationen/Beispiele nicht gefunden","missingTheInformationSamplesINeed","thumb-down"],["Problem mit der Übersetzung","translationIssue","thumb-down"],["Sonstiges","otherDown","thumb-down"]],["Zuletzt aktualisiert: 2025-09-04 (UTC)."],[],[],null,["# Flame graphs\n============\n\nCloud Profiler displays profiling data by using\n[Flame Graphs](http://www.brendangregg.com/flamegraphs.html). Unlike trees and graphs,\nflame graphs make efficient use of screen space by representing a large amount\nof information in a compact and readable format.\n\nTo introduce flame graphs, this page illustrates how to convert a tree\ninto a flame graph and summarizes key features of flame graphs.\n\nCreating a flame graph\n----------------------\n\nTo create a flame graph from a tree, complete the steps illustrated in the\nfollowing diagram:\n\n1. Remove from the tree the arrows that indicate function calls.\n\n2. Replace each tree node with a *frame*.\n\n Frames are rectangular in shape and all frames have the same height.\n For the example on this page, the total CPU time used by the function named\n in the frame determines the frame width.\n | **Key Point:** In profiling, a functions' *total CPU time* is the CPU time used by the function including the CPU time used by all functions it calls. A function's *self CPU time* is the CPU time used by a function excluding the CPU time used by the functions it calls.\n\n The pseudo code for each of the functions is described in the following\n table. The CPU intensive work performed during a function's execution\n defines the self CPU time:\n\n \u003cbr /\u003e\n\n3. The next step is to remove the *vertical* space between the frames\n and left align frames while preserving call sequences.\n Optionally, you can define a color scheme and color the frames according\n to the definition. For example, you can color frames by their package,\n by total CPU time, by self CPU time, or by a different measure.\n\n After removing excess whitespace and coloring frames by the self\n CPU time, the flame graph now appears as follows:\n\n Notice that the call stacks for `foo1` and `foo2`\n have been preserved, even though the call stack starting with `foo2` is\n now next to the frame for `foo1`.\n\nSummary\n-------\n\nThis simple example illustrates the following:\n\n- Flame graphs are a compact representation of a tree and you can recreate a call stack by tracing frames from the top downwards.\n- Frames name a function and the frame width is the relative measure of that function's total CPU time. In this example, because the total CPU time of `foo2` is one third of the total CPU time of `main`, the frame for `foo2` is one third the width of the frame for `main`.\n- The width of the empty space below a frame is the relative measure of the self CPU time for the function named in the frame. For example, below the frame `foo1`, 1.5 units are empty and 2.5 units are occupied by `bar`. Therefore the self CPU time of `foo1` is 37.5% of its total CPU time, or 1.5 s.\n- As you follow a call stack, the widths of the frames decrease because the\n total CPU time of a callee can never be more than the total CPU time\n of the caller. This behavior is what causes the flame shape.\n\n In the example, `foo1` calls `bar` and the total CPU time of `foo1`\n is defined to be the total CPU time of `bar` *plus* the self CPU time of\n `foo1`. Therefore, the total CPU time of `bar` cannot be more than the\n total CPU time of `foo1`.\n\nWhat's next\n-----------\n\n- [Select the profiles to analyze](/profiler/docs/selecting-profiles)\n- [Interact with the flame graph](/profiler/docs/interacting-flame-graph)\n- [Filter the flame graph](/profiler/docs/filtering-profiles)\n- [Focus the flame graph](/profiler/docs/focusing-profiles)\n- [Compare profiles](/profiler/docs/comparing-profiles)"]]