Pilih database yang diperlukan dari daftar database.
Di menu navigasi, klik Datastore Studio.
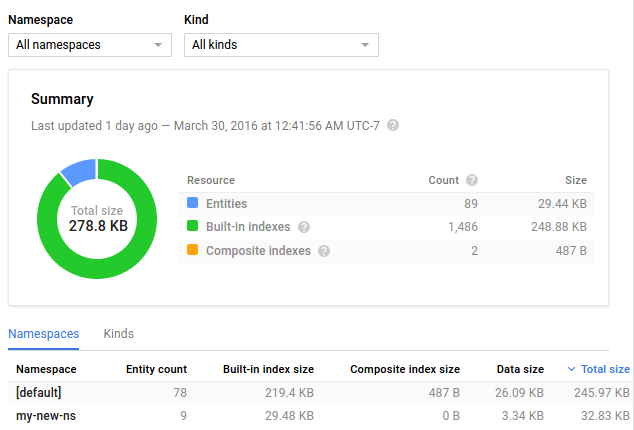
Jenis statistik
Halaman Dasbor menampilkan data dengan berbagai cara:
Diagram lingkaran yang menampilkan ruang yang digunakan oleh setiap jenis
properti, seperti string, double, atau blob.
Diagram lingkaran yang menampilkan ruang yang digunakan oleh jenis entity.
Tabel dengan total ruang yang digunakan oleh setiap jenis properti. Jenis properti "Metadata"
mewakili ruang yang terpakai oleh
properti penyimpanan di dalam entri yang tidak langsung digunakan oleh properti. Entity
"Datastore Stats", jika ada, menampilkan ruang yang digunakan oleh data statistik
itu sendiri di database Anda.
Tabel yang menampilkan ukuran total, ukuran rata-rata, jumlah entri, dan ukuran semua
entity, serta indeks bawaan dan komposit.
Secara default, diagram lingkaran menampilkan statistik untuk semua entitas. Anda dapat membatasi
diagram lingkaran untuk jenis entitas tertentu dengan memilih dari menu drop-down.
Batasan penyimpanan untuk statistik
Data statistik disimpan di instance Datastore aplikasi
Anda. Ruang yang digunakan oleh data statistik meningkat sebanding dengan
jumlah berbagai jenis entity dan jenis properti yang digunakan oleh
aplikasi Anda. Jika Anda menggunakan namespace, setiap namespace akan berisi salinan lengkap
statistik untuk namespace tersebut. Untuk menjaga overhead penyimpanan dan
memperbarui statistik secara wajar, database akan secara bertahap menghapus entity
statistik.
Untuk mengetahui detail tentang data statistik dan cara Datastore secara bertahap
menghapus entity statistik, lihat Statistik mode Datastore.
[[["Mudah dipahami","easyToUnderstand","thumb-up"],["Memecahkan masalah saya","solvedMyProblem","thumb-up"],["Lainnya","otherUp","thumb-up"]],[["Sulit dipahami","hardToUnderstand","thumb-down"],["Informasi atau kode contoh salah","incorrectInformationOrSampleCode","thumb-down"],["Informasi/contoh yang saya butuhkan tidak ada","missingTheInformationSamplesINeed","thumb-down"],["Masalah terjemahan","translationIssue","thumb-down"],["Lainnya","otherDown","thumb-down"]],["Terakhir diperbarui pada 2025-08-19 UTC."],[[["\u003cp\u003eThe Datastore Dashboard provides statistics on your application's data, accessible via the Google Cloud console's Databases page and then selecting Datastore Studio.\u003c/p\u003e\n"],["\u003cp\u003eStatistics are displayed through pie charts and tables, showing data usage by property type, entity kind, and overall space consumed by entities and indexes.\u003c/p\u003e\n"],["\u003cp\u003eThe statistics displayed include total space used, average size, entry count, and a breakdown of space usage by various property types, including metadata and datastore statistics themselves.\u003c/p\u003e\n"],["\u003cp\u003eWhile the charts show data for all entities by default, users can filter them to display data for a specific entity kind using a drop-down menu.\u003c/p\u003e\n"],["\u003cp\u003eStorage of statistics data depends on the number of different entity kinds, property types, and namespaces, and the database will progressively drop statistics entities to maintain reasonable storage overhead.\u003c/p\u003e\n"]]],[],null,["# Viewing Statistics in the Console\n\nThis page describes details of the statistics shown in the Datastore\nDashboard.\n\nViewing the statistics\n----------------------\n\nView statistics for your application's data in the Datastore\nDashboard.\n\n1. In the Google Cloud console, go to the **Databases** page.\n\n [Go to Databases](https://console.cloud.google.com/datastore/databases)\n2. Select the required database from the list of databases.\n\n3. In the navigation menu, click **Datastore Studio**.\n\n| **Note:** While Datastore removes individual entities almost immediately, a namespace container may remain visible for several days to a week after the final entity within it is removed.\n\nTypes of statistics\n-------------------\n\nThe Dashboard page displays data in various ways:\n\n- A pie chart that shows space used by each property\n type, such as string, double, or blob.\n\n- A pie chart showing space used by entity kind.\n\n- A table with the total space used by each property type. The \"Metadata\"\n property type represents space consumed by storing\n properties inside an entry that is not used by the properties directly. The\n \"Datastore Stats\" entity, if any, shows the space consumed by the statistics\n data itself in your database.\n\n- A table showing total size, average size, entry count, and the size of all\n entities, and the built-in and composite indexes.\n\n| **Note:** Operations generated by Datastore Statistics count against your [quota](/datastore/docs/pricing).\n\nBy default, the pie charts display statistics for all entities. You can restrict\nthe pie charts to a particular entity kind by choosing from the drop-down menu.\n\nStorage limitations for statistics\n----------------------------------\n\nThe statistics data is stored in your application's Datastore\ninstance. The space consumed by the statistics data increases in proportion to\nthe number of different entity kinds and property types used by your\napplication. If you use namespaces, each namespace contains a complete copy of\nthe stats for that namespace. To keep the overhead of storing and updating the\nstatistics reasonable, the database progressively drops statistics\nentities.\n\nFor details on statistics data and how Datastore progressively\ndrops statistics entities, see [Datastore mode Statistics](/datastore/docs/concepts/stats)."]]