This page describes how to use the Query insights dashboard to detect and analyze query performance.
Query insights overview
Use the Query insights dashboard to monitor metrics-related queries. Based on the metrics, you can identify the most frequently used queries and queries with high latencies that might require optimization. Use the Query insights dashboard to help you with:
- Query performance optimization: identify queries with high latencies and that might need optimization.
- Query cost management: discover high-cost queries and optimize them to reduce costs.
- Query stats monitoring: track query stats over time.
Query insights data
Query insights includes data from the following API methods:
You can view data about the queries that use these methods for a given project, database, and time duration ranging from 10 minutes to 30 days. Data for queries with equivalent structures is captured under a single normalized query.
Query insights returns the following information about a query:
| Normalized query text | The query structure represented in text. |
| Execution count | Number of executions in the selected time window. |
| Error count | Number of errors in the selected time window. |
| Average execution duration(ms) | The average time in milliseconds it took the database to process the query. |
| Average number of results returned | The number of results returned by the query. Results include entities, kind IDs, projections, and aggregated buckets. |
| Average number of entities scanned | The number of entities scanned in a query. |
| Average number of index entries scanned | The number of index entries examined to execute the query. |
| Load by average time | Data to help filter for the top queries based on average latency. |
| Load by total (billable) read operations | Data to help filter for the top queries based on total billable read operations. |
Data granularity and retention
Data granularity depends on the duration specified:
- 10 minute granularity for intervals up to 4 days ago
- 1 hour granularity for intervals up to 30 days ago
The maximum data retention for Query insights is 30 days. 10-minute data is stored for 4 days, and hourly data is stored for 30 days.
Limitations
- Query insights data is delayed by one to two hours.
Pricing
There's no additional cost for Query insights.
Required roles
To get the permission that
you need to view the Query insights dashboard,
ask your administrator to grant you the
Datastore Viewer (roles/datastore.viewer)
IAM role on your project.
For more information about granting roles, see Manage access to projects, folders, and organizations.
This predefined role contains the
datastore.insights.get
permission,
which is required to
view the Query insights dashboard.
You might also be able to get this permission with custom roles or other predefined roles.
View Query insights
To view query insights for a Firestore in Datastore mode database, open the database Query insights pane in the Google Cloud console.
In the Google Cloud console, go to the Databases page.
From the list of databases, select a database.
In the navigation menu, click Query insights.
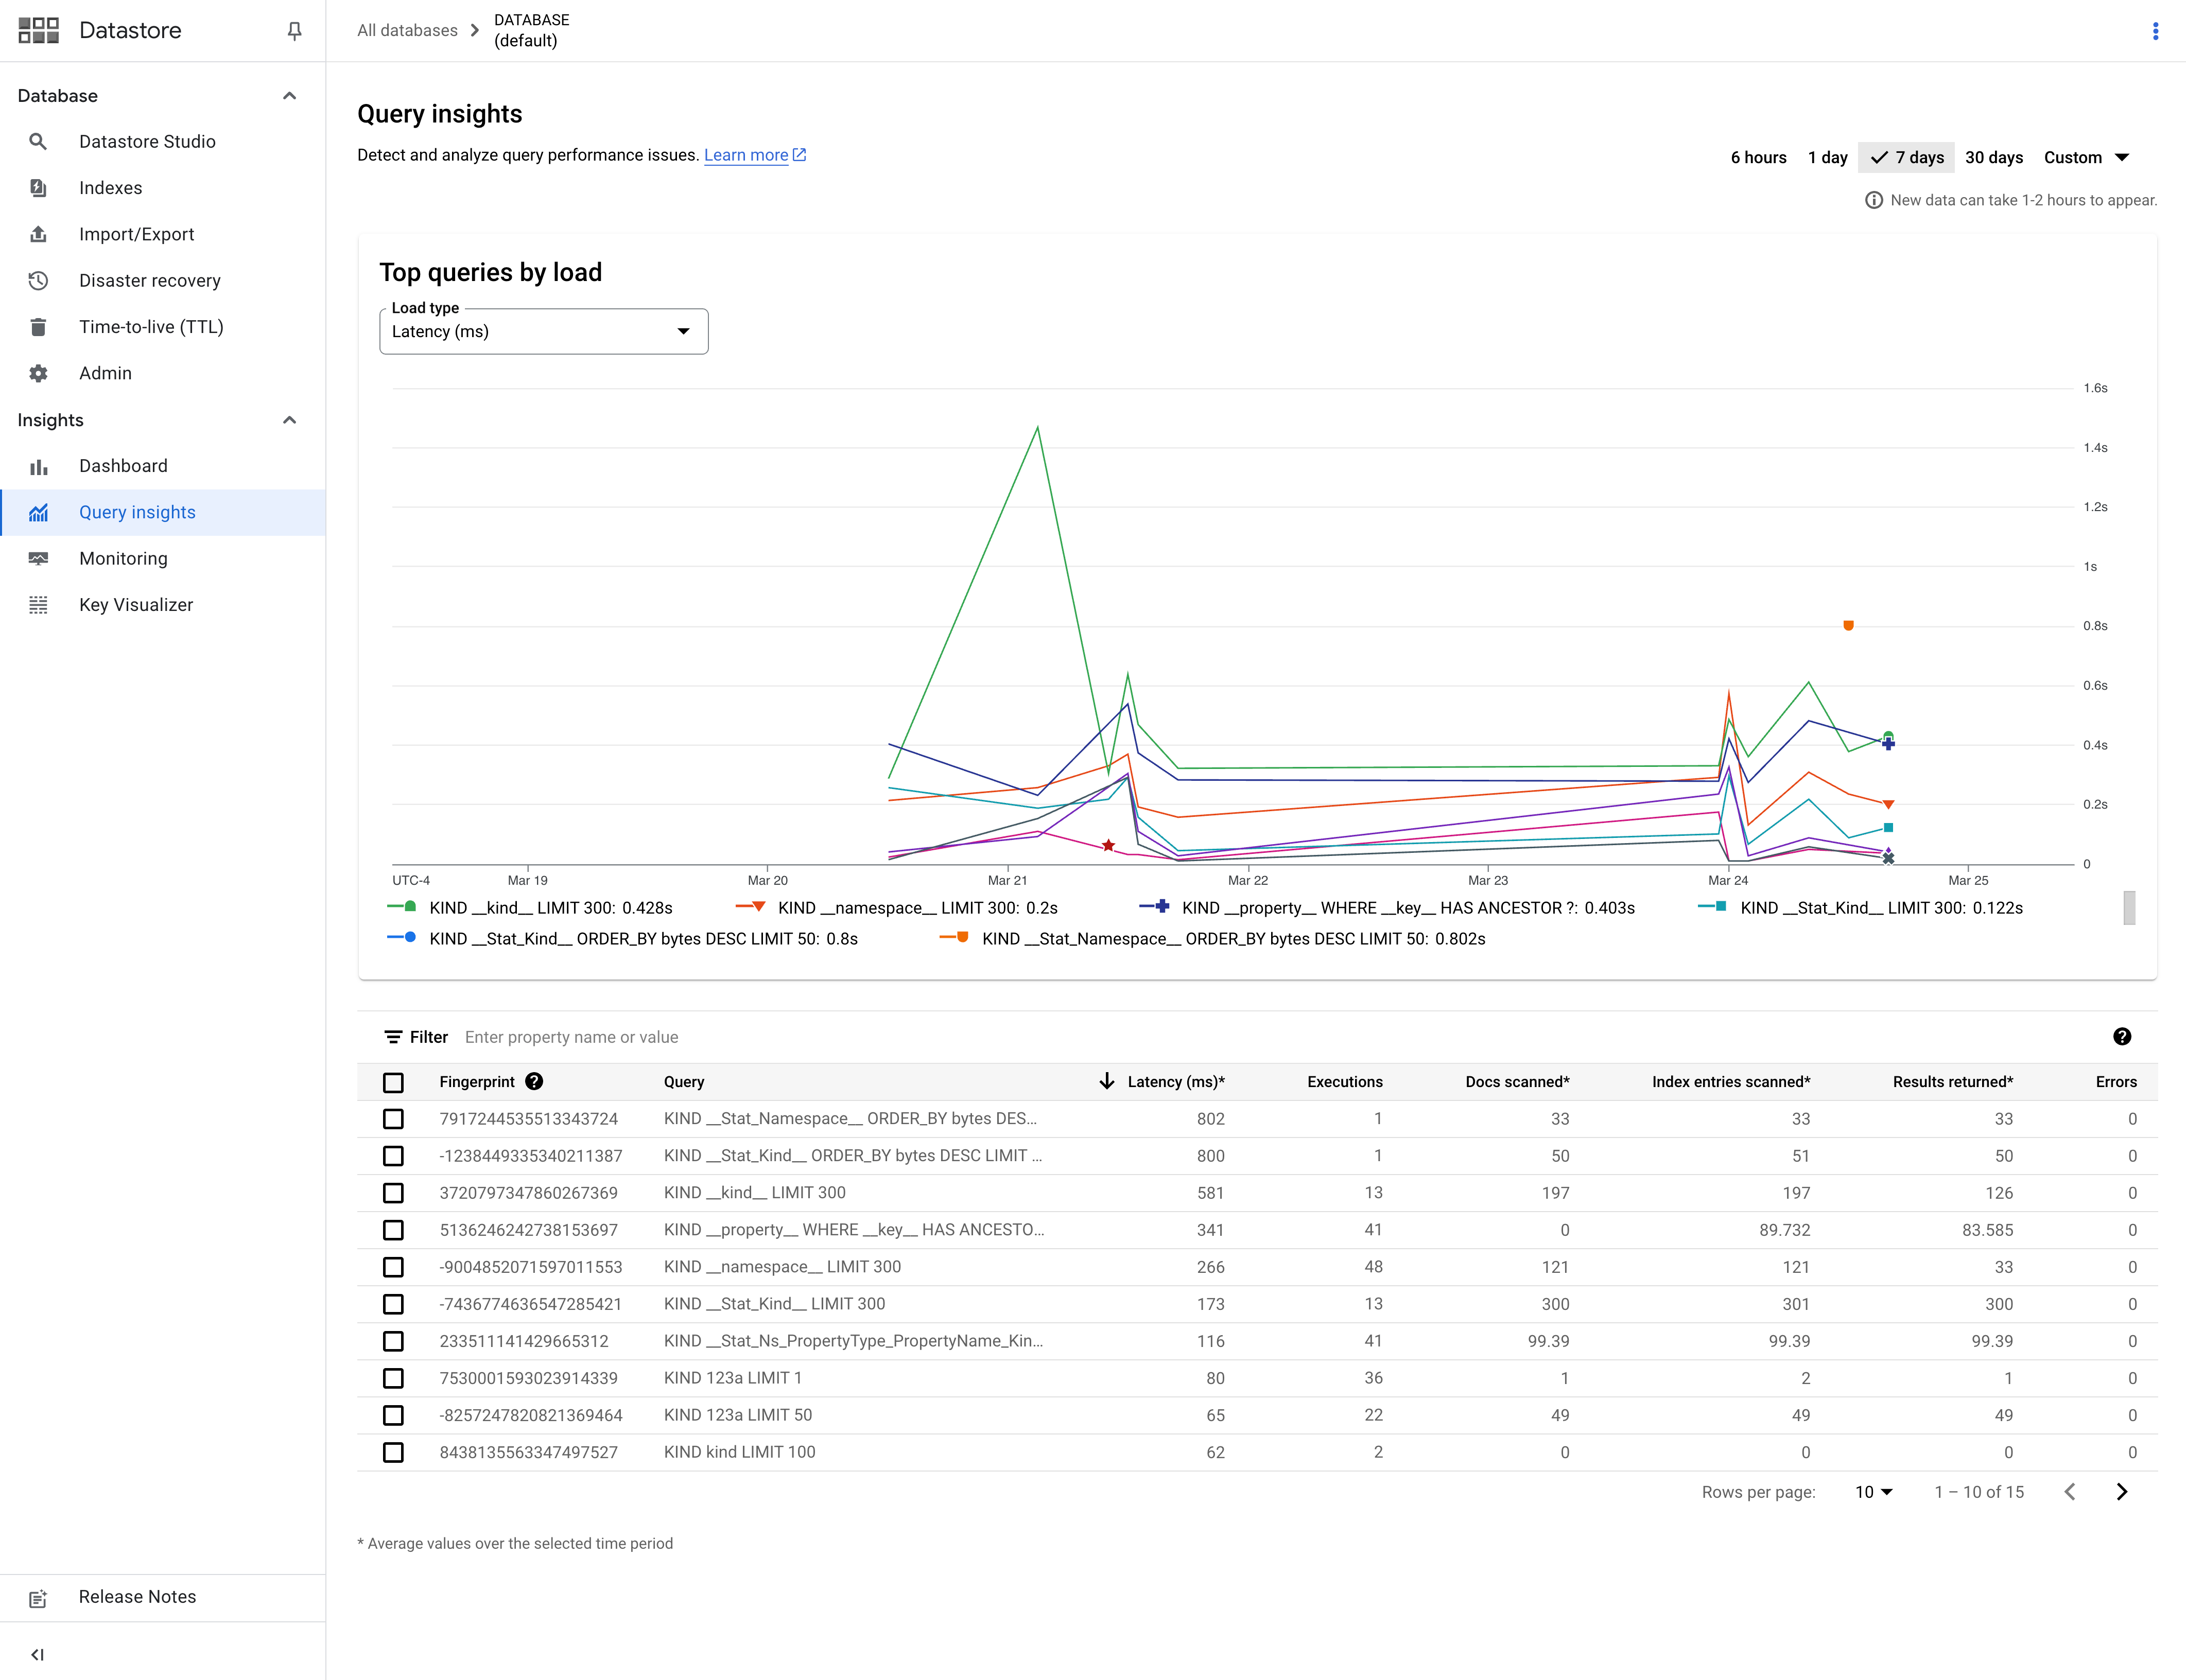
Use the Load type drop-down to find the top queries by either latency or number of read operations.
What's next
- Use query explain to improve query performance
- Monitor usage