Tetap teratur dengan koleksi
Simpan dan kategorikan konten berdasarkan preferensi Anda.
Setelah membuat aplikasi, Anda dapat mengaktifkan pemantauan
aplikasi selama langkah deployment, lalu melihat metrik tentang performa
aplikasi.
Men-deploy aplikasi dengan pemantauan diaktifkan
Setelah mem-build aplikasi menyeluruh dengan semua komponen yang diperlukan, Anda harus men-deploy aplikasi untuk mulai menggunakannya. Saat men-deploy, Anda memiliki
opsi untuk mengaktifkan pemantauan.
Pilih Lihat aplikasi di samping nama aplikasi Anda dari daftar.
Dari halaman builder grafik aplikasi, klik tombol Deploy.
Di menu Deploy application yang terbuka, pilih opsi lain
dan pilih check_boxEnable monitoring for this application.
Klik Deploy.
Setelah deployment selesai, akan ada tanda centang hijau di samping node.
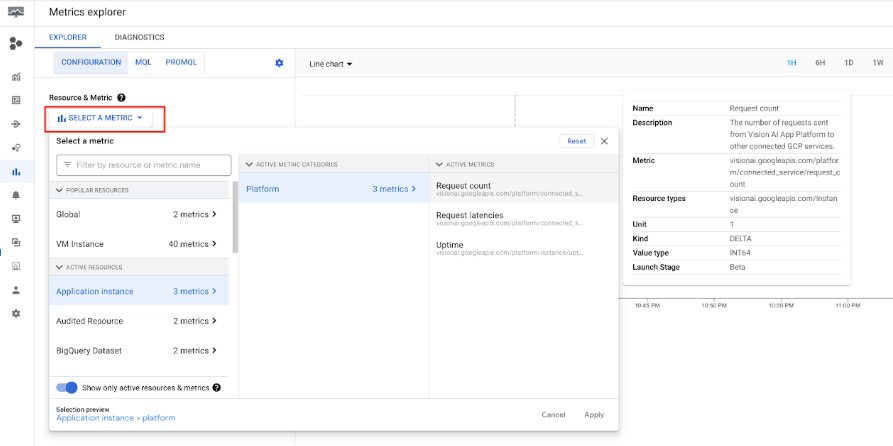
Melihat metrik pemantauan aplikasi
Setelah aplikasi di-deploy selama beberapa menit, Anda dapat mengakses beberapa metrik aplikasi, seperti grafik yang menunjukkan jumlah permintaan yang dibuat ke berbagai layanan eksternal (seperti fungsi BigQuery atau Cloud Run) dari berbagai model.
[[["Mudah dipahami","easyToUnderstand","thumb-up"],["Memecahkan masalah saya","solvedMyProblem","thumb-up"],["Lainnya","otherUp","thumb-up"]],[["Sulit dipahami","hardToUnderstand","thumb-down"],["Informasi atau kode contoh salah","incorrectInformationOrSampleCode","thumb-down"],["Informasi/contoh yang saya butuhkan tidak ada","missingTheInformationSamplesINeed","thumb-down"],["Masalah terjemahan","translationIssue","thumb-down"],["Lainnya","otherDown","thumb-down"]],["Terakhir diperbarui pada 2025-09-04 UTC."],[],[],null,["# Enable and use app monitoring\n\nAfter you [create an app](/vision-ai/docs/build-app) you can enable app\nmonitoring during the deployment step, and then view metrics about the app's\nperformance.\n\nDeploy an app with monitoring enabled\n-------------------------------------\n\nAfter you have built an end-to-end application with all the necessary\ncomponents you must deploy the app to start using it. When you deploy you have\nthe option to enable monitoring. \n\n### Console\n\n1. Open the **Applications** tab of the Vertex AI Vision dashboard.\n\n [Go to the Applications tab](https://console.cloud.google.com/ai/vision-ai/applications)\n2. Select **View app** next to the name of your application from the list.\n\n3. From the application graph builder page click the **Deploy** button.\n\n4. In the **Deploy application** menu that opens, select any other options\n and select check_box\n **Enable monitoring for this application**.\n\n5. Click **Deploy**.\n\n After\n deployment completes there will be green check marks next to the nodes.\n\nView app monitoring metrics\n---------------------------\n\nAfter an app has been deployed for several minutes, you can access some app\nmetrics, such as graphs indicating the request counts made to various external\nservices (such as BigQuery or Cloud Run functions) from various models. \n\n### Console\n\n1. Open the **Applications** tab of the Vertex AI Vision dashboard.\n\n [Go to the Applications tab](https://console.cloud.google.com/ai/vision-ai/applications)\n2. Select **View app** next to the name of your application from the list.\n\n3. From the application graph builder page click the\n insert_chart_outlined**View details**\n button.\n\n In this view you can see metrics, such as app request count and uptime.\n4. For a more detailed view, click the **Open Metrics Explorer** button.\n\n5. To view a specific metric, click **Select a metric** and choose the\n metric.\n\nWhat's next\n-----------\n\n- Read instructions about how to begin data ingestion from an app's input stream in [Create and manage streams](/vision-ai/docs/create-manage-streams#ingest-videos).\n- Learn how to list apps and view a deployed app's instances in [Managing applications](/vision-ai/docs/manage-app).\n- Learn how to read app input data from an ingestion stream or analyzed model output data in [Read stream data](/vision-ai/docs/read-stream)."]]