Pub/Sub OpenTelemetry tracing

OpenTelemetry tracing lets you identify and trace the latency of various Pub/Sub client library operations, such as batching, lease management, and flow control. Collecting this information can help you debug client library issues.

Some potential use cases for OpenTelemetry tracing including the following:

  • Your service is experiencing a higher publishing latency than normal.
  • You are experiencing a high number of message redeliveries.
  • A change to your subscriber client's callback function causes processing to take longer than usual.

Before you begin

Before configuring OpenTelemetry, complete the following tasks:

Required roles

To ensure that the service account has the necessary permissions to export traces to Cloud Trace, ask your administrator to grant the service account the following IAM roles on your project:

For more information about granting roles, see Manage access to projects, folders, and organizations.

These predefined roles contain the permissions required to export traces to Cloud Trace. To see the exact permissions that are required, expand the Required permissions section:

Required permissions

The following permissions are required to export traces to Cloud Trace:

  • All: cloudtrace.traces.patch

Your administrator might also be able to give the service account these permissions with custom roles or other predefined roles.

OpenTelemetry tracing workflow

To set up OpenTelemetry tracing, you use the Pub/Sub client libraries and the OpenTelemetry SDK. With the SDK, you must set up a trace exporter and a tracer provider, before connecting to the Pub/Sub libraries. In some libraries, setting up a tracer provider is optional.

  • Trace exporter. The OpenTelemetry SDK uses the trace exporter to determine where to send traces.

  • Tracer provider. The Pub/Sub client libraries use the tracer provider to create traces.

The following steps outline how to set up tracing:

  1. Instantiate a Cloud Trace OpenTelemetry exporter.
  2. If required, instantiate and register a Tracer Provider using the OpenTelemetery SDK.
  3. Configure your client with the enable OpenTelemetry tracing option.
  4. Use the Pub/Sub client libraries to publish a message.

How tracing works

For every message published, the client library creates a new trace. This trace represents the entire lifecycle of the message, from the moment you publish a message to when the message is acknowledged. A trace encapsulates information such as the duration of operations, parent spans and children spans, and linked spans.

A trace is made up of a root span and its corresponding child spans. These spans represent the work the client library does when processing a message. Each message trace contains the following:

  • For publishing. Flow control, ordering key scheduling, batching, and the length of the publish RPC.
  • For subscriptions. Concurrency control, ordering key scheduling, and lease management.

In order to propagate information from the publish to subscribe side, the client libraries inject a tracing specific attribute on the publish side. The context propagation mechanism is only enabled when tracing is turned on and is prepended with the googclient_ prefix.

Publish Messages with tracing

The following code sample shows you how to enable tracing by using the Pub/Sub client library and the OpenTelemetry SDK. In this sample, the tracing results are exported to Cloud Trace.

Considerations

When instantiating the tracer provider, you configure a sampling ratio with the OpenTelemetry SDK. This ratio determines how many traces the SDK should sample. A lower sampling rate can help reduce billing costs and prevent your service from exceeding the Cloud Trace span quota.

Go

import (
	"context"
	"fmt"
	"io"

	"cloud.google.com/go/pubsub"
	"go.opentelemetry.io/otel"
	"google.golang.org/api/option"

	texporter "github.com/GoogleCloudPlatform/opentelemetry-operations-go/exporter/trace"
	"go.opentelemetry.io/otel/sdk/resource"
	sdktrace "go.opentelemetry.io/otel/sdk/trace"
	semconv "go.opentelemetry.io/otel/semconv/v1.26.0"
)

// publishOpenTelemetryTracing publishes a single message with OpenTelemetry tracing
// enabled, exporting to Cloud Trace.
func publishOpenTelemetryTracing(w io.Writer, projectID, topicID string, sampling float64) error {
	// projectID := "my-project-id"
	// topicID := "my-topic"
	ctx := context.Background()

	exporter, err := texporter.New(texporter.WithProjectID(projectID),
		// Disable spans created by the exporter.
		texporter.WithTraceClientOptions(
			[]option.ClientOption{option.WithTelemetryDisabled()},
		),
	)
	if err != nil {
		return fmt.Errorf("error instantiating exporter: %w", err)
	}

	resources := resource.NewWithAttributes(
		semconv.SchemaURL,
		semconv.ServiceNameKey.String("publisher"),
	)

	// Instantiate a tracer provider with the following settings
	tp := sdktrace.NewTracerProvider(
		sdktrace.WithBatcher(exporter),
		sdktrace.WithResource(resources),
		sdktrace.WithSampler(
			sdktrace.ParentBased(sdktrace.TraceIDRatioBased(sampling)),
		),
	)

	defer tp.ForceFlush(ctx) // flushes any pending spans
	otel.SetTracerProvider(tp)

	// Create a new client with tracing enabled.
	client, err := pubsub.NewClientWithConfig(ctx, projectID, &pubsub.ClientConfig{
		EnableOpenTelemetryTracing: true,
	})
	if err != nil {
		return fmt.Errorf("pubsub: NewClient: %w", err)
	}
	defer client.Close()

	t := client.Topic(topicID)
	result := t.Publish(ctx, &pubsub.Message{
		Data: []byte("Publishing message with tracing"),
	})
	if _, err := result.Get(ctx); err != nil {
		return fmt.Errorf("pubsub: result.Get: %w", err)
	}
	fmt.Fprintln(w, "Published a traced message")
	return nil
}

C++

// Create a few namespace aliases to make the code easier to read.
namespace gc = ::google::cloud;
namespace otel = gc::otel;
namespace pubsub = gc::pubsub;

// This example uses a simple wrapper to export (upload) OTel tracing data
// to Google Cloud Trace. More complex applications may use different
// authentication, or configure their own OTel exporter.
auto project = gc::Project(project_id);
auto configuration = otel::ConfigureBasicTracing(project);

auto publisher = pubsub::Publisher(pubsub::MakePublisherConnection(
    pubsub::Topic(project_id, topic_id),
    // Configure this publisher to enable OTel tracing. Some applications may
    // chose to disable tracing in some publishers or to dynamically enable
    // this option based on their own configuration.
    gc::Options{}.set<gc::OpenTelemetryTracingOption>(true)));

// After this point, use the Cloud Pub/Sub C++ client library as usual.
// In this example, we will send a few messages and configure a callback
// action for each one.
std::vector<gc::future<void>> ids;
for (int i = 0; i < 5; i++) {
  auto id = publisher.Publish(pubsub::MessageBuilder().SetData("Hi!").Build())
                .then([](gc::future<gc::StatusOr<std::string>> f) {
                  auto id = f.get();
                  if (!id) {
                    std::cout << "Error in publish: " << id.status() << "\n";
                    return;
                  }
                  std::cout << "Sent message with id: (" << *id << ")\n";
                });
  ids.push_back(std::move(id));
}
// Block until the messages are actually sent.
for (auto& id : ids) id.get();

Python

Before trying this sample, follow the Python setup instructions in Quickstart: Using Client Libraries. For more information, see the Pub/Sub Python API reference documentation.


from opentelemetry import trace
from opentelemetry.sdk.trace import TracerProvider
from opentelemetry.sdk.trace.export import (
    BatchSpanProcessor,
)
from opentelemetry.exporter.cloud_trace import CloudTraceSpanExporter
from opentelemetry.sdk.trace.sampling import TraceIdRatioBased, ParentBased

from google.cloud.pubsub_v1 import PublisherClient
from google.cloud.pubsub_v1.types import PublisherOptions

# TODO(developer)
# topic_project_id = "your-topic-project-id"
# trace_project_id = "your-trace-project-id"
# topic_id = "your-topic-id"

# In this sample, we use a Google Cloud Trace to export the OpenTelemetry
# traces: https://cloud.google.com/trace/docs/setup/python-ot
# Choose and configure the exporter for your set up accordingly.

sampler = ParentBased(root=TraceIdRatioBased(1))
trace.set_tracer_provider(TracerProvider(sampler=sampler))

# Export to Google Trace.
cloud_trace_exporter = CloudTraceSpanExporter(
    project_id=trace_project_id,
)
trace.get_tracer_provider().add_span_processor(
    BatchSpanProcessor(cloud_trace_exporter)
)

# Set the `enable_open_telemetry_tracing` option to True when creating
# the publisher client. This in itself is necessary and sufficient for
# the library to export OpenTelemetry traces. However, where the traces
# must be exported to needs to be configured based on your OpenTelemetry
# set up. Refer: https://opentelemetry.io/docs/languages/python/exporters/
publisher = PublisherClient(
    publisher_options=PublisherOptions(
        enable_open_telemetry_tracing=True,
    ),
)

# The `topic_path` method creates a fully qualified identifier
# in the form `projects/{project_id}/topics/{topic_id}`
topic_path = publisher.topic_path(topic_project_id, topic_id)
# Publish messages.
for n in range(1, 10):
    data_str = f"Message number {n}"
    # Data must be a bytestring
    data = data_str.encode("utf-8")
    # When you publish a message, the client returns a future.
    future = publisher.publish(topic_path, data)
    print(future.result())

print(f"Published messages to {topic_path}.")

TypeScript

/**
 * TODO(developer): Uncomment these variables before running the sample.
 */
// const topicNameOrId = 'YOUR_TOPIC_OR_ID';
// const data = 'Hello, world!";

// Imports the Google Cloud client library
import {PubSub} from '@google-cloud/pubsub';

// Imports the OpenTelemetry API
import {NodeTracerProvider} from '@opentelemetry/sdk-trace-node';
import {diag, DiagConsoleLogger, DiagLogLevel} from '@opentelemetry/api';
import {SimpleSpanProcessor} from '@opentelemetry/sdk-trace-base';

// To output to the console for testing, use the ConsoleSpanExporter.
// import {ConsoleSpanExporter} from '@opentelemetry/sdk-trace-base';

// To output to Cloud Trace, import the OpenTelemetry bridge library.
import {TraceExporter} from '@google-cloud/opentelemetry-cloud-trace-exporter';

import {Resource} from '@opentelemetry/resources';
import {SEMRESATTRS_SERVICE_NAME} from '@opentelemetry/semantic-conventions';

// Enable the diagnostic logger for OpenTelemetry
diag.setLogger(new DiagConsoleLogger(), DiagLogLevel.DEBUG);

// Log spans out to the console, for testing.
// const exporter = new ConsoleSpanExporter();

// Log spans out to Cloud Trace, for production.
const exporter = new TraceExporter();

// Build a tracer provider and a span processor to do
// something with the spans we're generating.
const provider = new NodeTracerProvider({
  resource: new Resource({
    [SEMRESATTRS_SERVICE_NAME]: 'otel publisher example',
  }),
});
const processor = new SimpleSpanProcessor(exporter);
provider.addSpanProcessor(processor);
provider.register();

// Creates a client; cache this for further use.
const pubSubClient = new PubSub({enableOpenTelemetryTracing: true});

async function publishMessage(topicNameOrId: string, data: string) {
  // Publishes the message as a string, e.g. "Hello, world!"
  // or JSON.stringify(someObject)
  const dataBuffer = Buffer.from(data);
  const publisher = pubSubClient.topic(topicNameOrId);
  const messageId = await publisher.publishMessage({data: dataBuffer});
  console.log(`Message ${messageId} published.`);

  // The rest of the sample is in service to making sure that any
  // buffered Pub/Sub messages and/or OpenTelemetry spans are properly
  // flushed to the server side. In normal usage, you'd only need to do
  // something like this on process shutdown.
  await publisher.flush();
  await processor.forceFlush();
  await new Promise(r => setTimeout(r, OTEL_TIMEOUT * 1000));
}

Node.js

/**
 * TODO(developer): Uncomment these variables before running the sample.
 */
// const topicNameOrId = 'YOUR_TOPIC_OR_ID';
// const data = 'Hello, world!";

// Imports the Google Cloud client library
const {PubSub} = require('@google-cloud/pubsub');

// Imports the OpenTelemetry API
const {NodeTracerProvider} = require('@opentelemetry/sdk-trace-node');
const {diag, DiagConsoleLogger, DiagLogLevel} = require('@opentelemetry/api');
const {SimpleSpanProcessor} = require('@opentelemetry/sdk-trace-base');

// To output to the console for testing, use the ConsoleSpanExporter.
// import {ConsoleSpanExporter} from '@opentelemetry/sdk-trace-base';

// To output to Cloud Trace, import the OpenTelemetry bridge library.
const {
  TraceExporter,
} = require('@google-cloud/opentelemetry-cloud-trace-exporter');

const {Resource} = require('@opentelemetry/resources');
const {
  SEMRESATTRS_SERVICE_NAME,
} = require('@opentelemetry/semantic-conventions');

// Enable the diagnostic logger for OpenTelemetry
diag.setLogger(new DiagConsoleLogger(), DiagLogLevel.DEBUG);

// Log spans out to the console, for testing.
// const exporter = new ConsoleSpanExporter();

// Log spans out to Cloud Trace, for production.
const exporter = new TraceExporter();

// Build a tracer provider and a span processor to do
// something with the spans we're generating.
const provider = new NodeTracerProvider({
  resource: new Resource({
    [SEMRESATTRS_SERVICE_NAME]: 'otel publisher example',
  }),
});
const processor = new SimpleSpanProcessor(exporter);
provider.addSpanProcessor(processor);
provider.register();

// Creates a client; cache this for further use.
const pubSubClient = new PubSub({enableOpenTelemetryTracing: true});

async function publishMessage(topicNameOrId, data) {
  // Publishes the message as a string, e.g. "Hello, world!"
  // or JSON.stringify(someObject)
  const dataBuffer = Buffer.from(data);
  const publisher = pubSubClient.topic(topicNameOrId);
  const messageId = await publisher.publishMessage({data: dataBuffer});
  console.log(`Message ${messageId} published.`);

  // The rest of the sample is in service to making sure that any
  // buffered Pub/Sub messages and/or OpenTelemetry spans are properly
  // flushed to the server side. In normal usage, you'd only need to do
  // something like this on process shutdown.
  await publisher.flush();
  await processor.forceFlush();
  await new Promise(r => setTimeout(r, OTEL_TIMEOUT * 1000));
}

Receive messages with tracing

Go

import (
	"context"
	"fmt"
	"io"
	"sync/atomic"
	"time"

	"cloud.google.com/go/pubsub"
	texporter "github.com/GoogleCloudPlatform/opentelemetry-operations-go/exporter/trace"
	"go.opentelemetry.io/otel"
	"go.opentelemetry.io/otel/sdk/resource"
	sdktrace "go.opentelemetry.io/otel/sdk/trace"
	semconv "go.opentelemetry.io/otel/semconv/v1.24.0"
	"google.golang.org/api/option"
)

func subscribeOpenTelemetryTracing(w io.Writer, projectID, subID string, sampleRate float64) error {
	// projectID := "my-project-id"
	// subID := "my-sub"
	// sampleRate := "1.0"
	ctx := context.Background()

	exporter, err := texporter.New(texporter.WithProjectID(projectID),
		// Disable spans created by the exporter.
		texporter.WithTraceClientOptions(
			[]option.ClientOption{option.WithTelemetryDisabled()},
		),
	)
	if err != nil {
		return fmt.Errorf("error instantiating exporter: %w", err)
	}

	resources := resource.NewWithAttributes(
		semconv.SchemaURL,
		semconv.ServiceNameKey.String("subscriber"),
	)

	// Instantiate a tracer provider with the following settings
	tp := sdktrace.NewTracerProvider(
		sdktrace.WithBatcher(exporter),
		sdktrace.WithResource(resources),
		sdktrace.WithSampler(
			sdktrace.ParentBased(sdktrace.TraceIDRatioBased(sampleRate)),
		),
	)

	defer tp.ForceFlush(ctx) // flushes any pending spans
	otel.SetTracerProvider(tp)

	// Create a new client with tracing enabled.
	client, err := pubsub.NewClientWithConfig(ctx, projectID, &pubsub.ClientConfig{
		EnableOpenTelemetryTracing: true,
	})
	if err != nil {
		return fmt.Errorf("pubsub.NewClient: %w", err)
	}
	defer client.Close()

	sub := client.Subscription(subID)

	// Receive messages for 10 seconds, which simplifies testing.
	// Comment this out in production, since `Receive` should
	// be used as a long running operation.
	ctx, cancel := context.WithTimeout(ctx, 10*time.Second)
	defer cancel()

	var received int32
	err = sub.Receive(ctx, func(_ context.Context, msg *pubsub.Message) {
		fmt.Fprintf(w, "Got message: %q\n", string(msg.Data))
		atomic.AddInt32(&received, 1)
		msg.Ack()
	})
	if err != nil {
		return fmt.Errorf("sub.Receive: %w", err)
	}
	fmt.Fprintf(w, "Received %d messages\n", received)

	return nil
}

C++

#include "google/cloud/opentelemetry/configure_basic_tracing.h"
#include "google/cloud/opentelemetry_options.h"
#include "google/cloud/pubsub/message.h"
#include "google/cloud/pubsub/publisher.h"
#include "google/cloud/pubsub/subscriber.h"
#include "google/cloud/pubsub/subscription.h"
#include <iostream>

int main(int argc, char* argv[]) try {
  if (argc != 4) {
    std::cerr << "Usage: " << argv[0]
              << " <project-id> <topic-id> <subscription-id>\n";
    return 1;
  }

  std::string const project_id = argv[1];
  std::string const topic_id = argv[2];
  std::string const subscription_id = argv[3];

  // Create a few namespace aliases to make the code easier to read.
  namespace gc = ::google::cloud;
  namespace otel = gc::otel;
  namespace pubsub = gc::pubsub;

  auto constexpr kWaitTimeout = std::chrono::seconds(30);

  auto project = gc::Project(project_id);
  auto configuration = otel::ConfigureBasicTracing(project);

  // Publish a message with tracing enabled.
  auto publisher = pubsub::Publisher(pubsub::MakePublisherConnection(
      pubsub::Topic(project_id, topic_id),
      gc::Options{}.set<gc::OpenTelemetryTracingOption>(true)));
  // Block until the message is actually sent and throw on error.
  auto id = publisher.Publish(pubsub::MessageBuilder().SetData("Hi!").Build())
                .get()
                .value();
  std::cout << "Sent message with id: (" << id << ")\n";

  // Receive a message using streaming pull with tracing enabled.
  auto subscriber = pubsub::Subscriber(pubsub::MakeSubscriberConnection(
      pubsub::Subscription(project_id, subscription_id),
      gc::Options{}.set<gc::OpenTelemetryTracingOption>(true)));

  auto session =
      subscriber.Subscribe([&](pubsub::Message const& m, pubsub::AckHandler h) {
        std::cout << "Received message " << m << "\n";
        std::move(h).ack();
      });

  std::cout << "Waiting for messages on " + subscription_id + "...\n";

  // Blocks until the timeout is reached.
  auto result = session.wait_for(kWaitTimeout);
  if (result == std::future_status::timeout) {
    std::cout << "timeout reached, ending session\n";
    session.cancel();
  }

  return 0;
} catch (google::cloud::Status const& status) {
  std::cerr << "google::cloud::Status thrown: " << status << "\n";
  return 1;
}

Python

from opentelemetry import trace
from opentelemetry.sdk.trace import TracerProvider
from opentelemetry.sdk.trace.export import (
    BatchSpanProcessor,
)
from opentelemetry.exporter.cloud_trace import CloudTraceSpanExporter
from opentelemetry.sdk.trace.sampling import TraceIdRatioBased, ParentBased

from google.cloud import pubsub_v1
from google.cloud.pubsub_v1 import SubscriberClient
from google.cloud.pubsub_v1.types import SubscriberOptions

# TODO(developer)
# subscription_project_id = "your-subscription-project-id"
# subscription_id = "your-subscription-id"
# cloud_trace_project_id = "your-cloud-trace-project-id"
# timeout = 300.0

# In this sample, we use a Google Cloud Trace to export the OpenTelemetry
# traces: https://cloud.google.com/trace/docs/setup/python-ot
# Choose and configure the exporter for your set up accordingly.

sampler = ParentBased(root=TraceIdRatioBased(1))
trace.set_tracer_provider(TracerProvider(sampler=sampler))

# Export to Google Trace
cloud_trace_exporter = CloudTraceSpanExporter(
    project_id=cloud_trace_project_id,
)
trace.get_tracer_provider().add_span_processor(
    BatchSpanProcessor(cloud_trace_exporter)
)
# Set the `enable_open_telemetry_tracing` option to True when creating
# the subscriber client. This in itself is necessary and sufficient for
# the library to export OpenTelemetry traces. However, where the traces
# must be exported to needs to be configured based on your OpenTelemetry
# set up. Refer: https://opentelemetry.io/docs/languages/python/exporters/
subscriber = SubscriberClient(
    subscriber_options=SubscriberOptions(enable_open_telemetry_tracing=True)
)

# The `subscription_path` method creates a fully qualified identifier
# in the form `projects/{project_id}/subscriptions/{subscription_id}`
subscription_path = subscriber.subscription_path(
    subscription_project_id, subscription_id
)

# Define callback to be called when a message is received.
def callback(message: pubsub_v1.subscriber.message.Message) -> None:
    # Ack message after processing it.
    print(message.data)
    message.ack()

# Wrap subscriber in a 'with' block to automatically call close() when done.
with subscriber:
    try:
        # Optimistically subscribe to messages on the subscription.
        streaming_pull_future = subscriber.subscribe(
            subscription_path, callback=callback
        )
        streaming_pull_future.result(timeout=timeout)
    except TimeoutError:
        print("Successfully subscribed until the timeout passed.")
        streaming_pull_future.cancel()  # Trigger the shutdown.
        streaming_pull_future.result()  # Block until the shutdown is complete.

TypeScript

/**
 * TODO(developer): Uncomment these variables before running the sample.
 */
// const subscriptionNameOrId = 'YOUR_SUBSCRIPTION_OR_ID';

// Imports the Google Cloud client library
import {Message, PubSub} from '@google-cloud/pubsub';

// Imports the OpenTelemetry API
import {NodeTracerProvider} from '@opentelemetry/sdk-trace-node';
import {diag, DiagConsoleLogger, DiagLogLevel} from '@opentelemetry/api';
import {SimpleSpanProcessor} from '@opentelemetry/sdk-trace-base';

// To output to the console for testing, use the ConsoleSpanExporter.
// import {ConsoleSpanExporter} from '@opentelemetry/sdk-trace-base';

// To output to Cloud Trace, import the OpenTelemetry bridge library.
import {TraceExporter} from '@google-cloud/opentelemetry-cloud-trace-exporter';

import {Resource} from '@opentelemetry/resources';
import {SEMRESATTRS_SERVICE_NAME} from '@opentelemetry/semantic-conventions';

// Enable the diagnostic logger for OpenTelemetry
diag.setLogger(new DiagConsoleLogger(), DiagLogLevel.DEBUG);

// Log spans out to the console, for testing.
// const exporter = new ConsoleSpanExporter();

// Log spans out to Cloud Trace, for production.
const exporter = new TraceExporter();

// Build a tracer provider and a span processor to do
// something with the spans we're generating.
const provider = new NodeTracerProvider({
  resource: new Resource({
    [SEMRESATTRS_SERVICE_NAME]: 'otel subscriber example',
  }),
});
const processor = new SimpleSpanProcessor(exporter);
provider.addSpanProcessor(processor);
provider.register();

// Creates a client; cache this for further use.
const pubSubClient = new PubSub({enableOpenTelemetryTracing: true});

async function subscriptionListen(subscriptionNameOrId: string) {
  const subscriber = pubSubClient.subscription(subscriptionNameOrId);

  // Message handler for subscriber
  const messageHandler = async (message: Message) => {
    console.log(`Message ${message.id} received.`);
    message.ack();
  };

  // Error handler for subscriber
  const errorHandler = async (error: Error) => {
    console.log('Received error:', error);
  };

  // Listens for new messages from the topic
  subscriber.on('message', messageHandler);
  subscriber.on('error', errorHandler);

  // Ensures that all spans got flushed by the exporter. This function
  // is in service to making sure that any buffered Pub/Sub messages
  // and/or OpenTelemetry spans are properly flushed to the server
  // side. In normal usage, you'd only need to do something like this
  // on process shutdown.
  async function shutdown() {
    await subscriber.close();
    await processor.forceFlush();
    await new Promise(r => setTimeout(r, OTEL_TIMEOUT * 1000));
  }

  // Wait a bit for the subscription to receive messages, then shut down
  // gracefully. This is for the sample only; normally you would not need
  // this delay.
  await new Promise<void>(r =>
    setTimeout(async () => {
      subscriber.removeAllListeners();
      await shutdown();
      r();
    }, SUBSCRIBER_TIMEOUT * 1000)
  );
}

Node.js

/**
 * TODO(developer): Uncomment these variables before running the sample.
 */
// const subscriptionNameOrId = 'YOUR_SUBSCRIPTION_OR_ID';

// Imports the Google Cloud client library
const {PubSub} = require('@google-cloud/pubsub');

// Imports the OpenTelemetry API
const {NodeTracerProvider} = require('@opentelemetry/sdk-trace-node');
const {diag, DiagConsoleLogger, DiagLogLevel} = require('@opentelemetry/api');
const {SimpleSpanProcessor} = require('@opentelemetry/sdk-trace-base');

// To output to the console for testing, use the ConsoleSpanExporter.
// import {ConsoleSpanExporter} from '@opentelemetry/sdk-trace-base';

// To output to Cloud Trace, import the OpenTelemetry bridge library.
const {
  TraceExporter,
} = require('@google-cloud/opentelemetry-cloud-trace-exporter');

const {Resource} = require('@opentelemetry/resources');
const {
  SEMRESATTRS_SERVICE_NAME,
} = require('@opentelemetry/semantic-conventions');

// Enable the diagnostic logger for OpenTelemetry
diag.setLogger(new DiagConsoleLogger(), DiagLogLevel.DEBUG);

// Log spans out to the console, for testing.
// const exporter = new ConsoleSpanExporter();

// Log spans out to Cloud Trace, for production.
const exporter = new TraceExporter();

// Build a tracer provider and a span processor to do
// something with the spans we're generating.
const provider = new NodeTracerProvider({
  resource: new Resource({
    [SEMRESATTRS_SERVICE_NAME]: 'otel subscriber example',
  }),
});
const processor = new SimpleSpanProcessor(exporter);
provider.addSpanProcessor(processor);
provider.register();

// Creates a client; cache this for further use.
const pubSubClient = new PubSub({enableOpenTelemetryTracing: true});

async function subscriptionListen(subscriptionNameOrId) {
  const subscriber = pubSubClient.subscription(subscriptionNameOrId);

  // Message handler for subscriber
  const messageHandler = async message => {
    console.log(`Message ${message.id} received.`);
    message.ack();
  };

  // Error handler for subscriber
  const errorHandler = async error => {
    console.log('Received error:', error);
  };

  // Listens for new messages from the topic
  subscriber.on('message', messageHandler);
  subscriber.on('error', errorHandler);

  // Ensures that all spans got flushed by the exporter. This function
  // is in service to making sure that any buffered Pub/Sub messages
  // and/or OpenTelemetry spans are properly flushed to the server
  // side. In normal usage, you'd only need to do something like this
  // on process shutdown.
  async function shutdown() {
    await subscriber.close();
    await processor.forceFlush();
    await new Promise(r => setTimeout(r, OTEL_TIMEOUT * 1000));
  }

  // Wait a bit for the subscription to receive messages, then shut down
  // gracefully. This is for the sample only; normally you would not need
  // this delay.
  await new Promise(r =>
    setTimeout(async () => {
      subscriber.removeAllListeners();
      await shutdown();
      r();
    }, SUBSCRIBER_TIMEOUT * 1000)
  );
}

Analyze a trace

The following sections contain detailed information about how to track and analyze a trace in the Google Cloud console.

Considerations

  • When publishing a batch of messages, the publish RPC span is captured in a separate trace.
  • A publish RPC has multiple origin spans, since multiple create calls can result in a publish RPC when they are batched together.
  • Spans in OpenTelemetry can have zero or one parent spans.

    Spans representing batched operations, such a publish batch, (which logically should have multiple parents) can't be represented using zero or one parent spans.

Track spans created during the message lifecycle

The following image shows an example of spans that are created in a single trace for a single message.

View spans in tracing

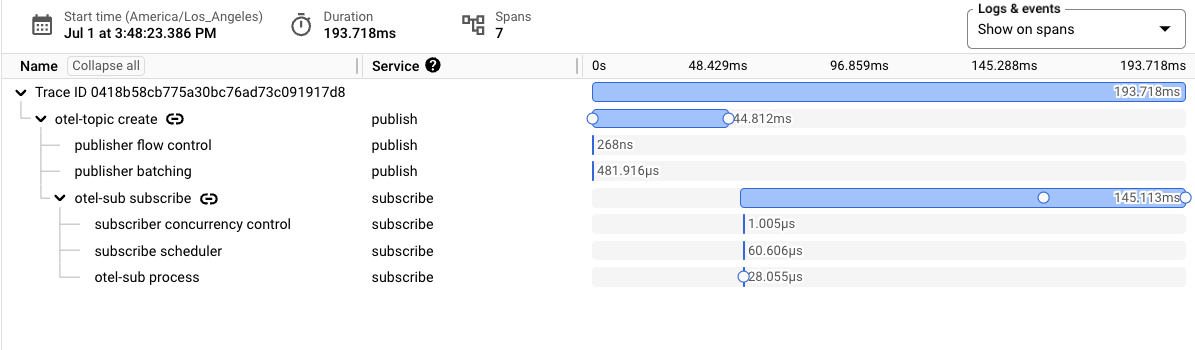
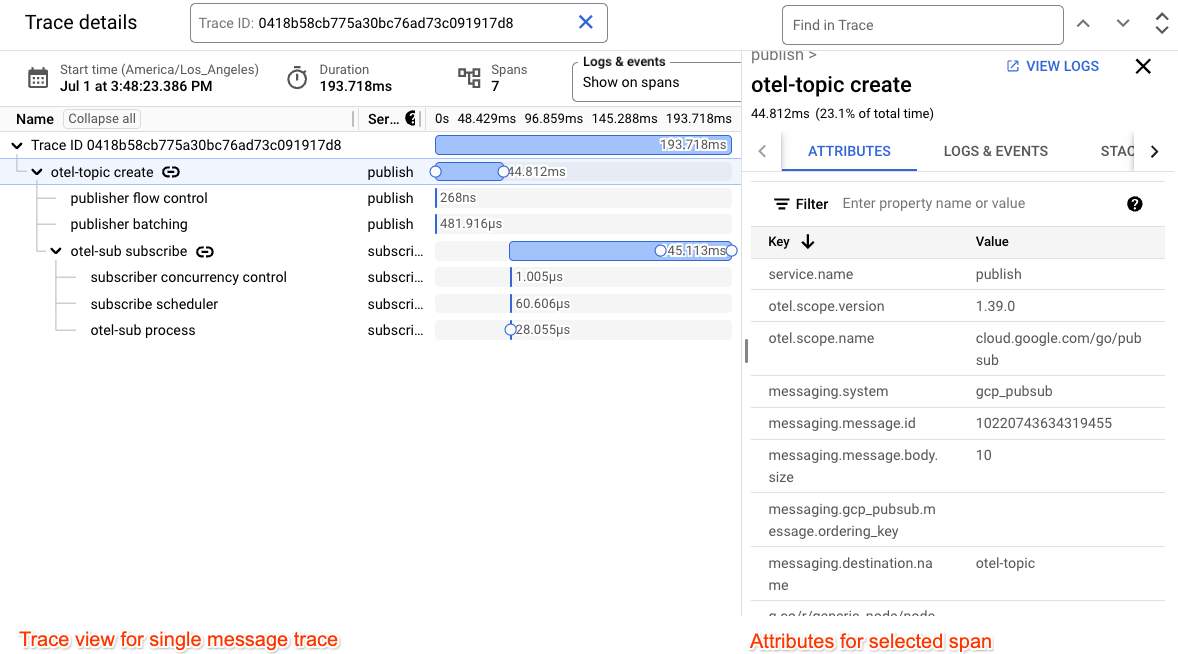
Each span can have additional attributes that provide additional information, such as message byte size and ordering key information.

View spans in tracing

Span attributes convey additional metadata such as the message's ordering key, the message ID, and the size of the message.

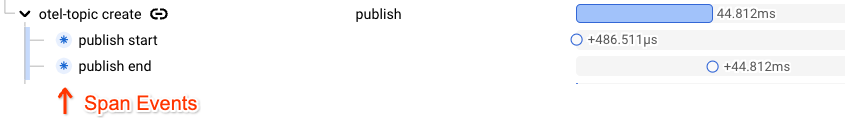
The main publish and subscribe spans are augmented with span events which corresponds to when a network call is issued and when it is completed.

View spans in tracing

Troubleshoot common issues

The following issues issues can cause problems with tracing:

  • The service account that you use for exporting traces doesn't have the required roles/cloudtrace.agent role.
  • The quota of the maximum number of ingested spans in Cloud Trace has been reached.
  • Your application is terminated without calling the appropriate flush function.

What's next