Tetap teratur dengan koleksi
Simpan dan kategorikan konten berdasarkan preferensi Anda.
Kasus penggunaan: Memecahkan masalah konektivitas jaringan
Dalam kasus penggunaan ini, Anda adalah administrator jaringan yang mendukung jaringan yang
menyertakan beberapa aplikasi yang di-load balance. Anda telah diberi tahu tentang masalah latensi dan telah diberi tahu bahwa aplikasi seluler organisasi Anda secara berkala lambat dan waktu tunggunya habis. Anda tahu bahwa sejumlah pengguna yang berbeda terpengaruh, dan belum ada deployment aplikasi baru-baru ini. Masalah
ini kemungkinan terkait dengan perubahan lingkungan, bukan aplikasi.
Kasus penggunaan berikut menunjukkan cara Topologi Jaringan dapat membantu Anda
memecahkan masalah dan menyelidiki masalah dalam deployment dengan cepat.
Detail topologi
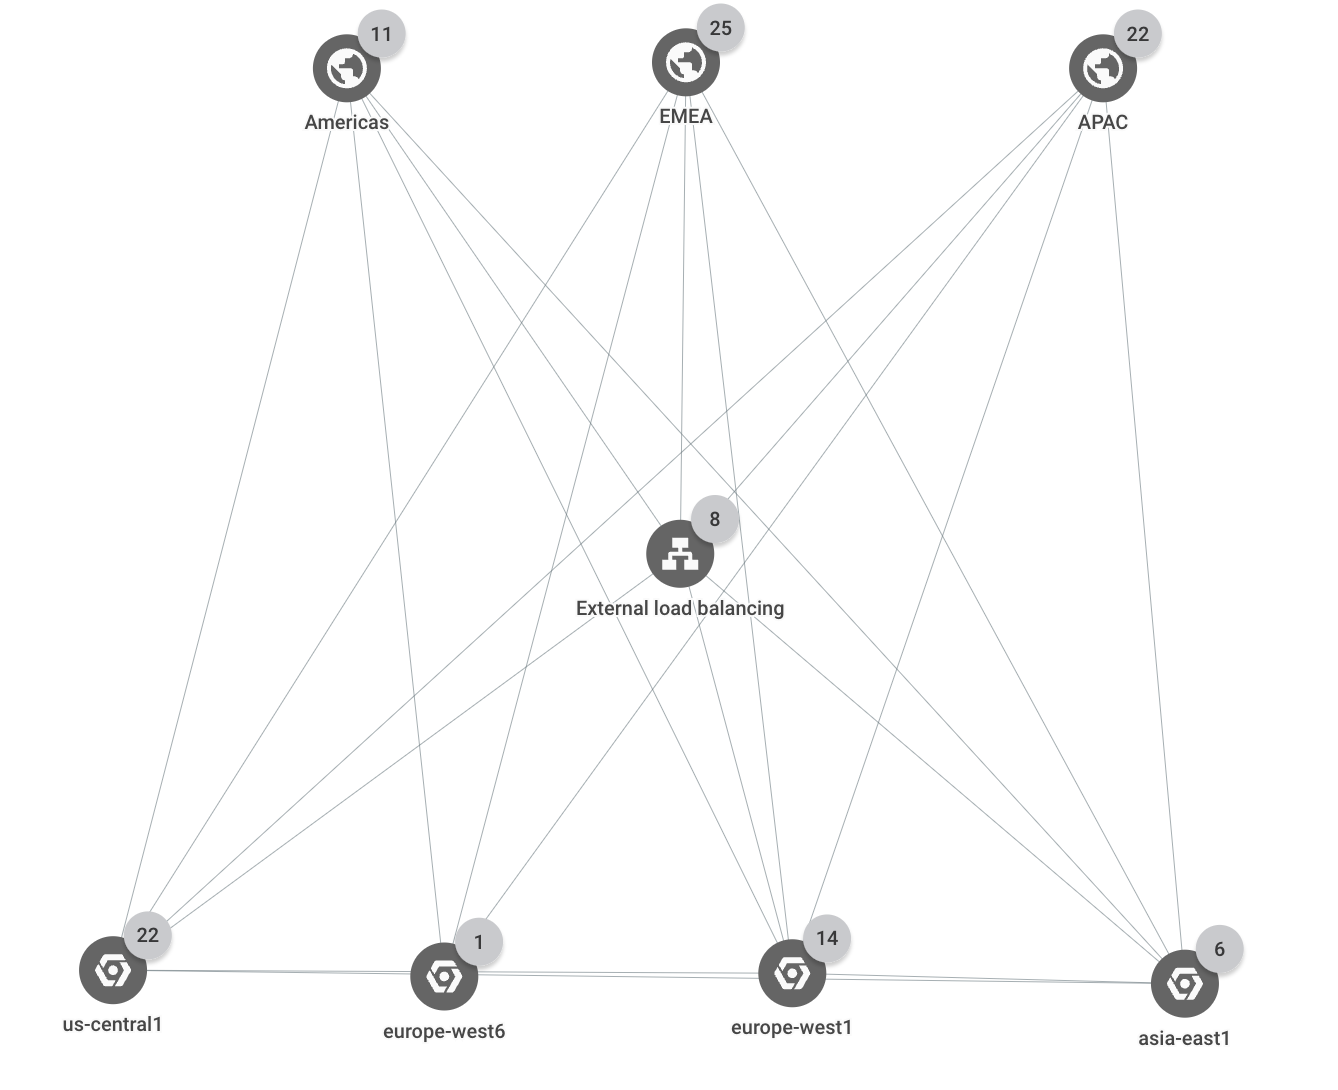
Deployment ini mencakup tiga Google Cloud region (us-central1,
europe-west1, dan asia-east1). Semua permintaan klien eksternal ditayangkan oleh
satu Load Balancer Aplikasi eksternal yang memiliki beberapa backend di setiap dari tiga
region tersebut. Permintaan klien yang berasal dari salah satu dari tiga region bisnis (Amerika,
EMEA, dan APAC) ditayangkan oleh instance aplikasi di regionGoogle Cloud
terdekat.
Topologi berikut menunjukkan hierarki tingkat teratas untuk deployment:
Topologi contoh Topologi Jaringan (klik untuk memperbesar)
Latensi jaringan
Dalam skenario ini, asumsikan Anda memiliki load balancer bernama shopping-site-lb.
Anda memeriksa latensi antara klien eksternal dan load balancer untuk melihat apakah
latensi di antara keduanya telah berubah. Anda mendapati bahwa hal itu telah terjadi dan memutuskan untuk
menyelidiki backend load balancer lebih lanjut.
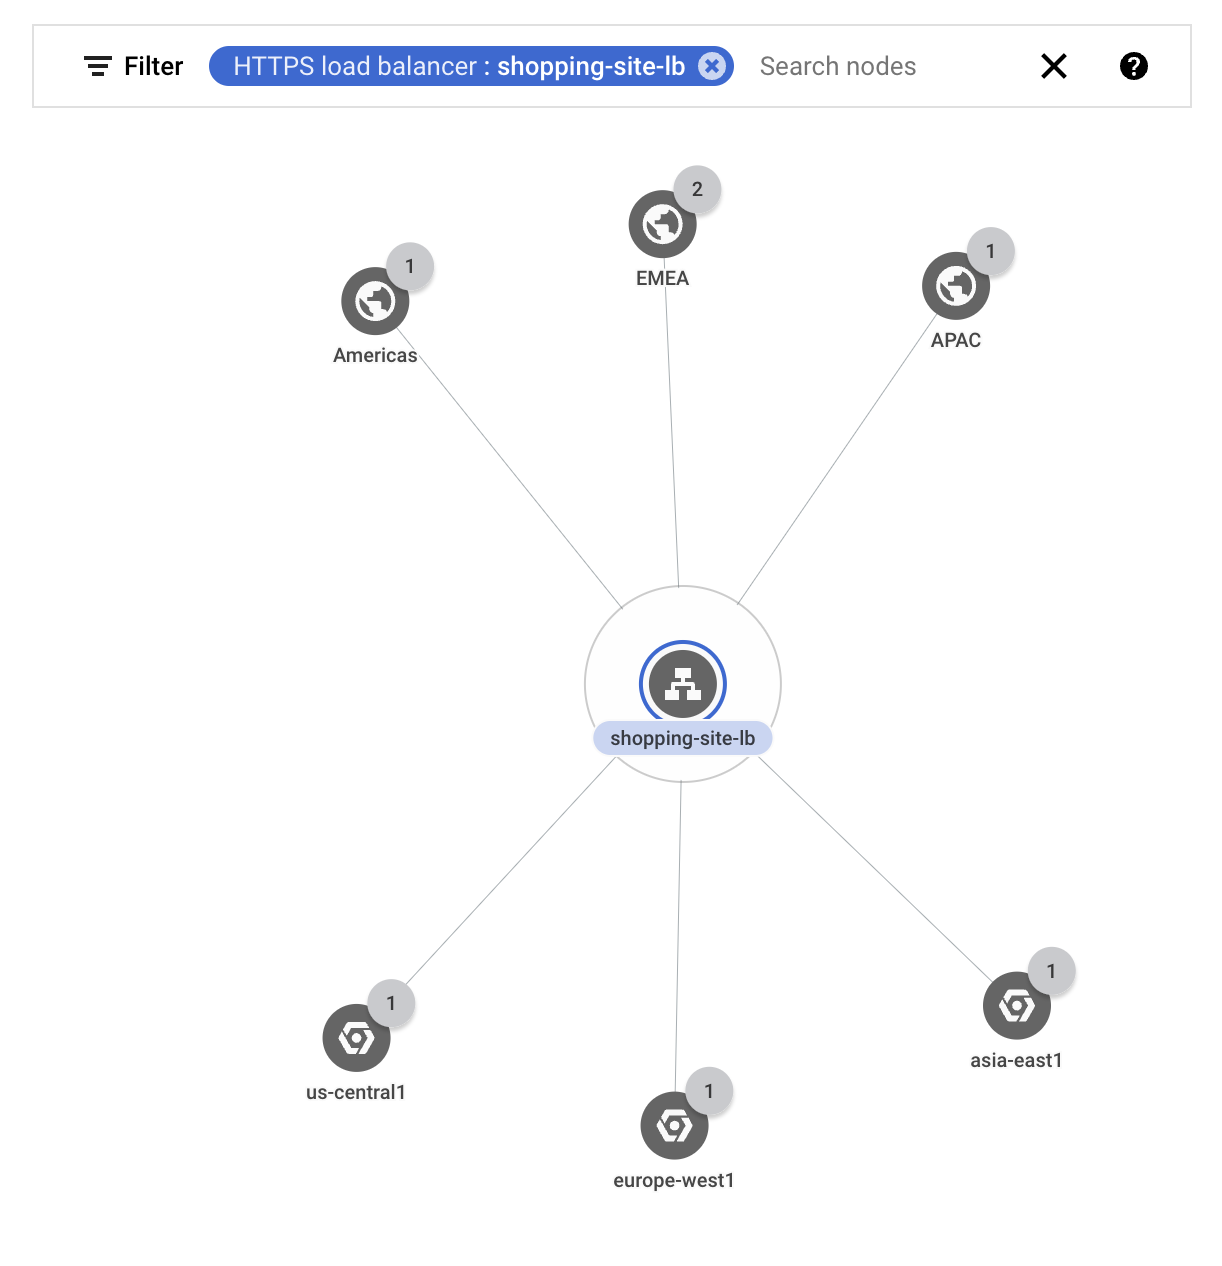
Anda memfilter topologi untuk hanya menampilkan traffic untuk load balancer eksternal
shopping-site-lb.
Setelah Anda menerapkan filter, Network Topology hanya akan menampilkan
koneksi yang terkait dengan load balancer, seperti yang ditunjukkan dalam contoh berikut.
Filter untuk load balancer (klik untuk memperbesar)
Mulai dari klien eksternal di Amerika, Anda mengklik metrik traffic antara region bisnis Amerika dan load balancer.
Topologi Jaringan menampilkan diagram di panel detail. Informasi ini mencakup traffic masuk dan keluar antara entity yang Anda pilih dan entity yang terhubung. Misalnya, Topologi Jaringan
memberikan nilai terbaru untuk kueri per detik (QPS) dan latensi permintaan
HTTP.
Dalam diagram latensi permintaan, Anda akan melihat nilai untuk persentil ke-50, ke-95, dan ke-99. Dalam contoh ini, asumsikan bahwa semua nilai latensi
lebih tinggi dari yang Anda harapkan.
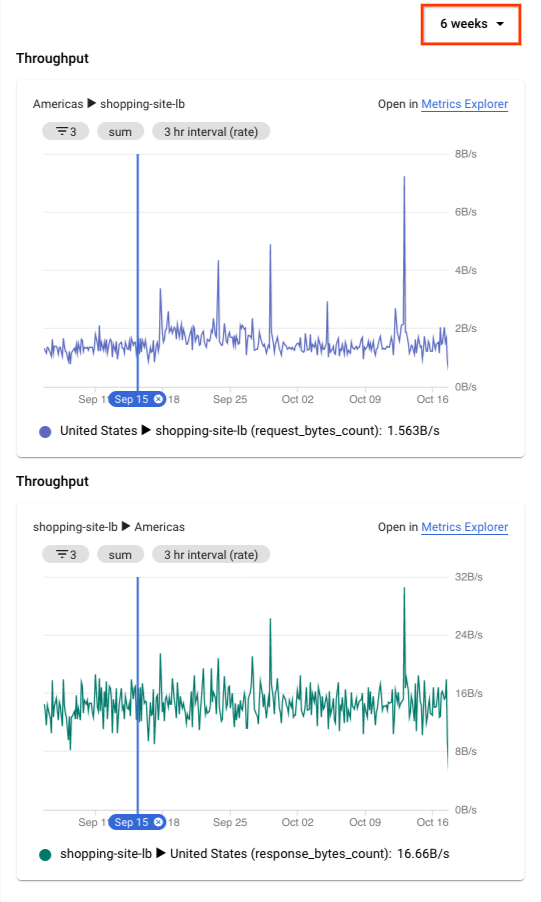
Untuk meluaskan diagram deret waktu menjadi 6 minggu, di bagian atas panel detail, pilih
6 minggu.
Memperluas diagram1 (klik untuk memperbesar)
1Gambar ini hanya untuk referensi. Datanya tidak mencerminkan kasus
penggunaan.
Anda melihat lonjakan signifikan yang terjadi sekitar dua jam yang lalu, kira-kira saat masalah pertama dilaporkan. Anda yakin bahwa masalah tersebut terkait dengan peningkatan latensi pada load balancer.
Setelah memiliki gambaran umum tentang masalah tersebut, Anda akan menyelidiki load balancer lebih lanjut dengan membuka halaman Load balancing di konsol Google Cloud . Anda
akhirnya mendapati bahwa instance dalam layanan backend load balancer
memerlukan waktu lebih lama dari biasanya untuk merespons. Anda menghentikan instance tersebut,
yang akan menyelesaikan masalah.
[[["Mudah dipahami","easyToUnderstand","thumb-up"],["Memecahkan masalah saya","solvedMyProblem","thumb-up"],["Lainnya","otherUp","thumb-up"]],[["Sulit dipahami","hardToUnderstand","thumb-down"],["Informasi atau kode contoh salah","incorrectInformationOrSampleCode","thumb-down"],["Informasi/contoh yang saya butuhkan tidak ada","missingTheInformationSamplesINeed","thumb-down"],["Masalah terjemahan","translationIssue","thumb-down"],["Lainnya","otherDown","thumb-down"]],["Terakhir diperbarui pada 2025-08-18 UTC."],[],[],null,["# Use case: Troubleshoot network connectivity\n===========================================\n\nIn this use case, you're a network administrator supporting a network that\nincludes several load-balanced applications. You've been alerted of a latency\nproblem and have been told that your organization's mobile application is\nintermittently slow and timing out. You know that a number of different users\nare affected, and that there have been no recent application deployments. The\nissue is likely related to a change in the environment and not the application.\n\nThe following use case demonstrates how Network Topology can help you\nquickly troubleshoot and investigate issues in your deployment.\n\nTopology details\n----------------\n\nThe deployment spans three Google Cloud regions (`us-central1`,\n`europe-west1`, and `asia-east1`). All external client requests are served by a\nsingle external Application Load Balancer that has multiple backends in each of the three\nregions. Client requests that come from one of three business regions (Americas,\nEMEA, and APAC) are served by application instances in the closest\nGoogle Cloud region.\n\nThe following topology shows the top-level hierarchy for the deployment:\n[](/static/network-intelligence-center/docs/network-topology/images/use-cases/auditing-topology.png) Network Topology example topology (click to enlarge)\n\nNetwork latency\n---------------\n\nIn this scenario, assume that you have a load balancer named `shopping-site-lb`.\nYou check the latency between external clients and the load balancer to see if\nthe latency between them has changed. You discover that it has and decide to\nfurther investigate the load balancer's backends.\n\n1. You filter the topology to show only the traffic for your external load balancer\n `shopping-site-lb`.\n\n After you apply the filter, Network Topology shows only the\n connections related to the load balancer, as shown in the following example.\n [](/static/network-intelligence-center/docs/network-topology/images/use-cases/auditing-filter.png) Filter for a load balancer (click to enlarge)\n2. Starting with the external clients in Americas, you click the traffic metrics\n between the Americas business region and the load balancer.\n\n Network Topology shows charts in the details pane. The\n information includes ingress and egress traffic between your selected\n entity and the connected entity. For example, Network Topology\n provides the latest values for queries per second (QPS) and the HTTP request\n latency.\n\n In the request latency chart, you see values for the 50th, 95th, and 99th\n percentiles. In this example, assume that all of the latency values are\n higher than you expected.\n3. To expand the time series charts to 6 weeks, at the top of the details pane, you select\n **6 weeks**.\n\n [](/static/network-intelligence-center/docs/network-topology/images/use-cases/troubleshooting-zoom.png) Expanding the chart^1^ (click to enlarge) \n\n ^1^The figure is for reference. Its data doesn't reflect the use\n case.\n\n You see a significant jump that happened about two hours ago, roughly when\n the first issues were reported. You're confident that the issue is related\n to increased latency with the load balancer.\n4. Having a high-level view of the issue, you investigate the load balancer\n further by going to the **Load balancing** page in the Google Cloud console. You\n eventually find that an instance in the load balancer's backend service was\n taking longer than normal to respond. You take that instance out of service,\n which resolves the issue.\n\nWhat's next\n-----------\n\n- [Monitor your networking configuration with Network Topology](/network-intelligence-center/docs/network-topology/how-to/audit-troubleshoot-networking-issues)\n- [Use case: Audit network performance](/network-intelligence-center/docs/network-topology/concepts/auditing-network-performance)\n- [Troubleshoot Network Topology](/network-intelligence-center/docs/network-topology/support/troubleshooting)"]]