如果您拥有创建表计算的权限,则可以使用快捷计算对探索的数据表中的数字字段执行常见计算,而无需使用 Looker 函数和运算符。
在某些查询结果中,突出显示满足(或不满足)特定条件的行非常有用。此模式在 Google 表格或其他电子表格应用中通常称为条件格式。
Looker 支持以多种不同的方式在可视化图表中应用条件格式:
-
使用
htmlLookML 参数。如果驱动格式设置的条件在给定字段的分析中保持一致,则此方法非常适合用于设置值格式。 - 使用表计算。如果需要从 Looker 的“探索”界面分配确定格式的条件,此方法非常适合。
- 直接在表格图表的可视化图表设置中进行。
第二种方法利用表格计算来确定条件格式,本页将详细介绍这种方法,并提供两个使用表情符号的示例
如需启用表情符号,请执行以下操作:
-
对于 Mac:
CTRL + CMD + SPACE会调出表情符号键盘,您可以在其中选择表情符号以放入表格计算中。 - 对于 Windows:这篇关于表情符号键盘快捷键的 Buffer 文章介绍了如何启用和使用表情符号。
注意:并非所有后端数据库都支持在表格计算中使用表情符号。如果您的实例迁移到 MySQL 后端,表情符号可能会意外损坏。您可以考虑使用探索中的可视化设置编辑器为表格图表设置条件格式,或者使用 HTML 实现条件格式。
示例 1
以下示例基于一个探索查询,该查询按库存商品创建日期分组,并显示库存商品数量。用户希望添加一个表情符号来指示商品数量的值是大于还是小于指定数量。
第一步是创建一个计算,该计算使用 if 函数指定对商品数量值进行分类的条件,并使用 concat 函数根据值是否满足条件来添加表情符号字符。
用户希望使用表情符号来指示某个值是否满足条件。绿色对勾标记表情符号表示值符合条件,红色 x 表情符号表示值不符合条件。
表计算如下:
concat(
  if(${inventory_items.count} > 255, "<emoji>" ,
    if(${inventory_items.count} < 260, "<different_emoji>" , " ")), " "
      ,${inventory_items.count})
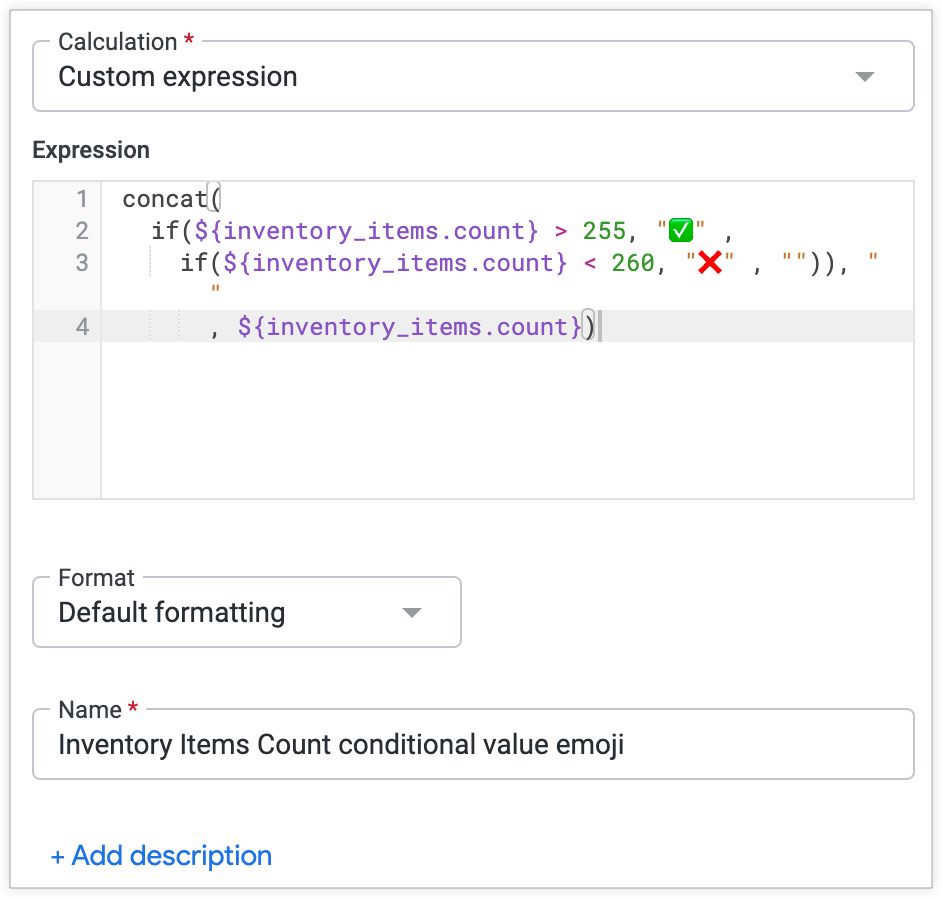
下图显示了创建表计算菜单中的表情符号表计算:
此表计算会生成以下表格可视化图表:
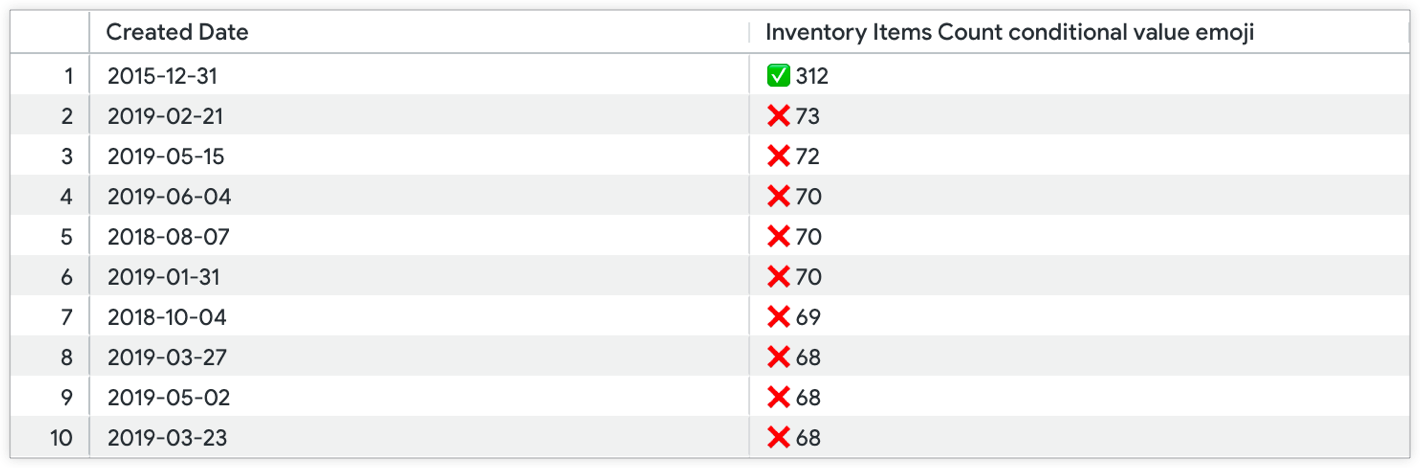
“商品数量”指标列已从可视化图表中隐藏,因此只有带有条件性前置表情符号的表格计算列会显示在可视化图表中。
示例 2
同样,示例 1 中的条件格式设置模式可以应用于百分比变化表计算,以突出显示可能需要额外关注的行。以下示例包含两项计算。此示例还使用了“探索”功能,其中库存商品数量按库存商品创建日期分组。
第一个表格计算会返回百分比变化(使用 offset 函数比较同一列中与不同日期相关联的值):
  (${inventory_items.count} - offset(${inventory_items.count},
  -1))/offset(${inventory_items.count}, -1)
在此探索示例中,表格计算的名称为 Inventory Items Count percentage change,第二个表格计算中引用了该名称。
第二个表格计算应用了 if 条件和 concat 函数,用于在库存商品数量与前一天相比出现负增长的日期前面添加红色 x 表情符号:
  concat(
    if((${inventory_items_count_percentage_change}*100) < 0, "<emoji>", " "), " ",
    round(${inventory_items_count_percentage_change}*100,1),
    if(is_null(${inventory_items_count_percentage_change}), " ", "%"))
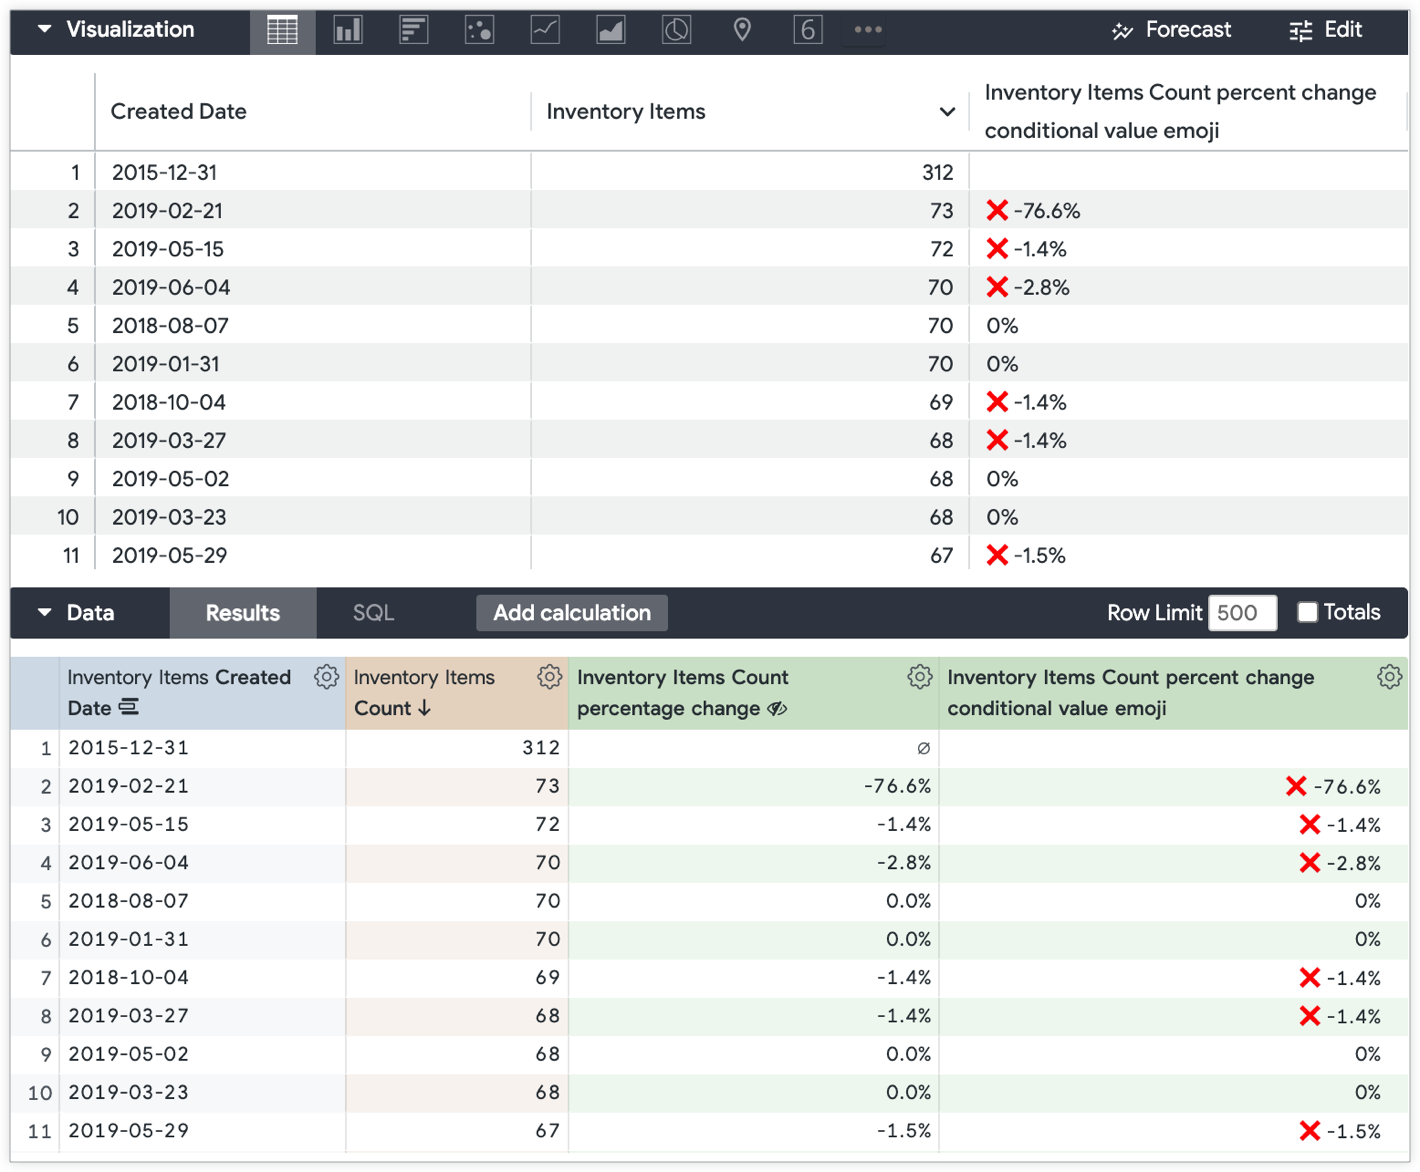
这两个表格计算会生成一个探索数据表格,其中包含两个新行,分别用于“库存商品数量百分比变化”和“库存商品数量百分比变化”条件值表情符号表格计算。生成的表格可视化图表会显示除商品数量百分比变化以外的所有字段的结果。“Inventory Items Count percentage change”(商品目录项数量百分比变化)表计算已从表格可视化图表中隐藏: