Usage
visualization: {
  id: "unique-id"
  label: "Visualization Label"
  url: "visualization_url"
  sri_hash: "SRI hash"
  dependencies: ["dependency_url_1","dependency_url_2"]
  file: "visualization_file_path"
}
|
Hierarchy
visualization |
Default Value
None
Special Rules
The visualization must have either a url or a file parameter, but not both
|
Definition
The visualization parameter adds a custom visualization to your LookML project that users can access from the Visualization tab in the project's Explores. The custom visualization must be defined in a JavaScript file, which can be included in your LookML project files, or hosted elsewhere.
The visualization parameter has the following subparameters:
| Parameter | Description |
|---|---|
id |
Specifies a unique identifier for the visualization that is displayed in the Visualizations page of Looker's Admin menu. |
label |
Provides the label for the visualization that is displayed in the Visualization tab of your project's Explores and in the Visualizations page of Looker's Admin menu. |
url |
The url parameter provides the URL to the visualization's JavaScript file, if the file is stored on a server outside the Looker instance. Instead of using the url parameter, you can drag and drop the file into the Looker IDE and then use the file parameter to point to the file.
NOTE: The application must have either a url parameter or a file parameter, but not both.
|
sri_hash |
The SRI hash is used only when the visualization's JavaScript file is specified with the url parameter. If the site hosting your custom visualization code uses a subresource integrity (SRI) hash for verification purposes, enter the SRI hash in the sri_hash field.
|
dependencies |
Provides a comma-separated list of dependency URLs required to load the visualization. |
file |
Specifies the path to a JavaScript file (with a .js extension) that defines the visualization. The path is relative to the project root. The example in the next column points to the calendar-heatmap.js file in the visualizations directory of the LookML project.
NOTE: The application must have either a url parameter or a file parameter, but not both.
|
Example: Adding a custom visualization URL to your LookML project
One option for adding a custom visualization to your LookML project is to use the URL of a custom visualization file. For example, adding this LookML to a project's manifest file adds a multiple-value CDN custom visualization to the Looker project. This visualization is defined in a JavaScript file located on Looker's Marketplace:
visualization: {
id: "spider-marketplace-dev"
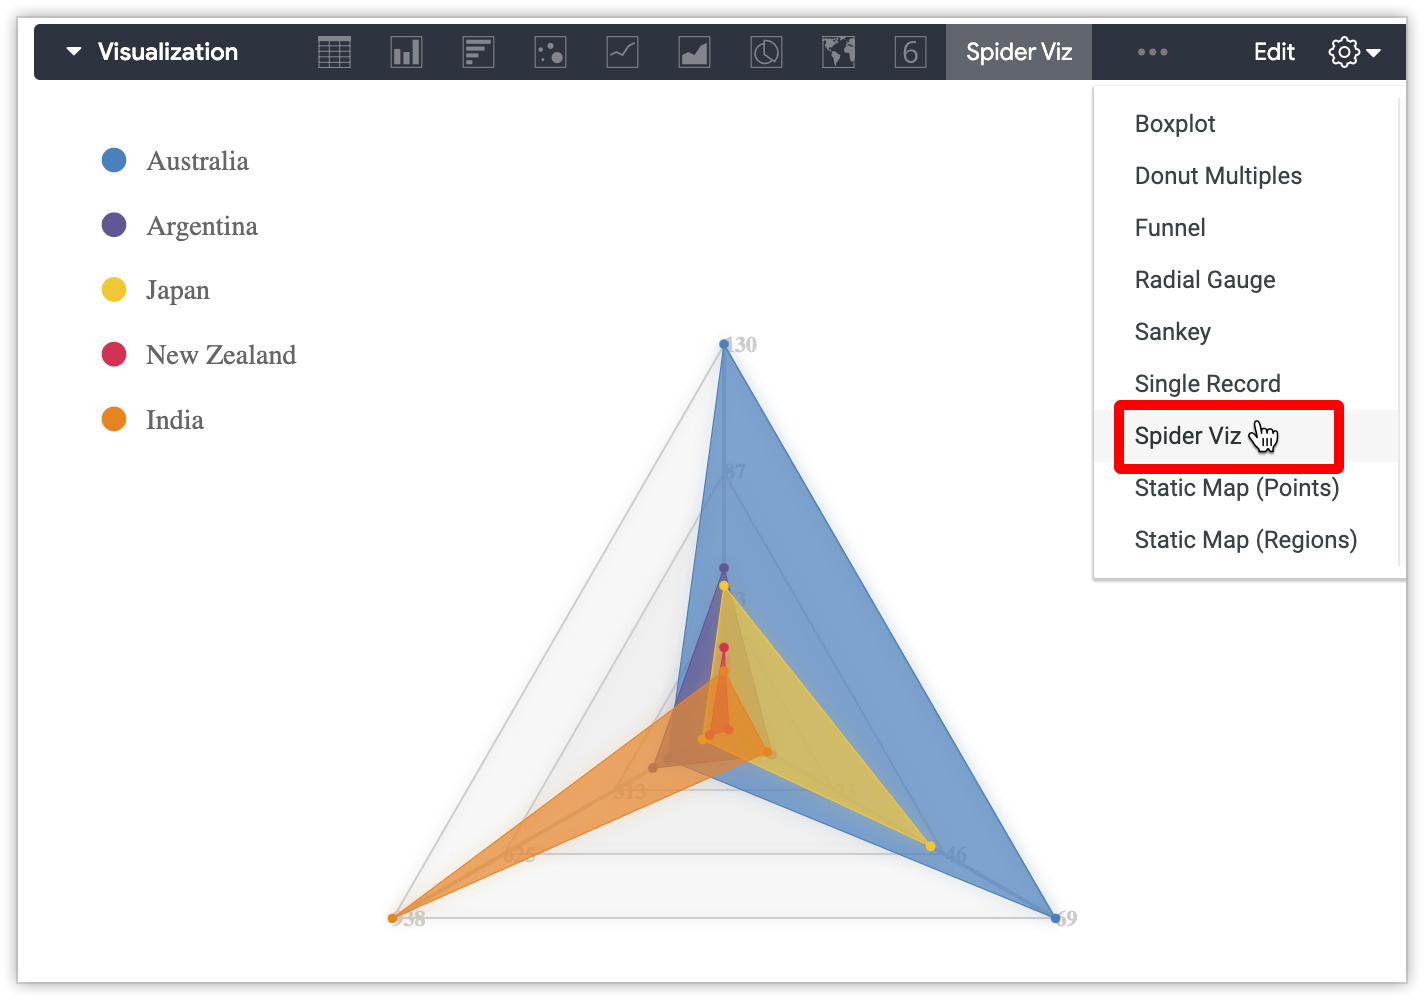
label: "Spider Viz"
url: "https://marketplace-api.looker.com/viz-dist/spider.js"
sri_hash: "oqVuAfXRKap7fdgcCY5uykM6+R9GqQ8K/uxy9rx7HNQlGYl1kPzQho1wx4JwY8wC"
dependencies: ["https://code.jquery.com/jquery-2.2.4.min.js","https://cdnjs.cloudflare.com/ajax/libs/underscore.js/1.9.1/underscore-min.js","https://cdnjs.cloudflare.com/ajax/libs/d3/3.5.6/d3.min.js","https://cdnjs.cloudflare.com/ajax/libs/d3-legend/1.13.0/d3-legend.min.js"]
}
Once you commit your changes and deploy them to production, Looker displays the name of the custom visualization as an option in the Visualization tab of your project's Explores.
The visualization will also be listed on the Visualizations page in the Platform section of Looker's Admin menu; see the Admin settings - Visualizations documentation page for information.
Example: Adding a custom visualization file to your LookML project
Another option is to add the custom visualization JavaScript file to your LookML project using the Looker IDE:
- In the Looker IDE, drag and drop the JavaScript file that defines your custom visualization into your LookML project.
- Optionally, move the visualization file into a folder in the Looker IDE, or create a new folder for the visualization file.
- Click on the visualization file in the file browser panel to display the file contents, then click Save to save the file.
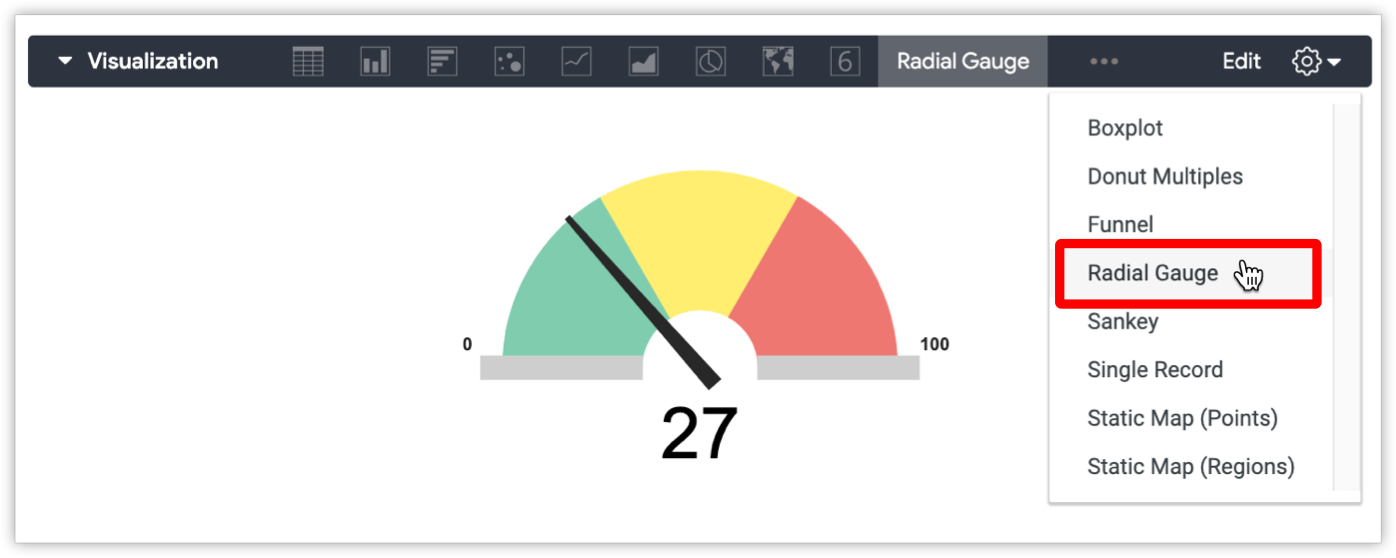
- In the project's manifest file, define the visualization parameters. For example, this LookML adds a radial gauge custom visualization to the Looker project. The visualization is defined in a JavaScript file located in the
visualizationsdirectory of the LookML project:
  visualization: {
  id: "radial_gauge"
  label: "Radial Gauge"
  file: "visualizations/radialgauge_v2.js"
   }
Commit your changes and deploy them to production.
You must deploy the visualization updates to see the customer visualization option in an Explore (saving the updates is not sufficient, even in Development Mode).
Once you have deployed your updates, Looker displays the name of the custom visualization as an option in the Visualization tab of your project's Explores.
The visualization is also listed on the Visualizations page in the Platform section of Looker's Admin menu; see the Admin settings - Visualizations documentation page for information.