Most load balancers use a round-robin or flow-based hashing approach to distribute traffic. Load balancers that use this approach can have difficulty adapting when traffic demand spikes beyond available serving capacity. This tutorial shows how Cloud Load Balancing optimizes your global application capacity, resulting in a better user experience and lower costs compared to most load balancing implementations.
This article is part of a best practices series for Cloud Load Balancing products. This tutorial is accompanied by Application capacity optimizations with global load balancing, a conceptual article that explains the underlying mechanisms of global load balancing overflow in more detail. For a deeper dive on latency, see Optimizing Application Latency with Cloud Load Balancing.
This tutorial assumes you have some experience with Compute Engine. You should also be familiar with External Application Load Balancer fundamentals.
Objectives
In this tutorial, you set up a simple web server running a CPU-intensive application that computes Mandelbrot sets. You start by measuring its network capacity using load-testing tools (siege and httperf). You then scale the network to multiple VM instances in a single region and measure response time under load. Finally, you scale the network to multiple regions using global load balancing and then measure the server's response time under load and compare it to single-region load balancing. Performing this sequence of tests lets you see the positive effects of the cross-regional load management of Cloud Load Balancing.
The network communication speed of a typical three-tier server architecture is usually limited by application server speed or database capacity instead of by CPU load on the web server. After you run through the tutorial, you can use the same load testing tools and capacity settings to optimize load-balancing behavior in a real world application.
You will:
- Learn how to use load testing tools (
siegeandhttperf). - Determine the serving capacity of a single VM instance.
- Measure effects of overload with single-region load balancing.
- Measure effects of overflow to another region with global load balancing.
Costs
This tutorial uses billable components of Google Cloud, including:
- Compute Engine
- Load Balancing and forwarding rules
Use the Pricing Calculator to generate a cost estimate based on your projected usage.
Before you begin
-
In the Google Cloud console, on the project selector page, select or create a Google Cloud project.
Roles required to select or create a project
- Select a project: Selecting a project doesn't require a specific IAM role—you can select any project that you've been granted a role on.
-
Create a project: To create a project, you need the Project Creator role
(
roles/resourcemanager.projectCreator), which contains theresourcemanager.projects.createpermission. Learn how to grant roles.
-
Verify that billing is enabled for your Google Cloud project.
-
Enable the Compute Engine API.
Roles required to enable APIs
To enable APIs, you need the Service Usage Admin IAM role (
roles/serviceusage.serviceUsageAdmin), which contains theserviceusage.services.enablepermission. Learn how to grant roles.
Setting up your environment
In this section, you configure the project settings, VPC network, and basic firewall rules that you need in order to complete the tutorial.
Start a Cloud Shell instance
Open Cloud Shell from the Google Cloud console. Unless otherwise noted, you execute the rest of the tutorial from inside Cloud Shell.
Configure project settings
To make it easier to run gcloud commands, you can set properties so that you
don't have to supply options for these properties with each command.
Set your default project, using your project ID for
[PROJECT_ID]:gcloud config set project [PROJECT_ID]
Set your default Compute Engine zone, using your preferred zone for
[ZONE]and then set this as an environment variable for later use:gcloud config set compute/zone [ZONE] export ZONE=[ZONE]
Create and configure the VPC network
Create a VPC network for testing:
gcloud compute networks create lb-testing --subnet-mode auto
Define a firewall rule to allow internal traffic:
gcloud compute firewall-rules create lb-testing-internal \
    --network lb-testing --allow all --source-ranges 10.128.0.0/11
Define a firewall rule to allow SSH traffic to communicate with the VPC network:
gcloud compute firewall-rules create lb-testing-ssh \
    --network lb-testing --allow tcp:22 --source-ranges 0.0.0.0/0
Determining the serving capacity of a single VM instance
To examine the performance characteristics of a VM instance type, you'll do the following:
Set up a VM instance that serves the example workload (the webserver instance).
Create a second VM instance in the same zone (the load-testing instance).
With the second VM instance, you'll measure performance using simple load testing and performance measurement tools. You'll use these measurements later in the tutorial to help define the correct load-balancing capacity setting for the instance group.
The first VM instance uses a Python script to create a CPU-intensive task by calculating and displaying a picture of a Mandelbrot set on each request to the root (/) path. The result is not cached. During the tutorial, you get the Python script from the GitHub repository used for this solution.

Setting up the VM instances
Set up the
webserverVM instance as a 4-core VM instance by installing and then starting the Mandelbrot server:gcloud compute instances create webserver --machine-type n1-highcpu-4 \ --network=lb-testing --image-family=debian-12 \ --image-project=debian-cloud --tags=http-server \ --metadata startup-script='#! /bin/bash apt-get -y update apt-get install -y git python-numpy python-matplotlib git clone \ https://github.com/GoogleCloudPlatform/lb-app-capacity-tutorial-python.git cd lb-app-capacity-tutorial-python python webserver.py'Create a firewall rule to allow external access to the
webserverinstance from your own machine:gcloud compute firewall-rules create lb-testing-http \ --network lb-testing --allow tcp:80 --source-ranges 0.0.0.0/0 \ --target-tags http-serverGet the IP address of the
webserverinstance:gcloud compute instances describe webserver \ --format "value(networkInterfaces[0].accessConfigs[0].natIP)"In a web browser, go to the IP address returned by the previous command. You see a computed Mandelbrot set:

Create the load-testing instance:
gcloud compute instances create loadtest --machine-type n1-standard-1 \
    --network=lb-testing --image-family=debian-12 \
    --image-project=debian-cloud
Testing the VM instances
The next step is to run requests to gauge the performance characteristics of the load testing VM instance.
Use the
sshcommand to connect to the load-testing VM instance:gcloud compute ssh loadtest
On the load-testing instance, install siege and httperf as your load testing tools:
sudo apt-get install -y siege httperf
The
siegetool allows to simulate requests from a specified number of users, making follow-on requests only after users received a response. This gives you insights into capacity and expected response times for applications in a real world environment.The
httperftool allows to send a specific number of requests per second regardless of whether responses or errors are received. This gives you insights into how applications respond to a specific load.Time a simple request to the web server:
curl -w "%{time_total}\n" -o /dev/#objectives_2 -s webserverYou get a response such as 0.395260. This means that server took 395 milliseconds (ms) to respond to your request.
Use the following command to run 20 requests from 4 users in parallel:
siege -c 4 -r 20 webserver
You see output similar to the following:
** SIEGE 4.0.2
** Preparing 4 concurrent users for battle.
The server is now under siege...
Transactions:                    80 hits
Availability:                 100.00 %
Elapsed time:                  14.45 secs
Data transferred:               1.81 MB
Response time:                  0.52 secs
Transaction rate:               5.05 trans/sec
Throughput:                     0.12 MB/sec
Concurrency:                    3.92
Successful transactions:         80
Failed transactions:               0
**Longest transaction:            0.70
Shortest transaction:           0.37
**
The output is explained fully in the siege manual, but you can see in this example that response times varied between 0.37s and 0.7s. On average, 5.05 requests per second were responded to. This data helps estimate the serving capacity of the system.
Run the following commands to validate the findings by using the
httperfload testing tool:httperf --server webserver --num-conns 500 --rate 4
This command runs 500 requests at the rate of 4 requests a second, which is less than the 5.05 transactions per second that
siegecompleted.You see output similar to the following:
httperf --client=0/1 --server=webserver --port=80 --uri=/ --rate=4
--send-buffer=4096 --recv-buffer=16384 --num-conns=500 --num-calls=1
httperf: warning: open file limit > FD_SETSIZE; limiting max. # of open files to
FD_SETSIZE
Maximum connect burst length: 1

Total: connections 500 requests 500 replies 500 test-duration 125.333 s

Connection rate: 4.0 conn/s (251.4 ms/conn, <=2 concurrent connections)
**Connection time [ms]: min 369.6 avg 384.5 max 487.8 median 377.5 stddev 18.0
Connection time [ms]: connect 0.3**
Connection length [replies/conn]: 1.000

Request rate: 4.0 req/s (251.4 ms/req)
Request size [B]: 62.0

Reply rate [replies/s]: min 3.8 avg 4.0 max 4.0 stddev 0.1 (5 samples)
Reply time [ms]: response 383.8 transfer 0.4
Reply size [B]: header 117.0 content 24051.0 footer 0.0 (total 24168.0)
Reply status: 1xx=0 2xx=100 3xx=0 4xx=0 5xx=0

CPU time [s]: user 4.94 system 20.19 (user 19.6% system 80.3% total 99.9%)
Net I/O: 94.1 KB/s (0.8*10^6 bps)

Errors: total 0 client-timo 0 socket-timo 0 connrefused 0 connreset 0
Errors: fd-unavail 0 addrunavail 0 ftab-full 0 other 0
The output is explained in the httperf README file. Note the line that starts with
Connection time [ms], which shows that connections took between 369.6 and 487.8 ms in total and generated zero errors.Repeat the test 3 times, setting the
rateoption to 5, 7, and 10 requests per second.The following blocks show the
httperfcommands and their output (showing only the relevant lines with connection time information).Command for 5 requests per second:
httperf --server webserver --num-conns 500 --rate 5 2>&1| grep 'Errors\|ion time'
Results for 5 requests per second:
Connection time [ms]: min 371.2 avg 381.1 max 447.7 median 378.5 stddev 7.2
Connection time [ms]: connect 0.2
Errors: total 0 client-timo 0 socket-timo 0 connrefused 0 connreset 0
Errors: fd-unavail 0 addrunavail 0 ftab-full 0 other 0
Command for 7 requests per second:
httperf --server webserver --num-conns 500 --rate 7 2>&1| grep 'Errors\|ion time'
Results for 7 requests per second:
Connection time [ms]: min 373.4 avg 11075.5 max 60100.6 median 8481.5 stddev
10284.2
Connection time [ms]: connect 654.9
Errors: total 4 client-timo 0 socket-timo 0 connrefused 0 connreset 4
Errors: fd-unavail 0 addrunavail 0 ftab-full 0 other 0
Command for 10 requests per second:
httperf --server webserver --num-conns 500 --rate 10 2>&1| grep 'Errors\|ion time'
Results for 10 requests per second:
Connection time [ms]: min 374.3 avg 18335.6 max 65533.9 median 10052.5 stddev
16654.5
Connection time [ms]: connect 181.3
Errors: total 32 client-timo 0 socket-timo 0 connrefused 0 connreset 32
Errors: fd-unavail 0 addrunavail 0 ftab-full 0 other 0
Sign out of the
webserverinstance:exit
You can conclude from these measurements that the system has a capacity of roughly 5 requests per second (RPS). At 5 requests per second, the VM instance reacts with a latency comparable to 4 connections. At 7 and 10 connections per second, the average response time increases drastically to over 10 seconds with multiple connection errors. In other words, anything in excess of 5 requests per second causes significant slowdowns.
In a more complex system, the server capacity is determined in a similar way,
but depends heavily on the capacity of all its components. You can use the
siege and httperf tools together with CPU and I/O load monitoring of all
components (for example, the frontend server, the application server, and the
database server) to help identify bottlenecks. This in turn can help you enable
optimal scaling for each component.
Measuring overload effects with a single-region load balancer
In this section, you examine the effects of overload on single-region load balancers, such as typical load balancers used on premises, or Google Cloud External passthrough Network Load Balancer. You can also observe this effect with a HTTP(S) load balancer when the load balancer is used for a regional (rather than global) deployment.

Creating the single-region HTTP(S) load balancer
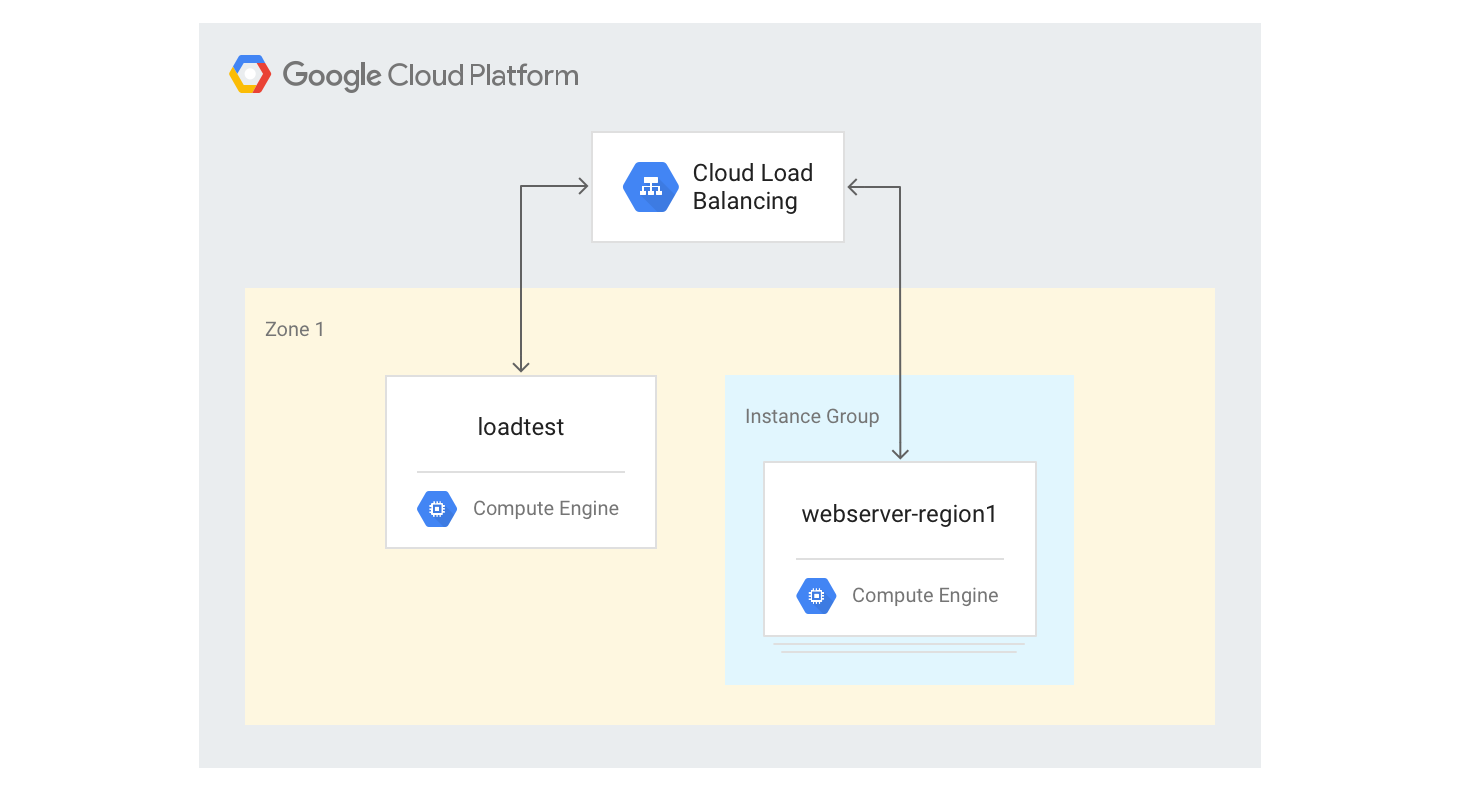
The following steps describe how to create a single region HTTP(S) load balancer with a fixed size of 3 VM instances.
Create an instance template for the web server VM instances using the Python Mandelbrot generation script you used earlier. Run the following commands in Cloud Shell:
gcloud compute instance-templates create webservers \
    --machine-type n1-highcpu-4 \
    --image-family=debian-12 --image-project=debian-cloud \
    --tags=http-server \
    --network=lb-testing \
    --metadata startup-script='#! /bin/bash
apt-get -y update
apt-get install -y git python-numpy python-matplotlib
git clone \
    https://github.com/GoogleCloudPlatform/lb-app-capacity-tutorial-python.git
cd lb-app-capacity-tutorial-python
python webserver.py'
Create a managed instance group with 3 instances based on the template from the previous step:
gcloud compute instance-groups managed create webserver-region1 \
    --size=3 --template=webservers
Create the health check, backend service, URL map, target proxy, and global-forwarding rule needed in order to generate HTTP load balancing:
gcloud compute health-checks create http basic-check \
    --request-path="/health-check" --check-interval=60s

gcloud compute backend-services create web-service \
    --health-checks basic-check --global
gcloud compute backend-services add-backend web-service \
    --global --instance-group=webserver-region1 \
    --instance-group-zone $ZONE

gcloud compute url-maps create web-map --default-service web-service

gcloud compute target-http-proxies create web-proxy --url-map web-map

gcloud compute forwarding-rules create web-rule --global \
    --target-http-proxy web-proxy --ports 80
Get the IP address of the forwarding rule:
gcloud compute forwarding-rules describe --global web-rule --format "value(IPAddress)"
The output is the public IP address of the load balancer you created.
In a browser, go to the IP address returned by the previous command. After a few minutes, you see the same Mandelbrot picture you saw earlier. However, this time the image is served from one of the VM instances in the newly created group.
Sign in to the
loadtestmachine:gcloud compute ssh loadtest
At the command line of the
loadtestmachine, test the server response with different numbers of requests per second (RPS). Make sure that you use RPS values at least in the range from 5 to 20.For example, the following command generates 10 RPS. Replace
[IP_address]with the IP address of the load balancer from an earlier step in this procedure.httperf --server [IP_address] --num-conns 500 --rate 10 2>&1| grep 'Errors\|ion time'
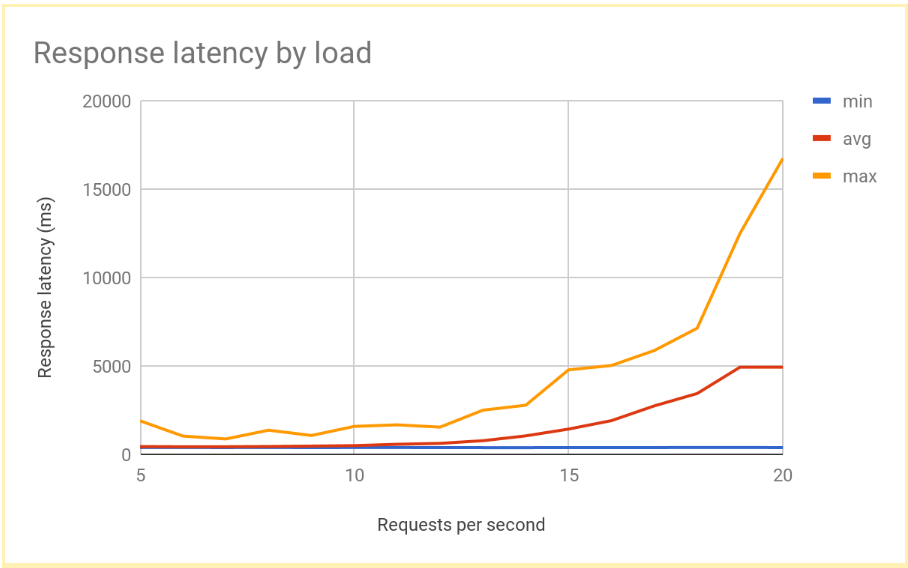
The response latency goes up significantly as the number of RPS increases past 12 or 13 RPS. Here is a visualization of typical results:

Sign out of the
loadtestVM instance:exit
This performance is typical for a regionally load-balanced system. As the load increases past serving capacity, the average as well as the maximum request latency increases sharply. With 10 RPS, the average request latency is close to 500 ms, but with 20 RPS the latency is 5000 ms. Latency has increased tenfold and the user experience rapidly deteriorates, leading to user drop off or application timeouts, or both.
In the next section, you'll add a second region to the load-balancing topology and compare how the cross-region failover affects end-user latency.
Measuring overflow effects to another region
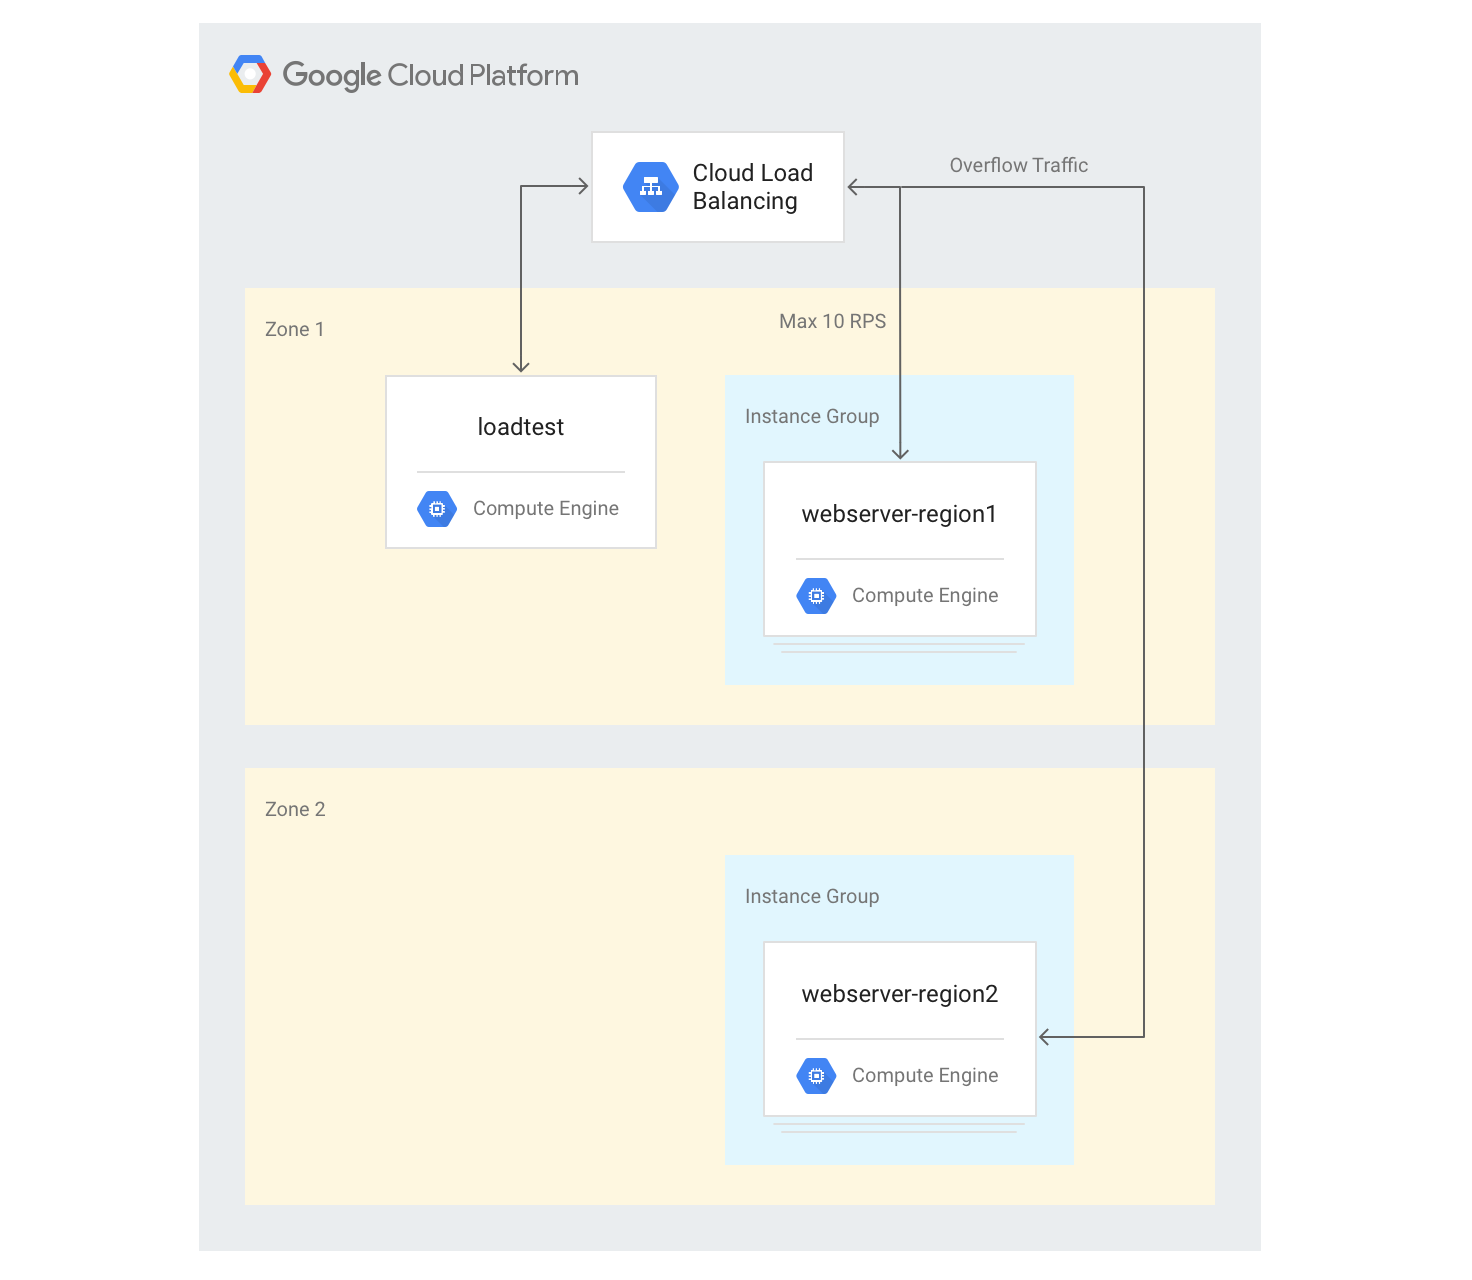
If you use a global application with an external Application Load Balancer and if you have backends deployed in multiple regions, when capacity overload occurs in a single region, traffic automatically flows to another region. You can validate this by adding a second VM instance group in another region to the configuration you created in the previous section.

Creating servers in multiple regions
In the following steps, you'll add another group of backends in another region and assign a capacity of 10 RPS per region. You can then see how load balancing reacts when this limit is exceeded.
In Cloud Shell, choose a zone in a region different than your default zone and set it as an environment variable:
export ZONE2=[zone]
Create a new instance group in the second region with 3 VM instances:
gcloud compute instance-groups managed create webserver-region2 \
    --size=3 --template=webservers --zone $ZONE2
Add the instance group to the existing backend service with a maximum capacity of 10 RPS:
gcloud compute backend-services add-backend web-service \
    --global --instance-group=webserver-region2 \
    --instance-group-zone $ZONE2 --max-rate 10
Adjust the
max-rateto 10 RPS for the existing backend service:gcloud compute backend-services update-backend web-service \ --global --instance-group=webserver-region1 \ --instance-group-zone $ZONE --max-rate 10After all instances boot up, sign in to the
loadtestVM instance:gcloud compute ssh loadtest
Run 500 requests at 10 RPS. Replace
[IP_address]with the IP address of the load balancer:httperf --server [IP_address] --num-conns 500 --rate 10 2>&1| grep 'ion time'
You see results like the following:
Connection time [ms]: min 405.9 avg 584.7 max 1390.4 median 531.5 stddev
181.3
Connection time [ms]: connect 1.1
The results are similar to those produced by the regional load balancer.
Because your testing tool immediately runs a full load and doesn't slowly increase the load like a real-world implementation, you have to repeat the test a couple of times for the overflow mechanism to take effect. Run 500 requests 5 times at 20 RPS. Replace
[IP_address]with the IP address of the load balancer.for a in \`seq 1 5\`; do httperf --server [IP_address] \ --num-conns 500 --rate 20 2>&1| grep 'ion time' ; doneYou see results like the following:
Connection time [ms]: min 426.7 avg 6396.8 max 13615.1 median 7351.5 stddev
3226.8
Connection time [ms]: connect 0.9
Connection time [ms]: min 417.2 avg 3782.9 max 7979.5 median 3623.5 stddev
2479.8
Connection time [ms]: connect 0.9
Connection time [ms]: min 411.6 avg 860.0 max 3971.2 median 705.5 stddev 492.9
Connection time [ms]: connect 0.7
Connection time [ms]: min 407.3 avg 700.8 max 1927.8 median 667.5 stddev 232.1
Connection time [ms]: connect 0.7
Connection time [ms]: min 410.8 avg 701.8 max 1612.3 median 669.5 stddev 209.0
Connection time [ms]: connect 0.8
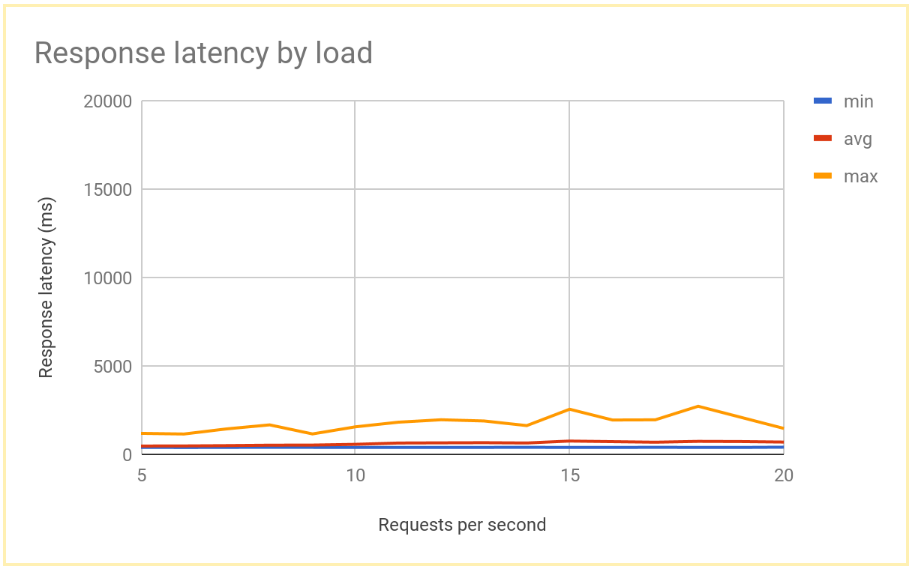
After the system stabilizes, the average response time is 400 ms at 10 RPS, and only increases to 700 ms at 20 RPS. This is a huge improvement over the 5000 ms delay offered by a regional load balancer, and results in a much better user experience.
The following graph shows the measured response time by RPS using global load balancing:

Comparing results of regional and global load balancing
After you've established the capacity of a single node, you're able to compare the latency observed by end users in a region-based deployment to the latency in a global load-balancing architecture. Although the number of requests into a single region is lower than the total serving capacity in that region, both systems have a similar end-user latency, because users are always redirected to the closest region.
When the load to a region surpasses the serving capacity for that region, the end-user latency differs significantly between the solutions:
Regional load-balancing solutions become overloaded when traffic increases past capacity, because traffic cannot flow anywhere but to the overloaded backend VM instances. This includes traditional on-premises load balancers, external passthrough Network Load Balancers on Google Cloud, and external Application Load Balancers in a single region configuration (for example, using Standard Tier networking). Average and maximum request latencies increase by more than a factor of 10, leading to poor user experiences which might in turn lead to significant user drop-off.
Global external Application Load Balancers with backends in multiple regions allow traffic to overflow to the closest region that has available serving capacity. This leads to a measurable but comparatively low increase in end-user latency, and provides a much better user experience. If your application isn't able to scale out in a region quickly enough, the global external Application Load Balancer is the recommended option. Even during full-region failure of user application servers, traffic is quickly redirected to other regions, and helps avoid a full service outage.
Clean up
Delete the project
The easiest way to eliminate billing is to delete the project that you created for the tutorial.
To delete the project:
- In the Google Cloud console, go to the Manage resources page.
- In the project list, select the project that you want to delete, and then click Delete.
- In the dialog, type the project ID, and then click Shut down to delete the project.
What's next
The following pages provide more information and background about Google's load balancing options:
- Optimizing Application Latency with Cloud Load Balancing
- Networking 101 Codelab
- External passthrough Network Load Balancer
- External Application Load Balancer
- External proxy Network Load Balancer
