Cloud DNS 모니터링 대시보드 사용
이 페이지에서는 Cloud DNS의 (비공개 영역) 사전 정의된 모니터링 대시보드에 대한 정보를 제공합니다.
대시보드에 액세스하려면 Google Cloud 콘솔에서 대시보드 페이지로 이동합니다.
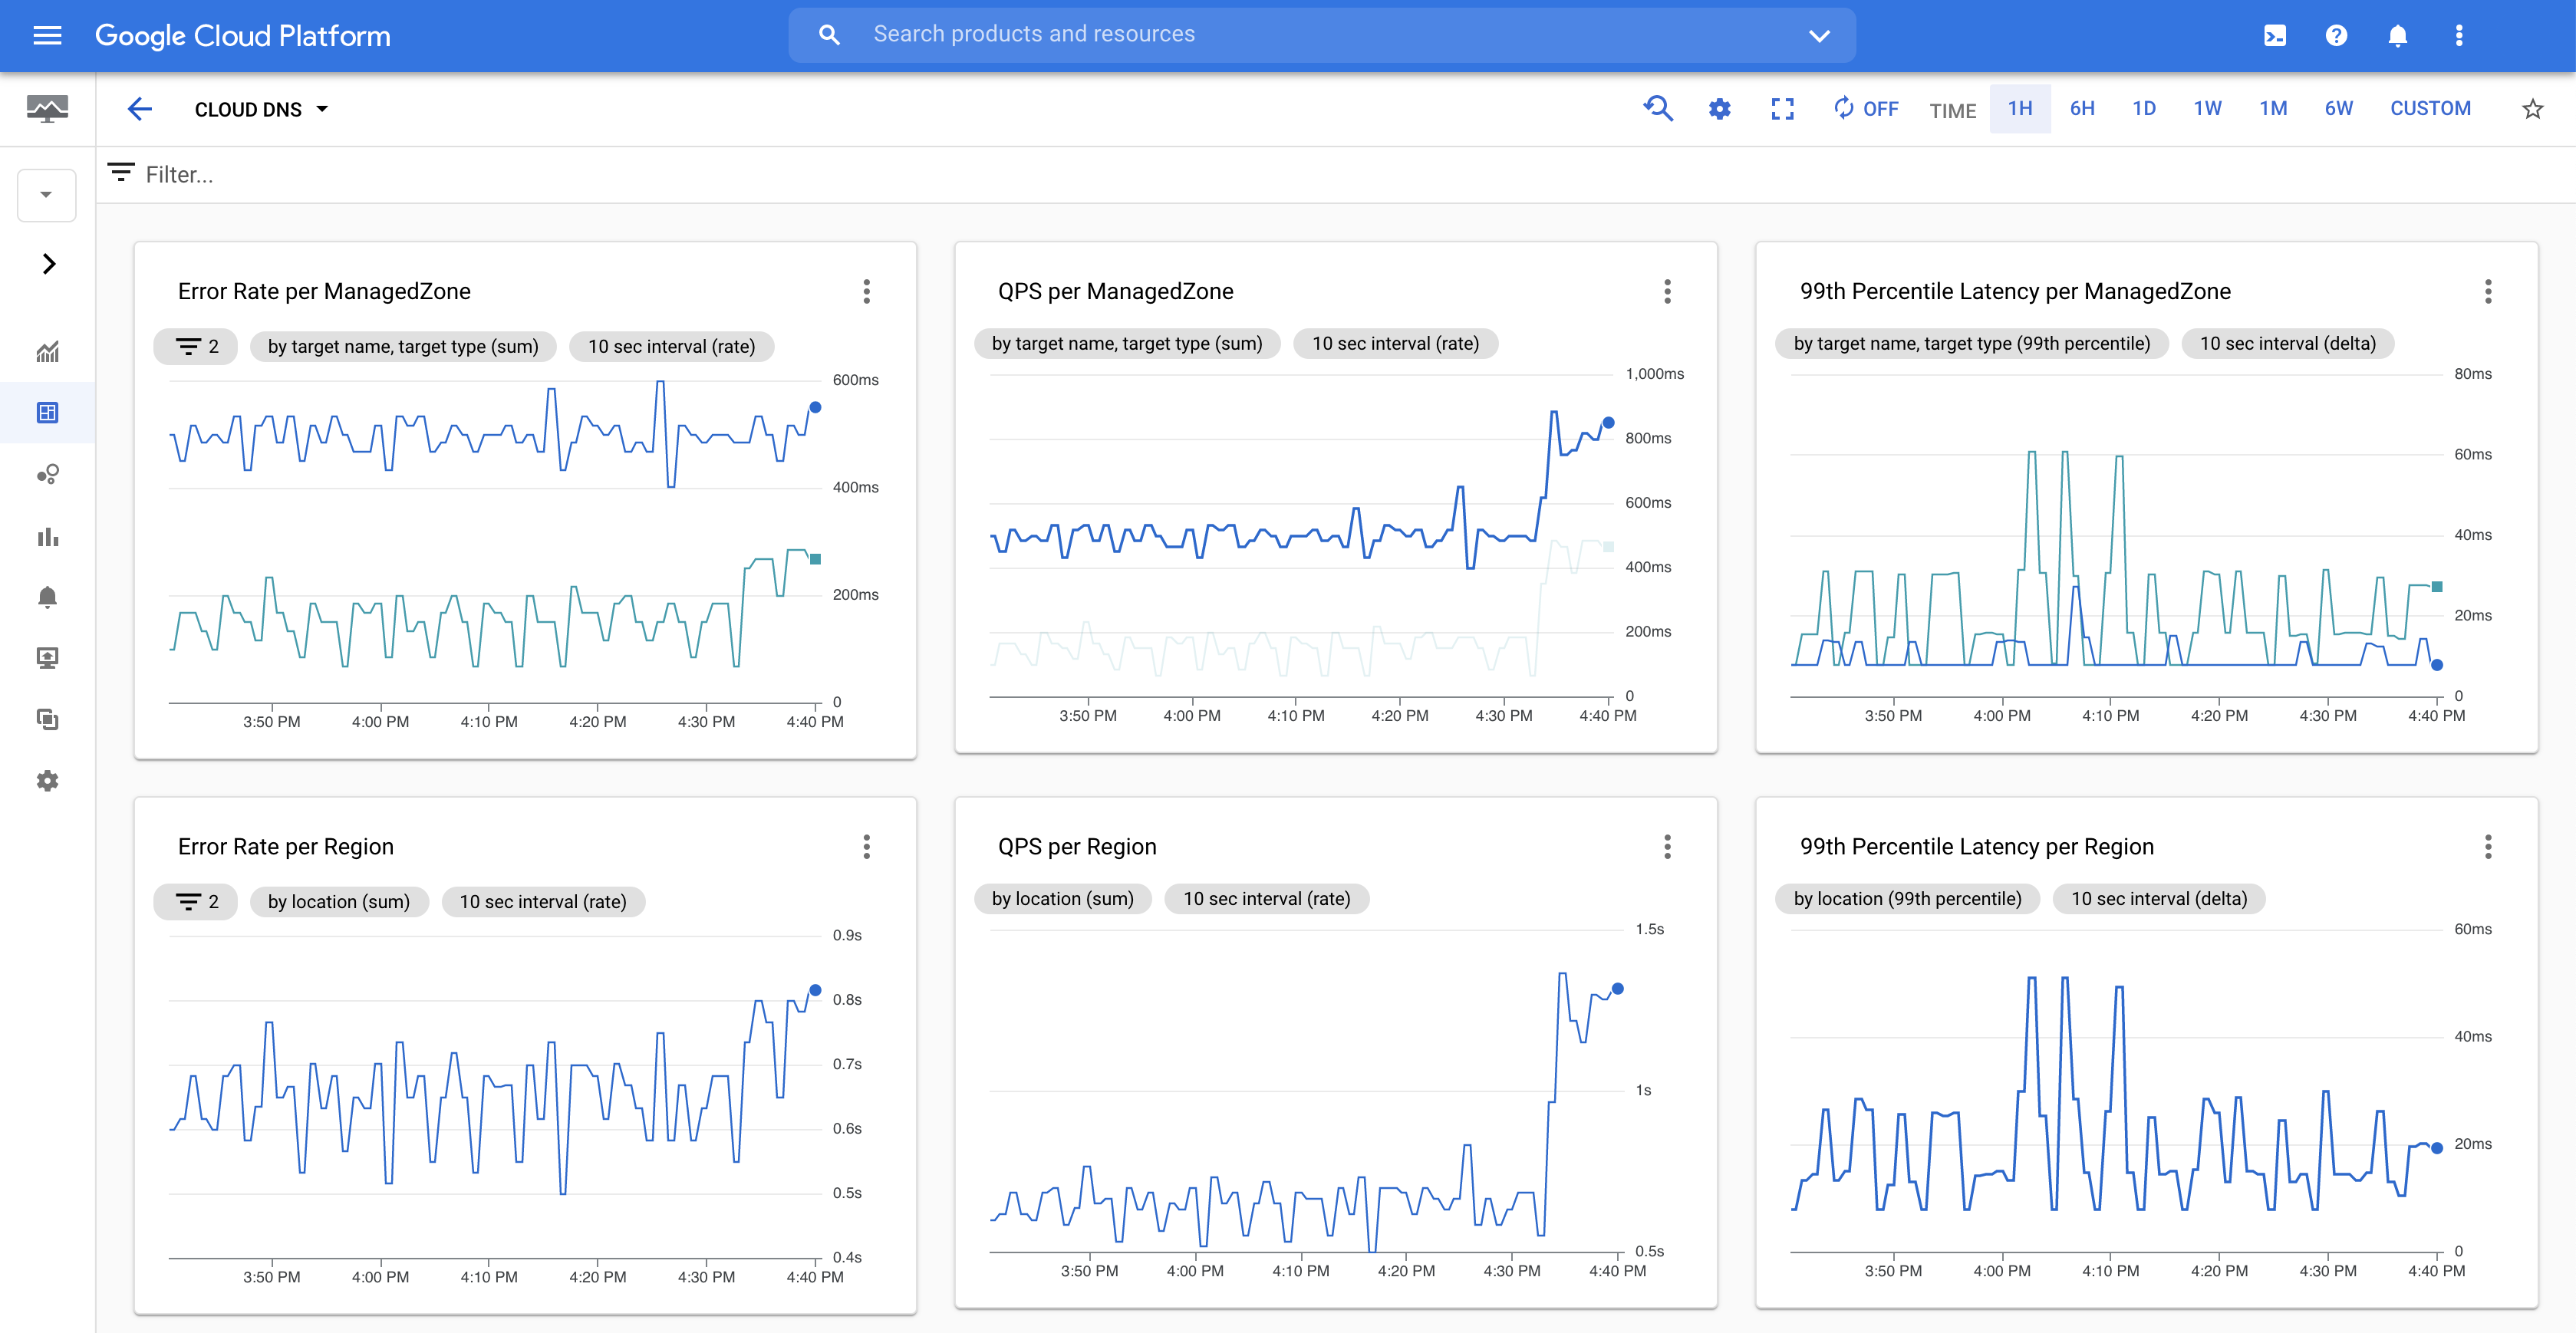 Cloud DNS 모니터링 대시보드(확대하려면 클릭)
Cloud DNS 모니터링 대시보드를 사용하면 DNS 쿼리의 차트를 보고 오류율, QPS, 99번째 백분위수 지연 시간 데이터를 표시할 수 있습니다.
모니터링 페이지에서는 데이터 표시 방법을 선택할 수 있습니다.
 Google Cloud 콘솔 모니터링 페이지(확대하려면 클릭)
다음 작업이나 기타 작업을 수행하려면 개별 차트의 오른쪽 상단에 있는 more_vert메뉴를 클릭합니다.
- 측정항목 탐색기에서 보기 이렇게 하면 측정항목 탐색기에서 그래프를 열어 필요에 따라 입력 매개변수를 수정하고 데이터를 실험할 수 있습니다.
실제 대시보드에 있는 그래프의 내용은 변경되지 않습니다.
- 차트 범례 펼치기 이렇게 하면 그래프의 각 선을 설명하는 범례를 볼 수 있습니다.
- 통계 모드 보기 이를 통해 데이터의 추가 통계를 보여주는 선이 추가로 표시된 차트를 볼 수 있습니다. 예를 들어, 99번째 백분위수 지연 시간 차트에서는 평균, 중앙값, 5번째 백분위수도 표시됩니다.
페이지 오른쪽 상단의 메뉴에서 차트의 기간을 조정할 수 있습니다.
달리 명시되지 않는 한 이 페이지의 콘텐츠에는 Creative Commons Attribution 4.0 라이선스에 따라 라이선스가 부여되며, 코드 샘플에는 Apache 2.0 라이선스에 따라 라이선스가 부여됩니다. 자세한 내용은 Google Developers 사이트 정책을 참조하세요. 자바는 Oracle 및/또는 Oracle 계열사의 등록 상표입니다.
최종 업데이트: 2025-10-29(UTC)
[[["이해하기 쉬움","easyToUnderstand","thumb-up"],["문제가 해결됨","solvedMyProblem","thumb-up"],["기타","otherUp","thumb-up"]],[["이해하기 어려움","hardToUnderstand","thumb-down"],["잘못된 정보 또는 샘플 코드","incorrectInformationOrSampleCode","thumb-down"],["필요한 정보/샘플이 없음","missingTheInformationSamplesINeed","thumb-down"],["번역 문제","translationIssue","thumb-down"],["기타","otherDown","thumb-down"]],["최종 업데이트: 2025-10-29(UTC)"],[],[]]