This page provides information about Cloud DNS's (private zone) predefined monitoring dashboard.
To access the dashboard, in the Google Cloud console, go to the Dashboards page.

The Cloud DNS monitoring dashboard lets you view charts for DNS queries, and displays data for error rate, QPS, and 99th percentile latency.
The monitoring page lets you choose how the data is displayed.
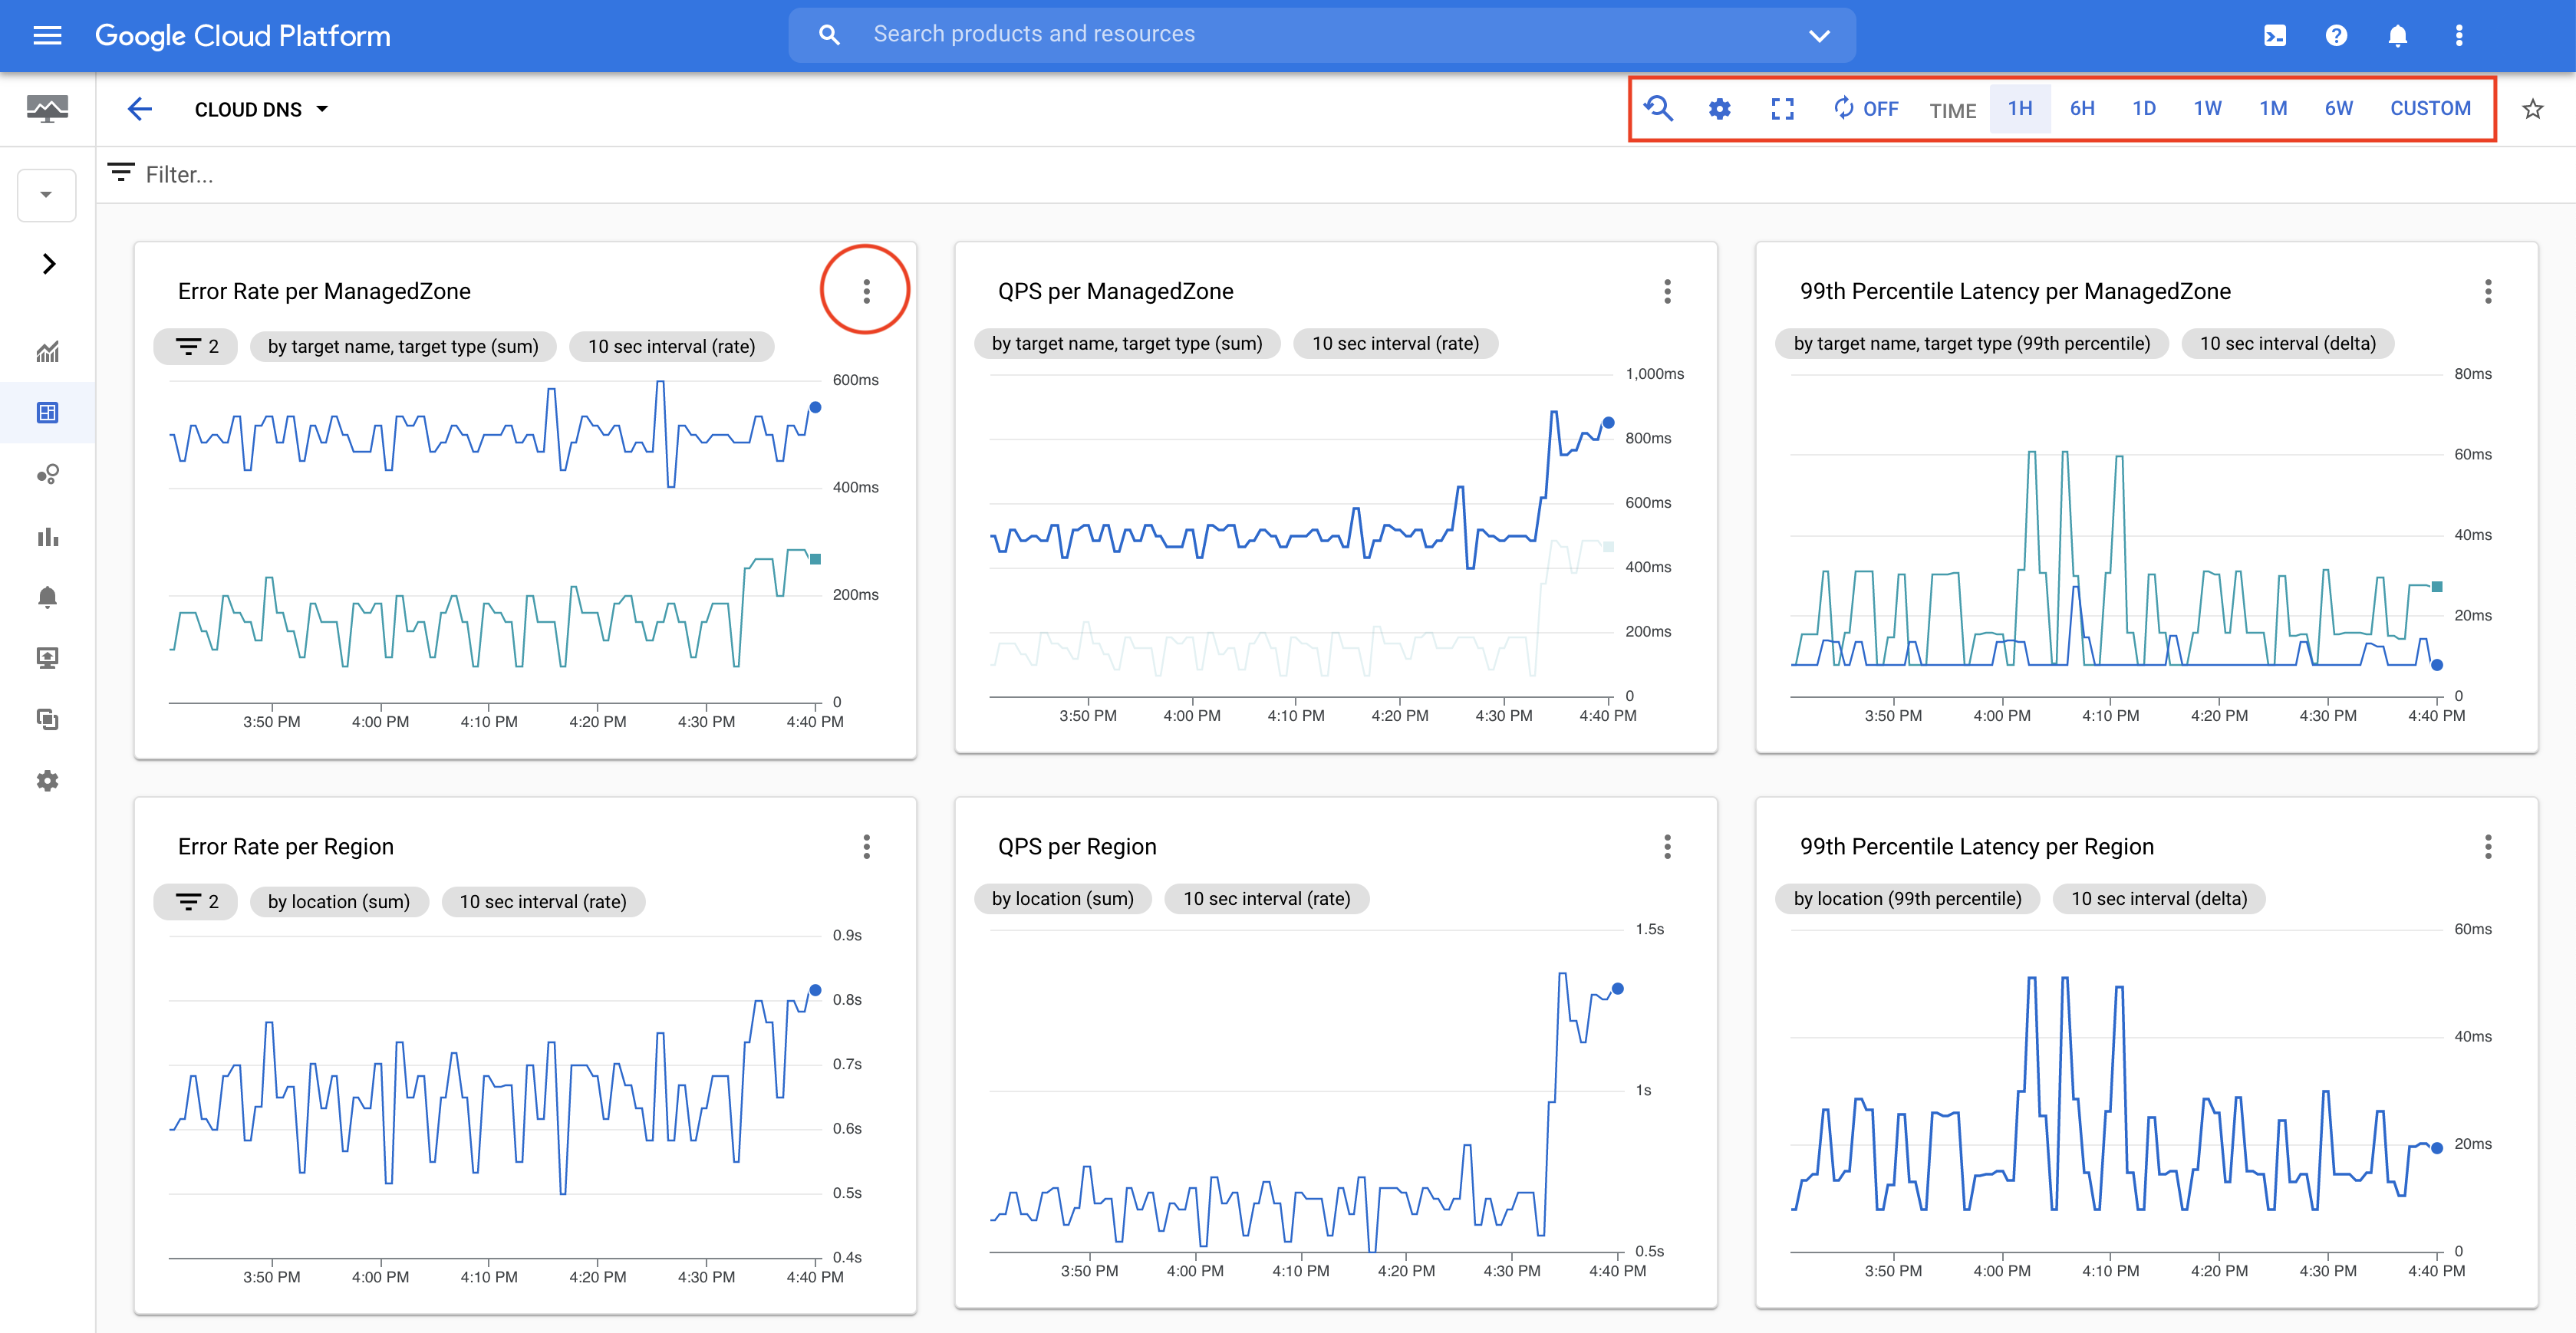
To do the following (and more), click more_vertMenu at the top right of an individual chart:
- View in Metrics Explorer. This lets you open the graph in Metrics Explorer so that you can edit input parameters as needed and experiment with the data. This does not change the contents of the graph in the actual dashboard.
- Expand chart legend. This lets you view a legend that describes each line on the graph.
- View Stats Mode. This lets you view a chart with more lines that show additional statistics on the data. For example, in the 99th Percentile Latency charts, mean, median, and 5th percentile are also shown.
In the menu at the top right of the page, you can adjust the timescale of the charts.