Cloud DNS モニタリング ダッシュボードを使用する
このページでは、Cloud DNS の(限定公開ゾーン)事前定義モニタリング ダッシュボードについて説明します。
ダッシュボードにアクセスするには、 Google Cloud コンソールで [ダッシュボード] ページに移動します。
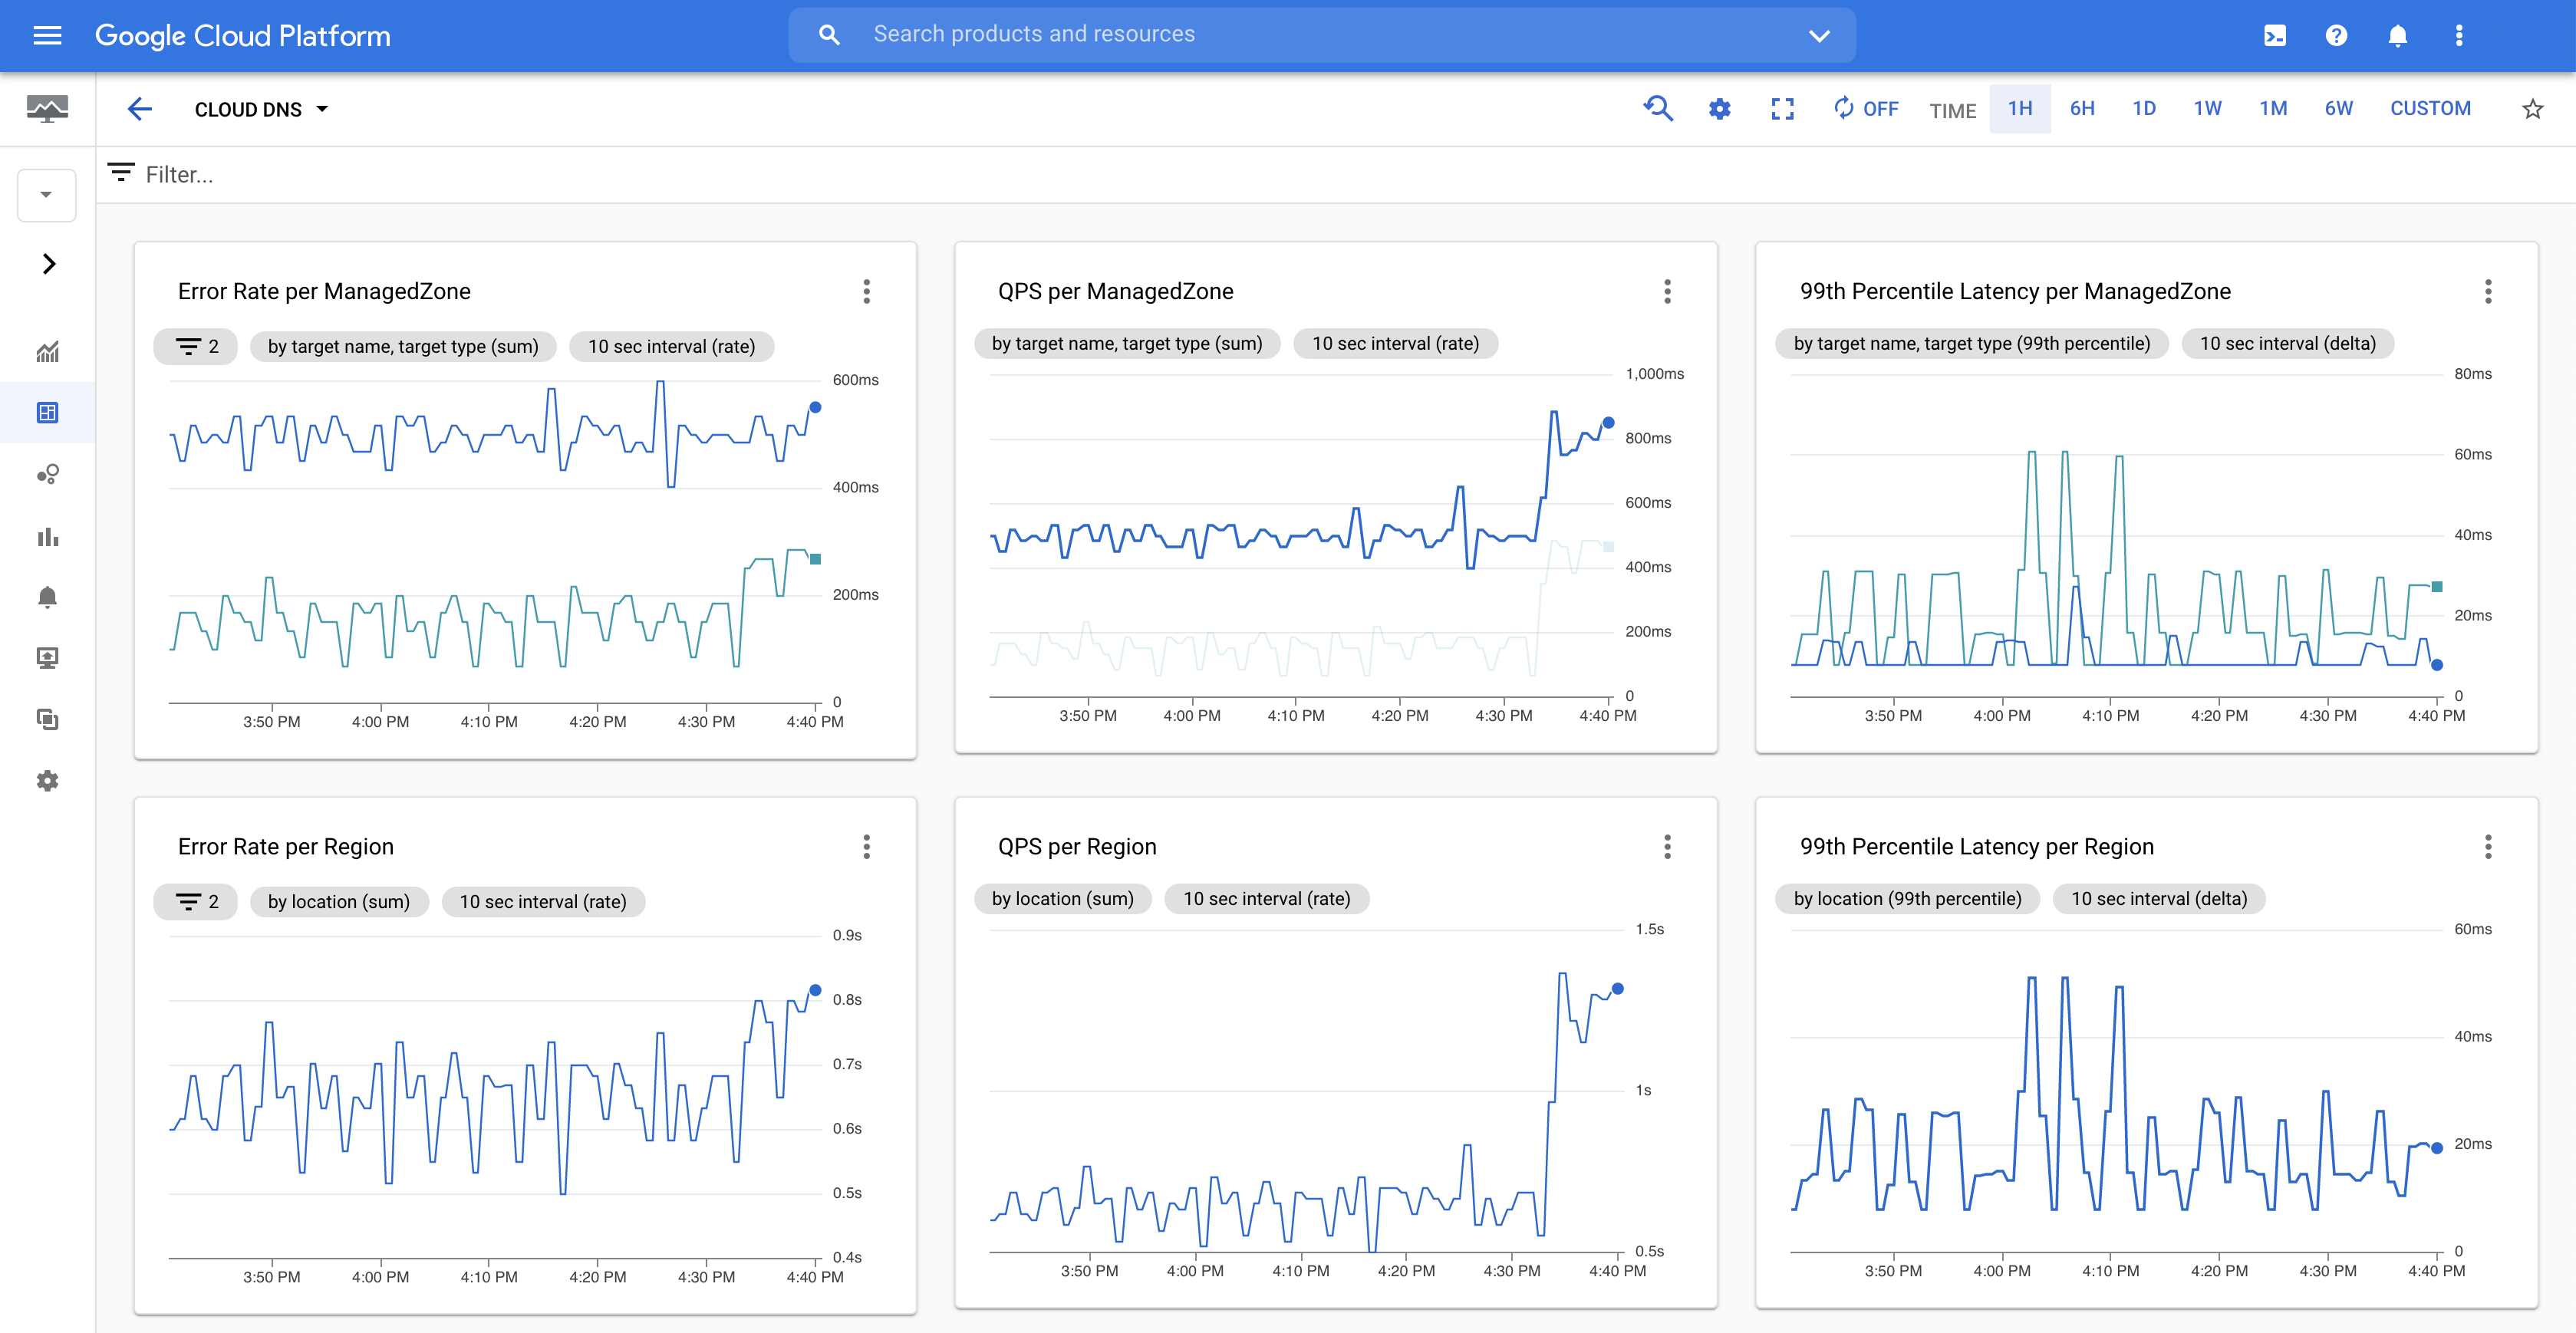 Cloud DNS モニタリング ダッシュボード(クリックして拡大)
Cloud DNS モニタリング ダッシュボードには、DNS クエリのグラフが表示され、エラー率、QPS、99 パーセンタイル レイテンシに関するデータが表示されます。
モニタリング ページでは、データの表示方法を選択できます。
![ツールバーと [その他] メニューがハイライト表示されたGoogle Cloud コンソールのモニタリング ページ。](https://cloud-dot-devsite-v2-prod.appspot.com/static/dns/images/dashboard_marked.png?hl=ja) Google Cloud コンソールのモニタリング ページ(クリックして拡大)
Google Cloud コンソールのモニタリング ページ(クリックして拡大)
次の操作を行うには、個々のグラフの右上にある more_vert メニューをクリックします。
- Metrics Explorer で表示する。Metrics Explorer でグラフを開き、必要に応じて入力パラメータを編集して、データを試すことができます。実際のダッシュボードのグラフの内容は変わりません。
- グラフの凡例を展開する。グラフ上の各線を説明する凡例を表示できます。
- 統計情報モードにする。グラフに表示される線を増やし、追加の統計情報を表示できます。たとえば、99 パーセンタイルのレイテンシ グラフの場合、平均、中央値、5 パーセンタイルを表示できます。
ページの右上にあるメニューで、グラフの時間尺度を調整できます。
特に記載のない限り、このページのコンテンツはクリエイティブ・コモンズの表示 4.0 ライセンスにより使用許諾されます。コードサンプルは Apache 2.0 ライセンスにより使用許諾されます。詳しくは、Google Developers サイトのポリシーをご覧ください。Java は Oracle および関連会社の登録商標です。
最終更新日 2025-10-19 UTC。
[[["わかりやすい","easyToUnderstand","thumb-up"],["問題の解決に役立った","solvedMyProblem","thumb-up"],["その他","otherUp","thumb-up"]],[["わかりにくい","hardToUnderstand","thumb-down"],["情報またはサンプルコードが不正確","incorrectInformationOrSampleCode","thumb-down"],["必要な情報 / サンプルがない","missingTheInformationSamplesINeed","thumb-down"],["翻訳に関する問題","translationIssue","thumb-down"],["その他","otherDown","thumb-down"]],["最終更新日 2025-10-19 UTC。"],[],[]]