Database Migration Service collects and displays migration job metrics that represent the health and progress of your data migration process. This page describes the following areas associated with migration job metrics:
Metrics available on the migration job details page covers the observability information you can view directly in Database Migration Service on the migration job details page.
Metrics available in Cloud Monitoring describes all metrics related to migration job performance, including the metrics surfaced from the PostgreSQL destination cluster.
Metrics available on the migration job details page
The migration job details page shows several diagrams that can help you understand the current state and progress of your migration job. Some diagrams provide database-level information, while others focus on table-level data.
Expand the following sections to learn more about each diagram and its associated metric.
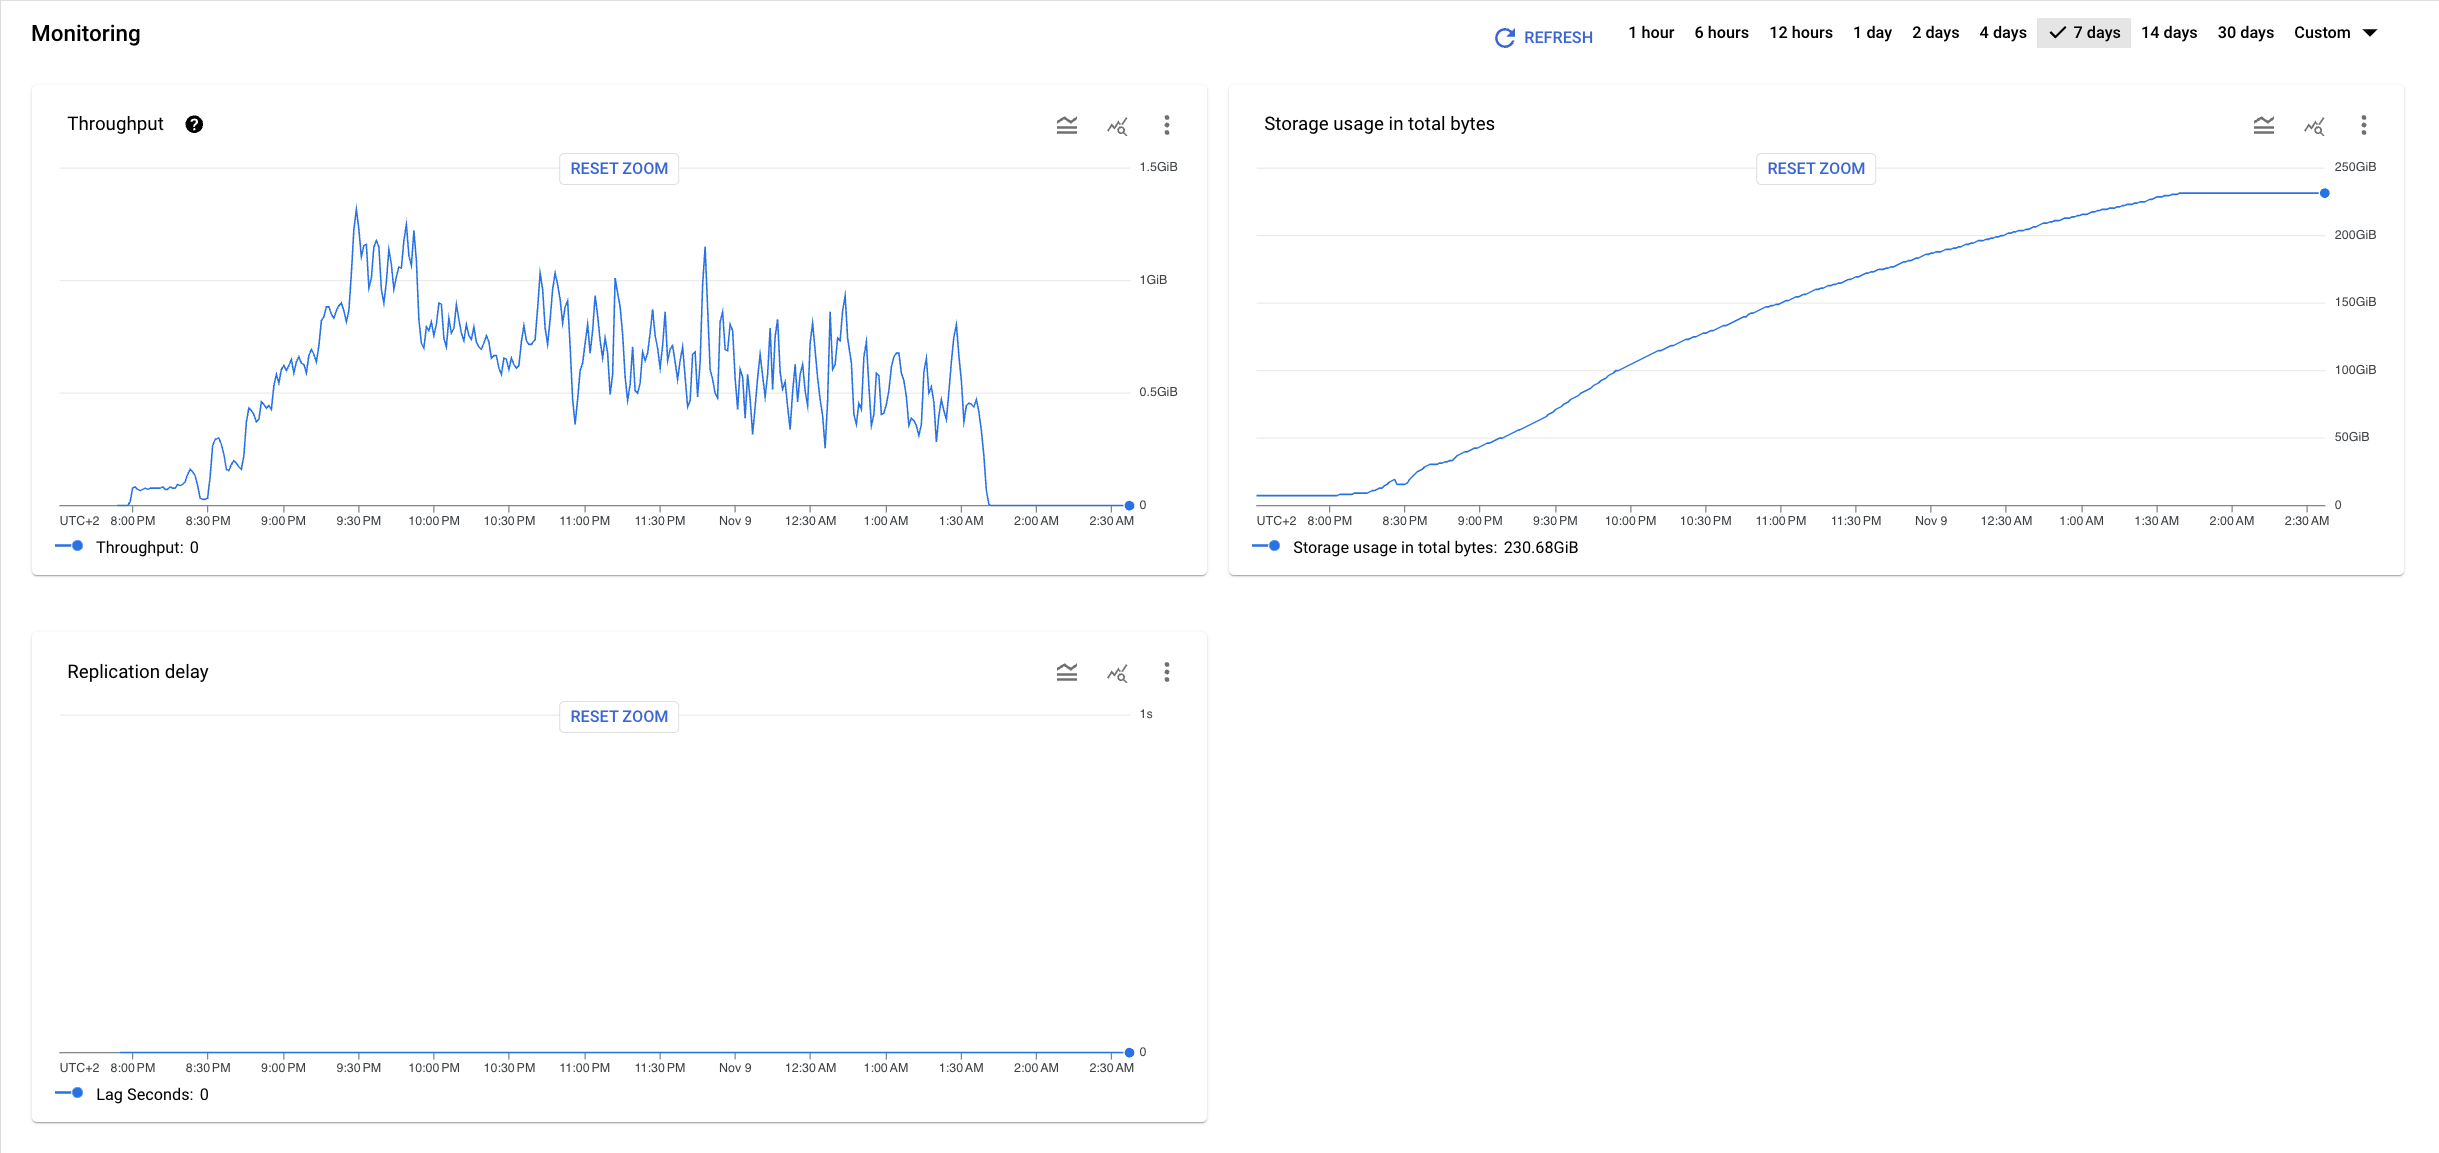
Throughput
The Throughput diagram uses the
migration_job/write_bytes_count metric to represent
how much data (in bytes) Database Migration Service has written to your destination
database. This metric is sampled every 60 seconds. You can use it to observe
the write speed of your migration.
This metric is available in the aggregated view, as well as separately for each table included in your migration job.
Full dump volume
The Full dump volume diagram shows the progress of the full dump phase expressed as the percentage of total full dump data migrated. This metric is available in the aggregated view, as well as separately for each table included in your migration job.
- The aggregated view diagram uses the
migration_job/fulldump_progress_percentagemetric. - The table-level diagrams use the
migration_job/fulldump_progress_percentage_per_objectmetric.
Storage usage in total bytes
The Storage usage in total bytes diagram uses the Cloud SQL for PostgreSQL
database/disk/bytes_used metric to show how much data
(in bytes) is stored in the migrated database in your destination
Cloud SQL for PostgreSQL instance. You can use this information to estimate the progress
of your migration job.
Replication delay
The Replication delay diagram uses the
migration_job/max_replica_sec_lag metric to represent
the time difference between the moment when Database Migration Service starts
reading Change Data Capture (CDC) information in your source, and the moment
when that information is fully replicated in your destination.
You can use this information to estimate when to
promote the migration job
(you want to begin the cutoff process when replication lag is the lowest).
View metrics on the migration job details page
To view metric diagrams on the migration job details page, perform the following steps:
- In the Google Cloud console, go to the Migration jobs page.
- In the Jobs tab, click the display name of your migration job.
The migration job details page opens.
-
In the Monitoring section, use the View menu to adjust which diagrams you want to display:
- To view metrics aggregated for the whole migration job, click View > Aggregated.
- To view table-level metrics, click View > Tables, and then select your tables.
Metrics available in Cloud Monitoring
The following table describes all migration job metrics you can use to create charts in Metrics Explorer for heterogeneous Oracle migrations. The complete metrics Database Migration Service metrics reference lists several additional metrics, but they are not available for heterogeneous Oracle migrations.
You can also use the
Cloud SQL for PostgreSQL database/disk/bytes_used metric
and compare it with the total size of your source databases to estimate
the migration job progress.
| Metric type Launch stage Display name |
|
|---|---|
| Kind, Type, Unit Monitored resources |
Description Labels |
migration_job/fulldump_progress_percentage
BETA
(project)
Fulldump progress percentage |
|
GAUGE, DOUBLE, %
datamigration.googleapis.com/MigrationJob |
Progress percentage of the initial fulldump of the migration job.. Sampled every 60 seconds. After sampling, data is not visible for up to 180 seconds. |
migration_job/fulldump_progress_percentage_per_object
BETA
(project)
Fulldump progress percentage per object |
|
GAUGE, DOUBLE, %
datamigration.googleapis.com/MigrationJob |
Progress percentage of the initial fulldump of a single table in a migration job. Sampled every 60 seconds. After sampling, data is not visible for up to 180 seconds. |
migration_
BETA
Write Bytes Count |
|
DELTA, INT64, By
datamigration.googleapis.com/MigrationJob |
Number of bytes written to the destination. Sampled every 60 seconds. After sampling, data is not visible for up to 180 seconds.
database: Database name.
|
migration_
BETA
Max lag bytes of the migration job data. |
|
GAUGE, INT64, By
datamigration.googleapis.com/MigrationJob |
Current replication lag, aggregated across all of the migration job's data. Sampled every 60 seconds. After sampling, data is not visible for up to 180 seconds.
database: Database name.
|
migration_
BETA
Max lag in seconds of the migration job data |
|
GAUGE, INT64, s
datamigration.googleapis.com/MigrationJob |
Current replication lag, aggregated across all of the migration job's data. Sampled every 60 seconds. After sampling, data is not visible for up to 180 seconds.
database: Database name.
|
migration_job/unsupported_events_count
BETA
(project)
Unsupported Events Count |
|
DELTA, INT64, By
datamigration.googleapis.com/MigrationJob |
Number of unsupported events per migration and per table. Sampled every 60 seconds. After sampling, data is not visible for up to 180 seconds. |