Google Cloud Observability 提供监控、日志记录和诊断工具。这些工具可帮助您监控和分析 Cloud Tasks 活动和增长情况,并了解应用的行为、运行状况和性能。
默认情况下,Cloud Tasks 会配置为执行以下操作:
- 将数据和系统审核日志发送到 Cloud Logging。您可以使用收集的日志来调试应用、排查应用问题并获取有关应用的数据洞见。
- 将系统和资源指标发送到 Cloud Monitoring。您可以使用收集的指标来监控运行状况和性能、识别趋势和问题,并通知行为变化。
将审核日志发送到 Cloud Logging
Cloud Tasks 会将以下类型的审核日志数据发送到 Cloud Logging:
数据访问审核日志默认处于停用状态,因为这些审核日志可能非常大。
如需了解详情,请参阅 Cloud Tasks 审核日志记录。
将 Cloud Logging 与队列搭配使用
您可以将 Cloud Logging 与 Cloud Tasks 队列搭配使用。系统会记录以下操作:
- 任务操作:
CreateTaskDeleteTask
- 尝试操作:
AttemptDispatchAttemptResponse
启用日志记录
您可以使用 Google Cloud 控制台或 Google Cloud CLI 启用日志记录。
控制台
在 Google Cloud 控制台中,前往 Cloud Tasks > 队列页面。
点击要为其启用日志记录的队列的名称。
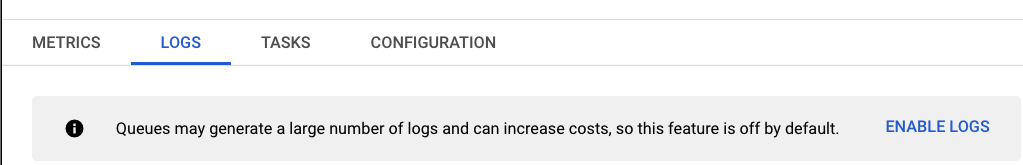
在队列详情页面上,点击日志标签页。
点击启用日志,然后点击启用进行确认。
gcloud
如需启用日志记录,您可以使用 gcloud tasks queues create 或 gcloud tasks queues update 命令。
gcloud tasks queues create QUEUE_ID \
    --log-sampling-ratio=LOG_SAMPLING_RATION
或
gcloud tasks queues update QUEUE_ID \
    --log-sampling-ratio=LOG_SAMPLING_RATIO
替换以下内容:
QUEUE_ID:队列的 IDLOG_SAMPLING_RATIO:记录的操作的比例。介于1.0和0.0之间的任何值都会记录相应比例的操作。如需记录所有操作,请将其设置为1.0。如需不记录任何操作,请将其设置为0.0(这是默认设置)。
停用日志记录
您可以使用 Google Cloud 控制台或 Google Cloud CLI 停用日志记录。
控制台
在 Google Cloud 控制台中,前往 Cloud Tasks > 队列页面。
点击要停用日志记录的队列的名称。
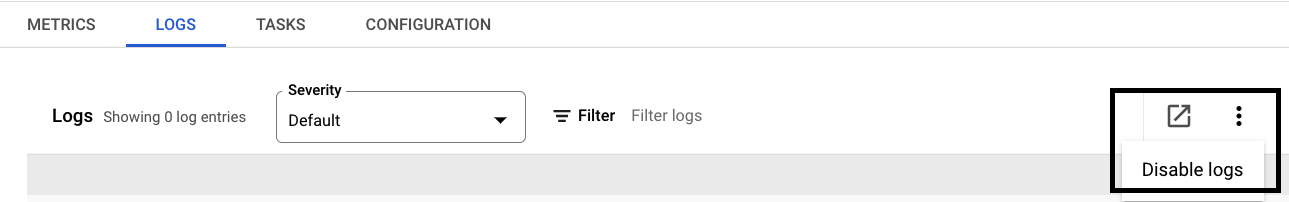
在队列详情页面上,点击日志标签页。
依次点击省略号图标 > 停用日志。点击停用进行确认。
gcloud
如需停用日志记录,请使用 gcloud tasks queues update 命令并将 log-sampling-ratio 标志设置为 0.0。
gcloud tasks queues update QUEUE_ID \
    --log-sampling-ratio=0.0
将 QUEUE_ID 替换为您的队列的 ID。
查询和查看日志
您可以使用以下工具来查看和分析日志:
- Logs Explorer 旨在帮助您排查问题并分析服务和应用的性能。如需了解如何在 Logs Explorer 中查看日志,请按照使用 Logs Explorer 查看日志中的说明操作。
- Log Analytics 旨在运行查询以分析日志,然后查看结果或绘制结果图表。如需了解如何使用 Log Analytics,请按照使用 Log Analytics 查询和分析日志中的说明操作。
通过在搜索字段中搜索 cloudtasks,您可以在 Logs Explorer 中过滤 Cloud Tasks 日志。
如需详细了解如何查询和分析日志,请参阅查询和查看日志概览。
将指标发送到 Cloud Monitoring
Cloud Tasks 会将受监控的资源的指标数据发送到 Google Cloud Observability。Monitoring 中受监控的资源表示虚拟机、数据库或应用等逻辑实体或物理实体。受监控的资源包含一组独特的指标,可通过信息中心进行探索、报告或用于创建提醒。
Cloud Tasks 会将以下受监控的资源的指标数据发送到 Google Cloud Observability:
此外,每个资源还具有一组资源标签,这些标签是键值对,包含有关资源的其他信息。资源标签适用于与资源关联的所有指标,详见下表。
资源指标和标签
此表中的“指标类型”字符串必须以 cloudtasks.googleapis.com/ 为前缀。表中的条目已省略该前缀。
查询标签时,请使用 metric.labels. 前缀;例如 metric.labels.LABEL="VALUE"。
| 指标类型发布阶段 (资源层次结构级别 显示名称 |
|
|---|---|
| 种类、类型、单位 受监控的资源 |
说明 标签 |
api/request_count
GA
(项目)
API 请求 |
|
DELTA, INT64, 1
cloud_tasks_queue |
Cloud Tasks API 调用的次数。
每 60 秒采样一次。采样后,数据在最长 240 秒的时间内不会显示。api_method:
调用的 API 方法(如 CreateTask)。
response_code:
作为字符串的规范响应代码(如“ok”)。
|
queue/depth
GA
(项目)
队列深度 |
|
GAUGE, INT64, 1
cloud_tasks_queue |
队列中的任务数量。每 60 秒采样一次。采样后,数据在最长 120 秒的时间内不会显示。 |
queue/task_attempt_count
GA
(项目)
任务尝试次数 |
|
DELTA, INT64, 1
cloud_tasks_queue |
由响应代码细分的任务尝试次数。
每 60 秒采样一次。采样后,数据在最长 180 秒的时间内不会显示。response_code:
作为字符串的规范响应代码(如“ok”)。
|
queue/task_attempt_delays
GA
(项目)
任务尝试延迟时间 |
|
DELTA, DISTRIBUTION, ms
cloud_tasks_queue |
每个预定的尝试时间与实际尝试时间之间的延迟。 每 60 秒采样一次。采样后,数据在最长 120 秒的时间内不会显示。 |
世界协调时间 (UTC) 2025-09-25 18:39:38 生成的表。
如需查看所有资源类型,请参阅受监控的资源类型。如需查看所有指标类型,请参阅 Google Cloud 指标。
读取指标数据
您可以使用 Cloud Monitoring API 中的 timeSeries.list 方法来读取指标数据(也称为时序数据)。目前有多种方式可调用该方法,包括使用特定语言的客户端库,或使用 Metrics Explorer 创建图表。有关指标和时序的介绍,请参阅指标、时序和资源。如需了解如何读取指标数据,请参阅检索时序数据。
使用 Monitoring 信息中心和提醒
您可以使用 Monitoring 信息中心及其关联图表来直观呈现 Cloud Tasks 指标的数据。
要在 Monitoring 中监控这些指标,您可以创建自定义信息中心。您还可以基于这些指标添加提醒。