This page describes how to use the Query insights dashboard to detect and analyze performance problems with your queries.
Introduction
Query insights helps you detect, diagnose, and prevent query performance problems for Cloud SQL databases. It supports intuitive monitoring and provides diagnostic information that helps you go beyond detection to identify the root cause of performance problems.
Query insights helps you improve Cloud SQL query performance by guiding you through the following steps:
Query insights for Cloud SQL Enterprise Plus edition
If you're using Cloud SQL Enterprise Plus edition, then you can access additional capabilities in query insights to perform advanced query performance diagnostics. In addition to the standard capabilities of the Query insights dashboard, query insights for Cloud SQL Enterprise Plus edition lets you do the following:
- Capture longer query text up to 20 KB.
- Capture query plans for all executed queries.
- Sample up to 200 query plans per minute.
- Maintain a longer 30-day retention of metrics.
- Obtain index recommendations from index advisor.
- Terminate a session or long-running transaction in active queries.
- Access AI-assisted troubleshooting (Preview).
The following table compares functional requirements and capabilities of query insights for Cloud SQL Enterprise edition with query insights for Cloud SQL Enterprise Plus edition.
| Comparison area | Query insights for Cloud SQL Enterprise edition | Query insights for Cloud SQL Enterprise Plus edition |
|---|---|---|
| Supported database versions |
All versions of the following instances:
Query insights isn't supported on SQL Server Express edition instances |
SQL Server Enterprise version 2019 or 2022 |
| Supported machine types | Supported on all machine types | Not supported on instances that use a shared core machine type |
| Supported regions | Cloud SQL regional locations | Cloud SQL Enterprise Plus edition regional locations |
| Metrics retention period | 7 days | 30 days |
| Query length limit maximum | 4500 bytes | 20 KB |
| Query plan sample maximum | Not available | 200 |
| Index advisor recommendations | Not available | Available |
| Terminate sessions or long-running transactions in active queries | Not available | Available |
| AI-assisted troubleshooting (Preview) | Not available | Available |
| Query cardinality limits | Reports the aggregated statistics for all queries. | Reports the aggregated statistics for all queries. |
Enable query insights for Cloud SQL Enterprise Plus edition
To enable query insights for Cloud SQL Enterprise Plus edition, select Enable Enterprise Plus features when you Enable query insights on your Cloud SQL Enterprise Plus edition instance.
Pricing
There's no additional cost for query insights on Cloud SQL Enterprise edition or Cloud SQL Enterprise Plus edition instances.
Storage requirements
Query insights stores metrics data on the instance and requires that you keep the automatic storage increases setting enabled. Applicable storage fees apply.
Limitations
The following limitations apply to query insights for Cloud SQL Enterprise Plus edition instances:
- If your instance is undergoing heavy system load, then when you query metrics data in the Query insights dashboard, your queries might be slow to load or time out.
- If you recreate a read replica, then the recreated read replica doesn't maintain its previous metrics history.
- When restoring a query insights for Cloud SQL Enterprise Plus edition instance from an older backup, you might lose the metrics collected between the time the backup was taken and the time you restore the instance. For example, if you restore your instance on April 30 with a backup taken on April 25, then you might lose all the metrics between April 25 and April 30.
Before you begin
Before you use query insights, do the following.
- Add required roles and permissions.
- Enable the Cloud Trace API.
- If you're using query insights for Cloud SQL Enterprise edition or query insights for Cloud SQL Enterprise Plus edition, then make sure that Enable automatic storage increases is enabled for the instance.
Required roles and permissions
To get the permissions that you need to access historical query execution data in the Query insights dashboard, ask your administrator to grant you the following IAM roles on the project that hosts the Cloud SQL instance:
-
Database Insights Monitoring Viewer (
roles/databaseinsights.monitoringViewer) -
Cloud SQL Viewer (
roles/cloudsql.viewer)
For more information about granting roles, see Manage access to projects, folders, and organizations.
You might also be able to get the required permissions through custom roles or other predefined roles.
Enable the Cloud Trace API
To view query plans and their end-to-end views, your Google Cloud project must have the Cloud Trace API enabled. This setting lets your Google Cloud project receive trace data from authenticated sources at no additional cost. This data can help you detect and diagnose performance issues in your instance.
To confirm that the Cloud Trace API is enabled, follow these steps:
- From the Google Cloud console, go to APIs and Services:
- Click Enable APIs and Services.
- In the search bar, enter
Cloud Trace API. - If API enabled is displayed, then this API is enabled and there's nothing for you to do. Otherwise, click Enable.
Enable automatic storage increases
If you're using query insights for Cloud SQL Enterprise Plus edition, then make sure that the instance setting to enable automatic storage increases remains enabled. By default, this option is enabled for Cloud SQL instances.
If you previously disabled this instance setting and want to enable query insights for Cloud SQL Enterprise Plus edition, then re-enable automatic storage increases first. You can't turn off automatic storage increases and enable query insights for Cloud SQL Enterprise Plus edition.
Enable query insights
When you enable query insights, all other operations are temporarily suspended. These operations include health checks, logging, monitoring, and other instance operations.
Console
Enable query insights for an instance
-
In the Google Cloud console, go to the Cloud SQL Instances page.
- To open the Overview page of an instance, click the instance name.
- On the Configuration tile, click Edit configuration.
- In the Customize your instance section, expand Query insights.
- Select the Enable Query insights checkbox.
- Optional: Select additional features for your instance. Some features are available only for Cloud SQL Enterprise Plus edition.
- Click Save.
| Feature | Description | Cloud SQL Enterprise edition | Cloud SQL Enterprise Plus edition |
|---|---|---|---|
| Enable Enterprise Plus features | Select this checkbox to enable query insights for Cloud SQL Enterprise Plus edition. Query insights for Cloud SQL Enterprise Plus edition lets you terminate sessions and long-running transactions in active queries, enables index advisor recommendations to help you speed up query processing, and increases metric data retention to 30 days. Index advisor recommendations are enabled automatically when you enable query insights for Cloud SQL Enterprise Plus edition. To disable index advisor recommendations, clear this checkbox. You must select this checkbox to enable index advisor recommendations and AI-assisted troubleshooting (Preview). | Not available | Available
Default: Disabled |
| AI-assisted troubleshooting | Select this checkbox to enable performance anomaly detection, root cause and situation analysis, and to obtain recommendations for fixing problems with your queries and database. This feature is is in Preview, and you can enable and access this feature only using the Google Cloud console. For more information, see Observe and troubleshoot with AI assistance. | Not available | Available
Default: Disabled |
| Customize query lengths |
Select this checkbox to customize the limit for the length of
a query string.
Higher query lengths are more useful for
analytical queries, but they also require more memory.
Any query string that goes above the specified limit becomes truncated
in the display. Changing the query length limit requires you to restart the instance. |
You can set the limit in bytes from
256 bytes to 4500 bytes.
Default: 1024.
|
You can
specify a limit in bytes from
256 to 20480.
Default: 10240 bytes (10 KB).
|
| Set the maximum sampling rate | Select this checkbox to set the maximum sampling rate. The sampling rate is the number of executed query plan samples that are captured per minute across all databases on the instance. Increasing the sampling rate is likely to give you more data points but might increase performance overhead. | You change this value to a number from 0 to 20.
Default: 5.
|
You can increase the maximum to 200 to provide more data
points.
Default: 5.
|
Enable query insights for multiple instances
-
In the Google Cloud console, go to the Cloud SQL Instances page.
- Click the More Actions menu on any row.
- Select Enable Query insights.
- In the dialog, select the Enable Query insights for multiple instances checkbox.
- Click Enable.
- In the subsequent dialog, select the instances for which you want to enable query insights.
- Click Enable Query insights.
gcloud
To enable query insights for a Cloud SQL instance by using
gcloud, run gcloud sql instances patch
with the --insights-config-query-insights-enabled flag as
follows after replacing INSTANCE_ID with the ID of the instance.
If you enable query insights for a Cloud SQL Enterprise Plus edition instance, then you enable index advisor recommendations automatically.
    gcloud sql instances patch INSTANCE_ID \
    --insights-config-query-insights-enabled
Also, use one or more of the following optional flags:
--insights-config-query-string-lengthSets the default query length limit. Higher query lengths are more useful for analytical queries, but they also require more memory. Changing the query length requires you to restart the instance. For Cloud SQL Enterprise edition, you can specify a value in bytes from
256to4500. The default query length is1024bytes. For Cloud SQL Enterprise Plus edition, you can specify a limit in bytes from256to20480. The default value is10240bytes (10 KB).--insights-config-query-plans-per-minuteBy default, a maximum of 5 executed query plan samples are captured per minute across all databases on the instance. Increasing the sampling rate is likely to give you more data points but might add a performance overhead. To disable sampling, set this value to
0. For Cloud SQL Enterprise edition, you can change the value from 0 to 20. For Cloud SQL Enterprise Plus edition, you can increase the maximum up to 200 to provide more data points.
Replace the following:
- INSIGHTS_CONFIG_QUERY_STRING_LENGTH: The query string length to be stored, in bytes.
- API_TIER_STRING: The custom instance configuration to use for the instance.
- REGION: The region for the instance.
gcloud sql instances patch INSTANCE_ID \
--insights-config-query-insights-enabled \
--insights-config-query-string-length=INSIGHTS_CONFIG_QUERY_STRING_LENGTH \
--insights-config-query-plans-per-minute=QUERY_PLANS_PER_MINUTE \
--tier=API_TIER_STRING \
--region=REGION
REST v1
To enable query insights for a Cloud SQL instance by using the
REST API, call the instances.patch
method with insightsConfig settings.
If you enable query insights for a Cloud SQL Enterprise Plus edition instance, then you enable index advisor recommendations automatically.
Before using any of the request data, make the following replacements:
- PROJECT_ID: the project ID
- INSTANCE_ID: the instance ID
HTTP method and URL:
PATCH https://sqladmin.googleapis.com/v1/projects/PROJECT_ID/instances/INSTANCE_ID
Request JSON body:
{
  "settings" : {
     "insightsConfig" : {
       "queryInsightsEnabled" : true,
       "queryStringLength" : 1024,
       "queryPlansPerMinute" : 20,
   }
  }
}
To send your request, expand one of these options:
You should receive a JSON response similar to the following:
{
  "kind": "sql#operation",
  "targetLink": "https://sqladmin.googleapis.com/v1/projects/PROJECT_ID/instances/INSTANCE_ID",
  "status": "PENDING",
  "user": "user@example.com",
  "insertTime": "2025-03-28T22:43:40.009Z",
  "operationType": "UPDATE",
  "name": "OPERATION_ID",
  "targetId": "INSTANCE_ID",
  "selfLink": "https://sqladmin.googleapis.com/v1/projects/PROJECT_ID/operations/OPERATION_ID",
  "targetProject": "PROJECT_ID"
}
Terraform
To use Terraform to enable query insights for a Cloud SQL instance,
set the query_insights_enabled flag to true.
If you enable query insights for a Cloud SQL Enterprise Plus edition instance, then you enable index advisor recommendations automatically.
Also, you can use one or more of the following optional flags:
query_string_length: for Cloud SQL Enterprise edition, you can specify a value in bytes from256to4500. The default query length is1024bytes. For Cloud SQL Enterprise Plus edition, you can specify a limit in bytes from256to20480. The default value is10240bytes (10 KB).-
query_plans_per_minute: for Cloud SQL Enterprise edition, you can set the value from0to20. The default is5. For Cloud SQL Enterprise Plus edition, you can increase the maximum up to200to provide more data points.
Here's an example:
To apply your Terraform configuration in a Google Cloud project, complete the steps in the following sections.
Prepare Cloud Shell
- Launch Cloud Shell.
-
Set the default Google Cloud project where you want to apply your Terraform configurations.
You only need to run this command once per project, and you can run it in any directory.
export GOOGLE_CLOUD_PROJECT=PROJECT_ID
Environment variables are overridden if you set explicit values in the Terraform configuration file.
Prepare the directory
Each Terraform configuration file must have its own directory (also called a root module).
-
In Cloud Shell, create a directory and a new
file within that directory. The filename must have the
.tfextension—for examplemain.tf. In this tutorial, the file is referred to asmain.tf.mkdir DIRECTORY && cd DIRECTORY && touch main.tf
-
If you are following a tutorial, you can copy the sample code in each section or step.
Copy the sample code into the newly created
main.tf.Optionally, copy the code from GitHub. This is recommended when the Terraform snippet is part of an end-to-end solution.
- Review and modify the sample parameters to apply to your environment.
- Save your changes.
-
Initialize Terraform. You only need to do this once per directory.
terraform init
Optionally, to use the latest Google provider version, include the
-upgradeoption:terraform init -upgrade
Apply the changes
-
Review the configuration and verify that the resources that Terraform is going to create or
update match your expectations:
terraform plan
Make corrections to the configuration as necessary.
-
Apply the Terraform configuration by running the following command and entering
yesat the prompt:terraform apply
Wait until Terraform displays the "Apply complete!" message.
- Open your Google Cloud project to view the results. In the Google Cloud console, navigate to your resources in the UI to make sure that Terraform has created or updated them.
Metrics are expected to be available in query insights within minutes of query completion.
View the Query insights dashboard
The Query insights dashboard shows the query load based on factors that you select. Query load is a measurement of the total work for all the queries in the instance in the selected time range. The dashboard provides a series of filters that help you view query load.
To open the Query insights dashboard, follow these steps:
- To open the Overview page of an instance, click the instance name.
- In the Cloud SQL navigation menu, click Query insights, or click Go to Query insights for more in-depth info on queries and performance on the Instance overview page.
The Query insights dashboard opens. Depending on whether you're using query insights for Cloud SQL Enterprise edition or query insights for Cloud SQL Enterprise Plus edition, the Query insights dashboard shows the following information about your instance:
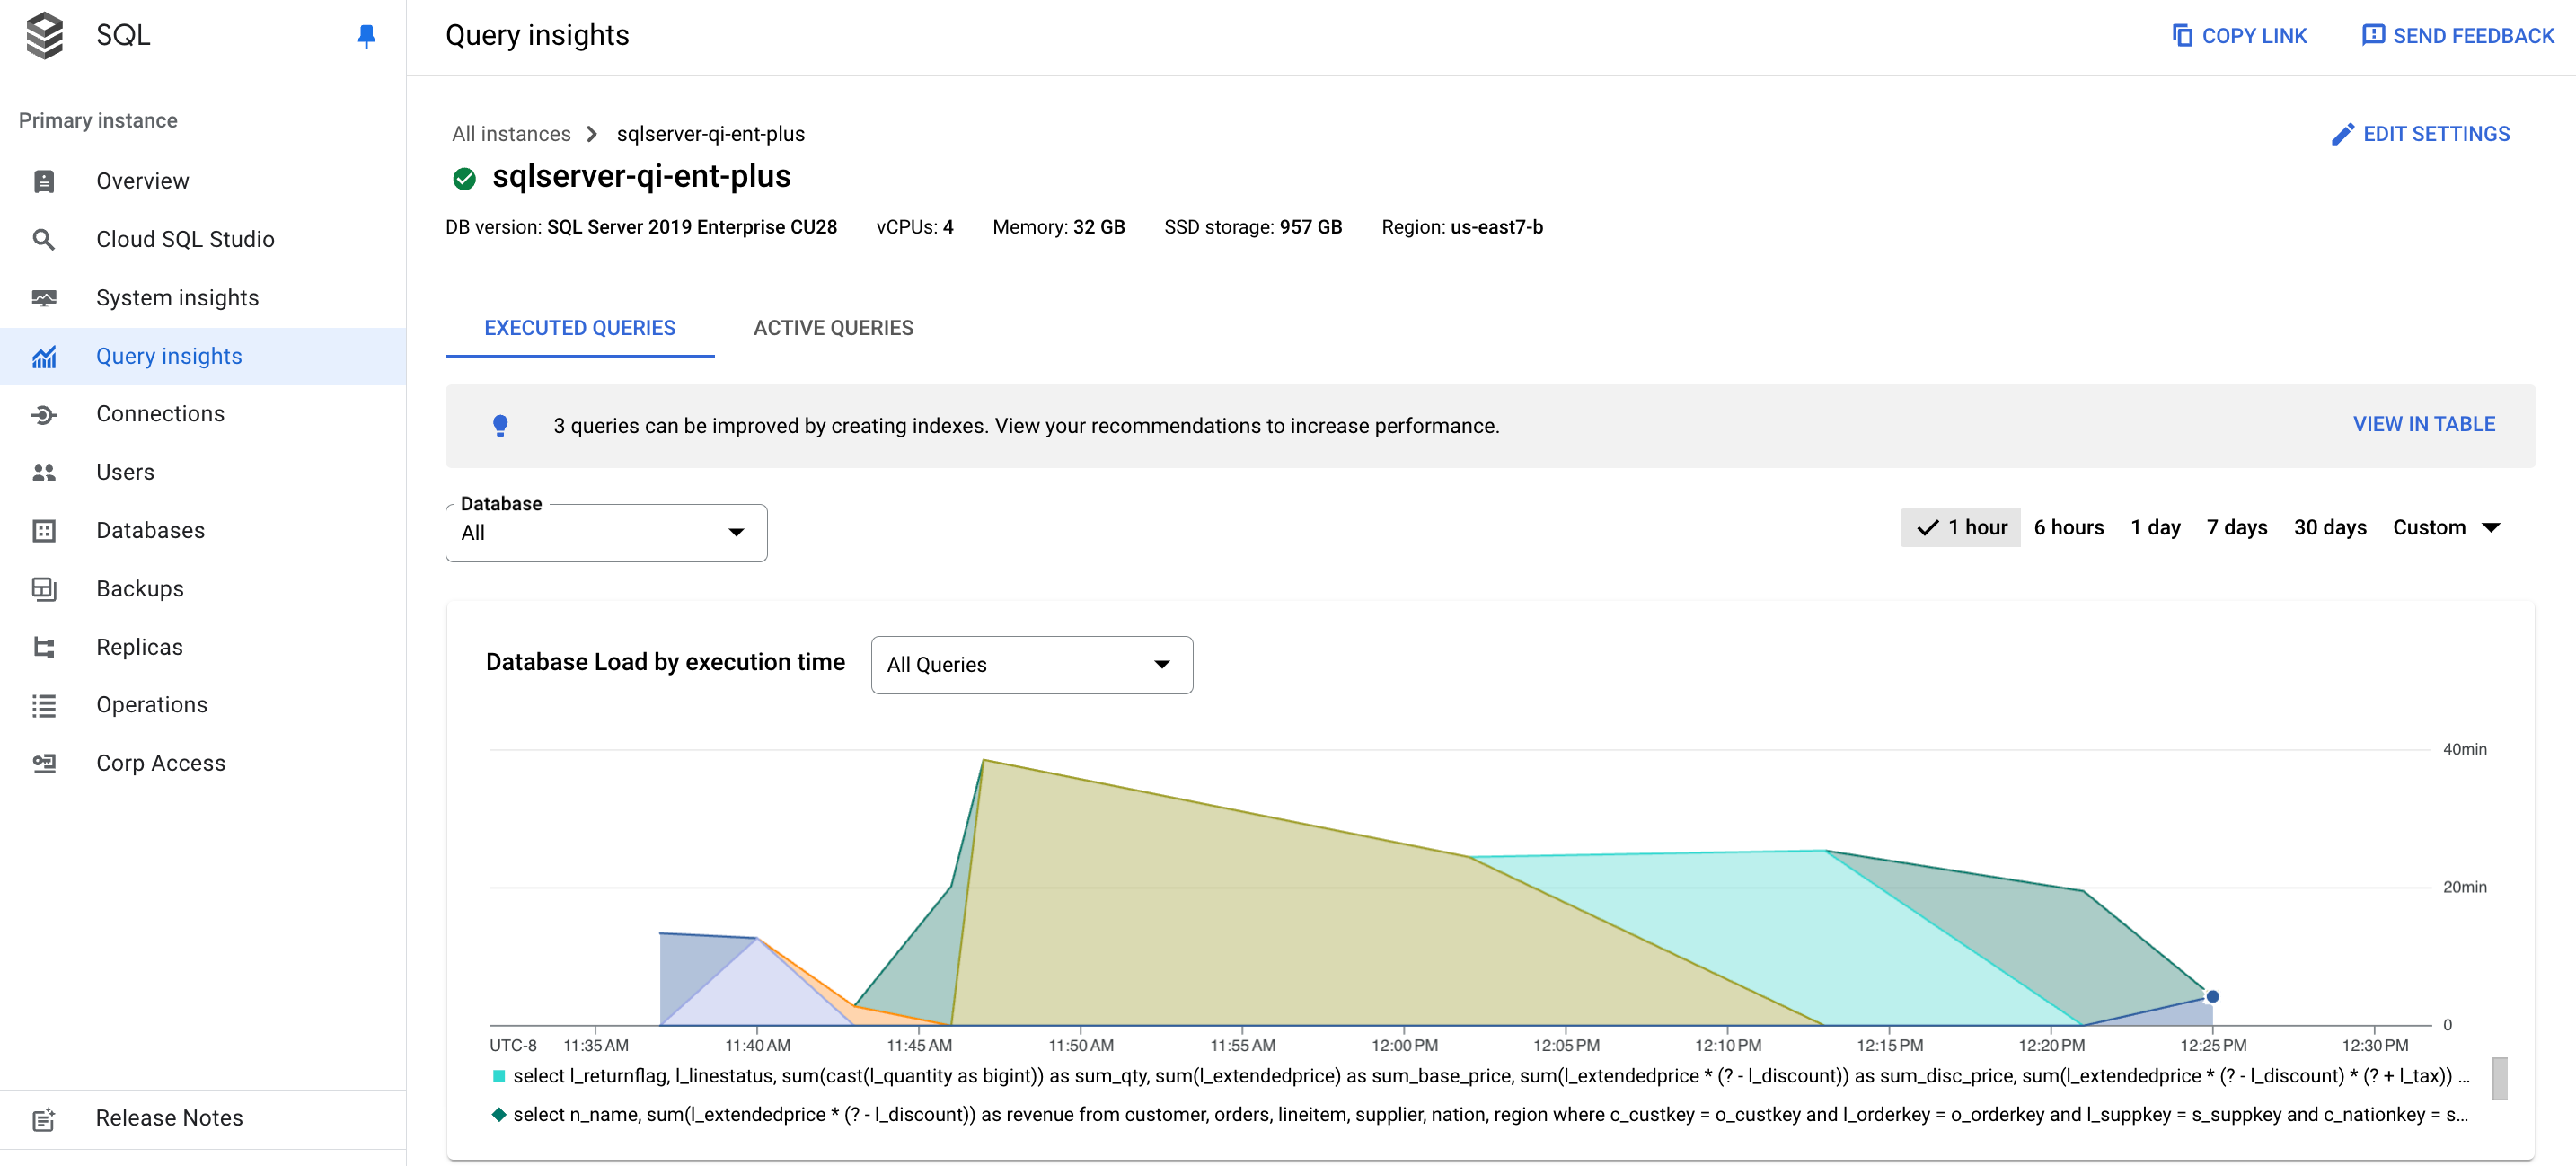
- Databases: Filters query load on a specific database or all databases.
- Time range: Filters query load by time ranges, such as 1 hour, 6 hours, 1 day, 7 days, 30 days, or a custom range.
- Database load graph: Displays the query load graph, based on filtered data.
- Queries and Databases: Filters query load by either a selected query or a selected database. See Filter the database load.
View the database load for all queries
Database query load is a measure of the work (in CPU seconds) that the executed queries in your selected database perform over time. Each running query is either using or waiting for CPU resources, IO resources, or lock resources. Database query load is the ratio of the amount of time taken by all the queries that are completed in a given time window to the wall-clock time.
The top-level query insights dashboard shows the Database load by execution time graph. Drop-down menus on the dashboard let you filter the graph for all databases or a specific database.
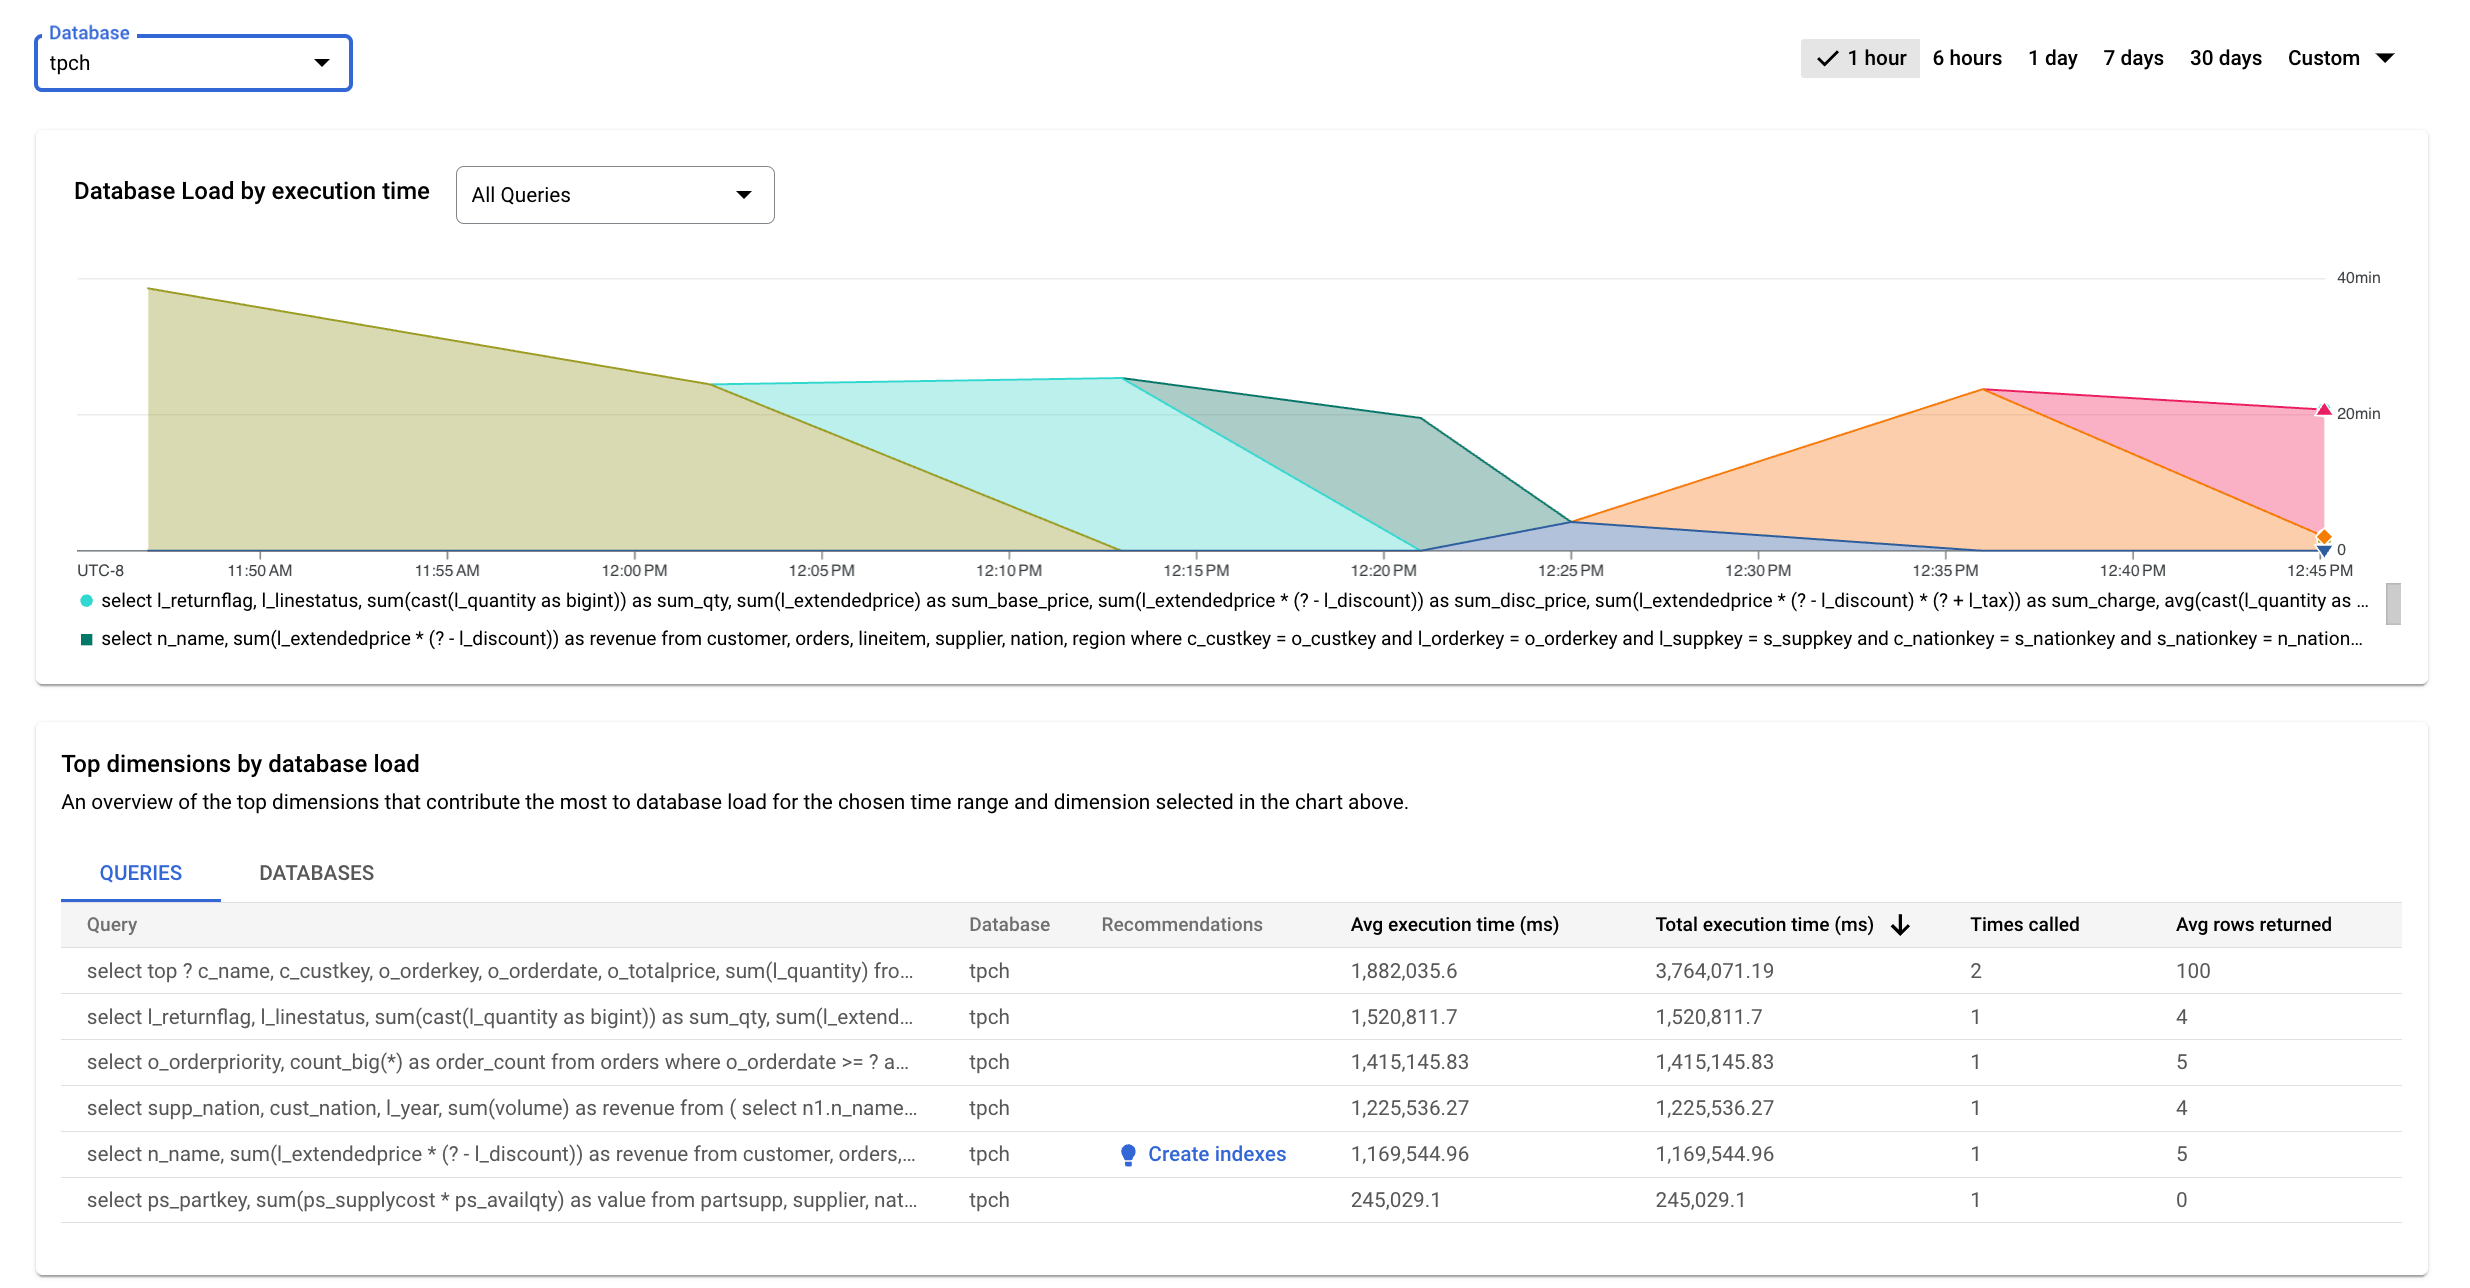
Colored lines in the graph show per database load by execution time. Review the graph and use the filtering options to explore these questions:
- Is the query load high? Is the graph spiking or elevated over time? If you don't see a high load, then the problem isn't with your query.
- How long has the load been high? Is it high only now or has it been high for a long time? Use the range selector to select various time periods to find out how long the problem has lasted. Zoom in to view a time window where query load spikes are observed. Zoom out to view up to one week of the timeline.
- Which database is experiencing the load? Select different databases from the Databases drop-down menu to find the databases with the highest loads.
Filter the database load
You can filter the database load by queries. You can customize the database load chart to break down the displayed data using any of the following dimensions:All queries
Databases
To customize the database load chart, select a dimension from the Database Load by execution time drop-down.
View the top contributors to database load
To view the top contributors to the database load, you can use the Top dimensions by database load table. The Top dimensions by database load table displays the top contributors for the time period and dimension that you select in the Database Load by execution time chart drop-down. You can modify the time period or dimension to view the top contributors for a different dimension or time period.
In the Top dimensions by data load table, you can select the following tabs.
| Tab | Description |
|---|---|
| Queries | The table displays the top normalized queries by total execution time.
For each query, the data shown in columns are listed as follows:
|
| Databases | The table shows the list of top databases that contributed to the
load during the chosen time period across all executed queries.
|
Filter by queries
The Top dimensions by database load table provides an overview of the queries that cause the most query load. The table shows all the normalized queries for the time range and options selected on the Query insights dashboard. It sorts queries by the total execution time during the time range that you selected.
To sort the table, select a column heading.
The table shows the following properties:
- Query: the normalized query string. By default, query insights shows only 1024 characters in the query string.
- Database: the database against which the query was run.
- Recommendations: the suggested recommendations, such as Create indexes, to improve query performance.
- Avg execution time (ms): the average time for the query to execute.
- Total execution time (ms): the total time for the query to execute.
- Times called: the number of times the application called the query.
- Avg rows returned: the average number of rows returned for the query.
Query insights stores and displays only normalized queries.
Examine operations in a sampled query plan
A query plan takes a sample of your query and breaks it down into individual operations. It explains and analyzes each operation in the query.
The Query plan samples graph shows all the query plans running at particular times and the amount of time each plan took to run. You can change the rate at which query plan samples are captured per minute. See Enable Query Insights.
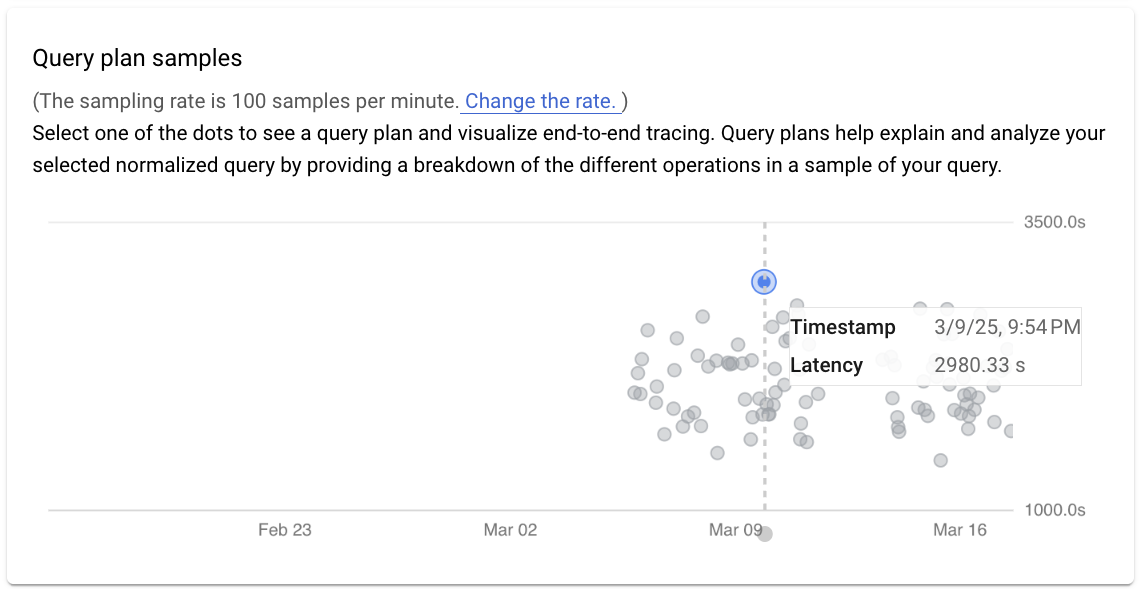
By default, the panel on the right shows the details for the sample query plan that takes the longest time, as visible on the Query plan samples graph. To see the details for another sample query plan, click the relevant circle on the graph. Expanded details show a model of all the operations in the query plan.
Each operation shows the rows returned and, if available, the cost of the
operation. Use the full screen view or the
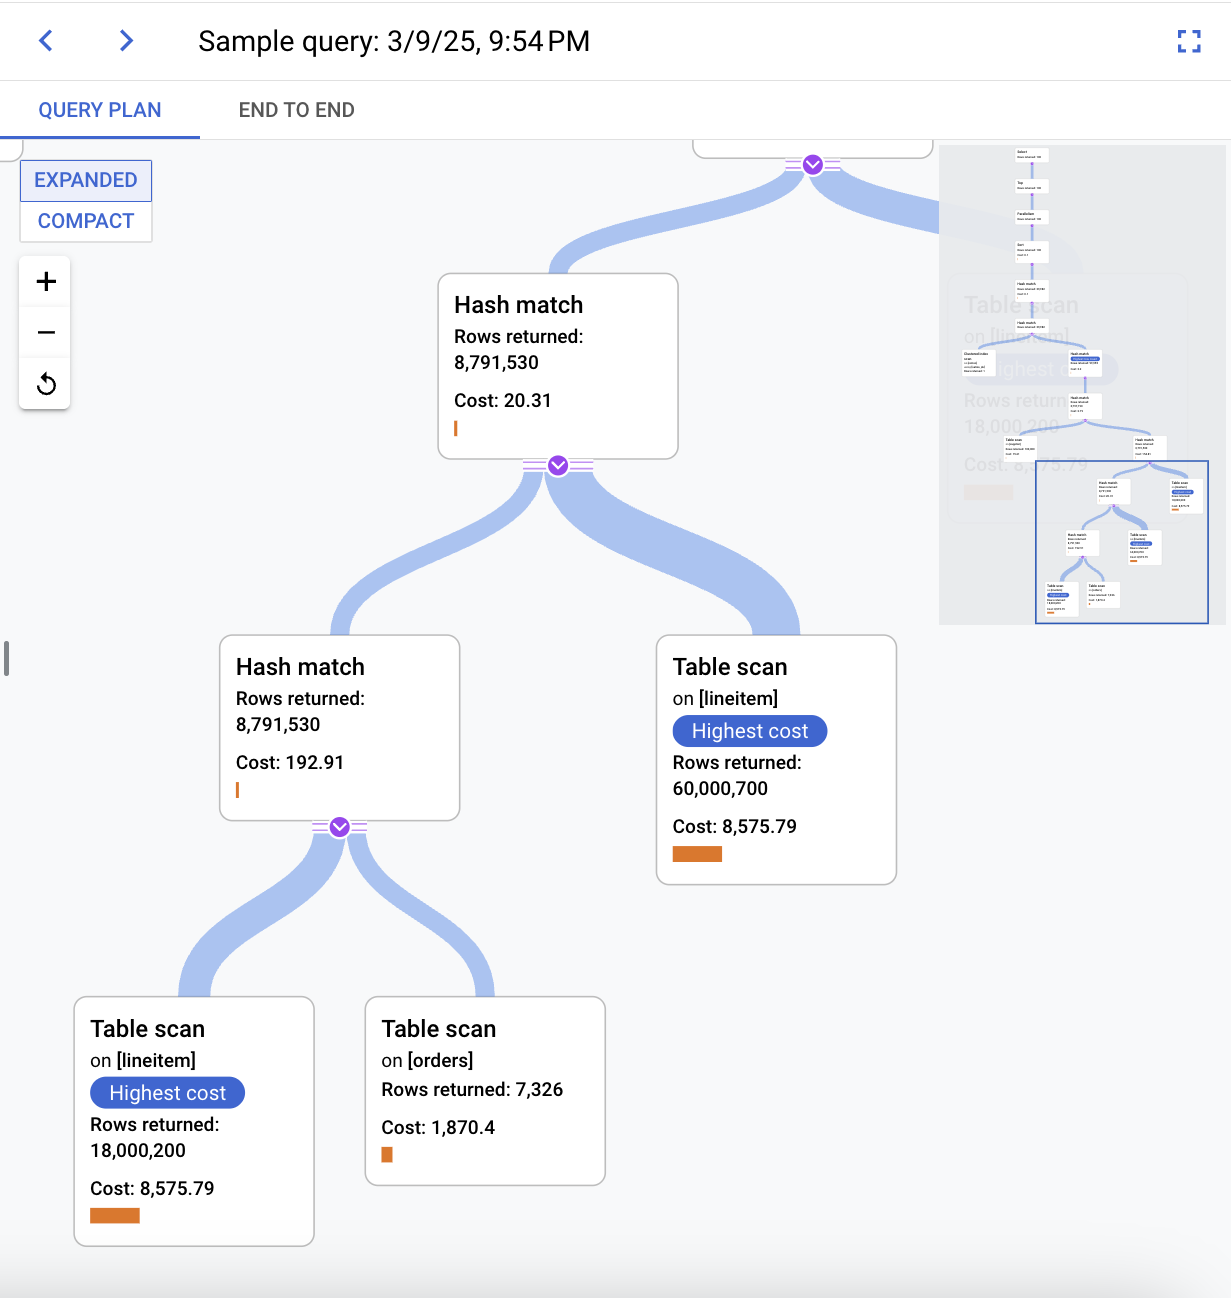
Try to narrow down the problem by looking into the following questions:
- What's the resource consumption?
- How does it relate to other queries?
- Does consumption change over time?
Query details feature
Query details can provide further details about a specific query, including average execution time, the number of times called, and the average number of rows returned. It can also offer recommendations, such as indexes, to help improve query performance.
Query details also provide the following metrics:
- Query plan samples: These samples help explain and analyze your
query by providing a breakdown of the different operations in a sample of the
query.
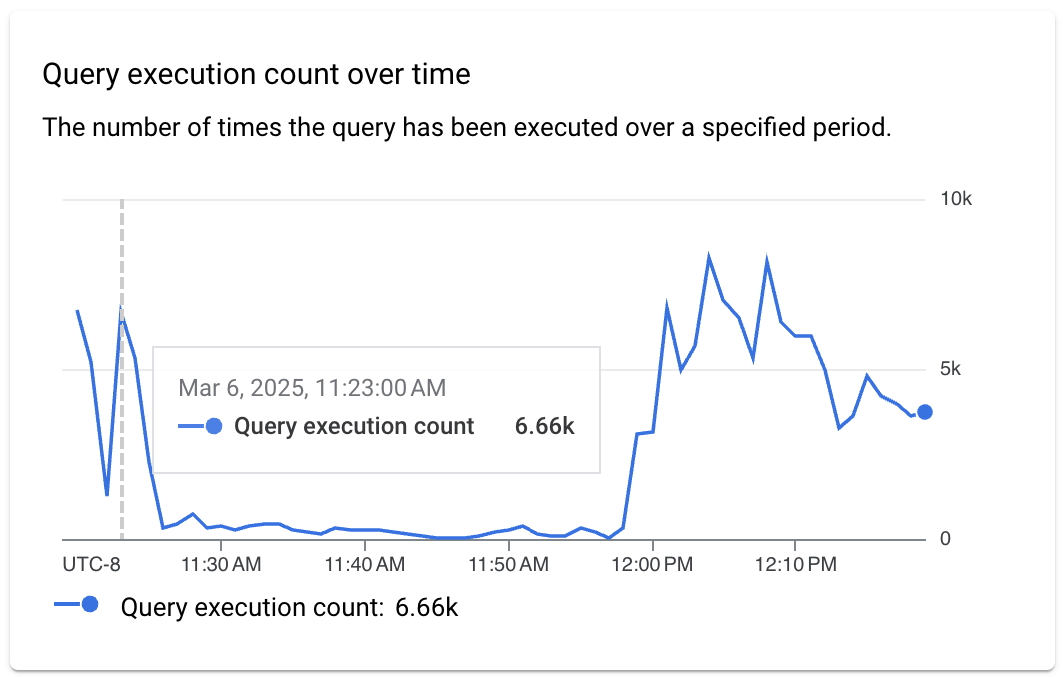
- Query execution count over time: Shows the number of times the query
has completed over a specified period. The chart helps you better understand
when a query is usually executed and can help you estimate the impact of the
query on instance performance.
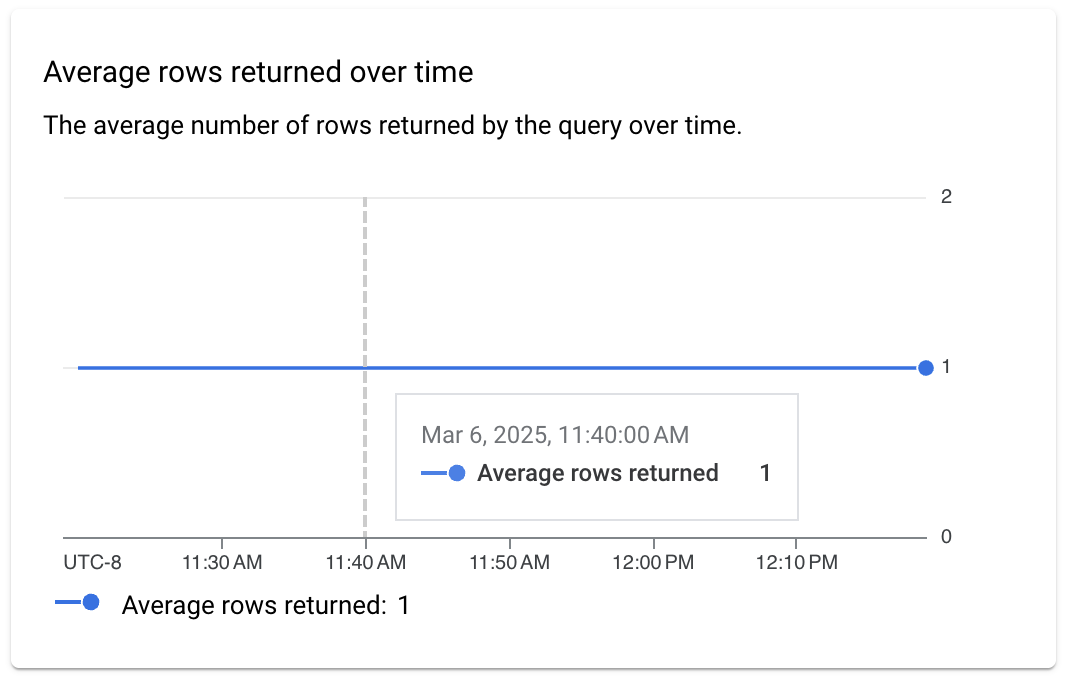
- Average rows returned over time: Shows the average number of rows
returned by the query over time. This data can help you correlate slower than
usual queries with an increased amount of data returned by those queries.
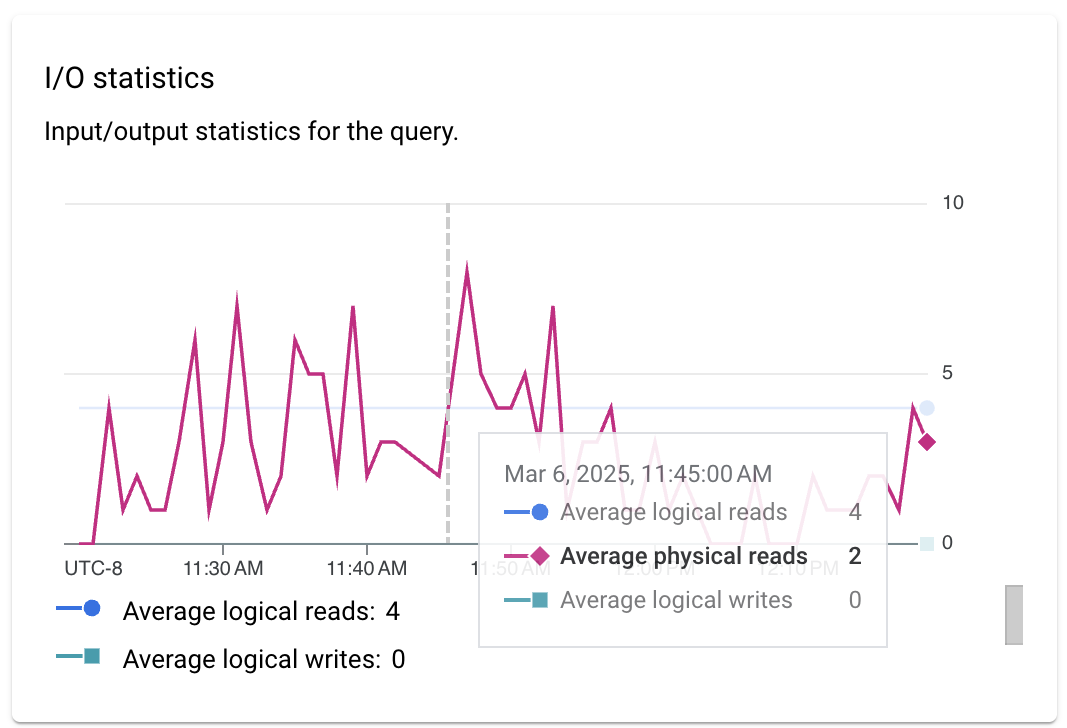
- I/O statistics: Shows the input and output statistics for the query,
including the following filters:
- Average logical reads
- Average physical reads
- Average logical writes
You can use I/O metrics to help you correlate slower than usual queries with more intensive I/O usage or changes in I/O patterns.
For example, if the number of logical reads increased, then that could be an indication that the query started reading more data than usual. If the number of physical reads increased, then that could indicate that Cloud SQL started reading more data from disk rather than from the buffer cache. For example, perhaps there wasn't enough memory to cache all data or the instance started reading too much data. If the number of logical writes increased, then that could indicate that the query started writing more data to the data disk.
This is one example of how this metric could help measure the impact of the query on instance I/O.
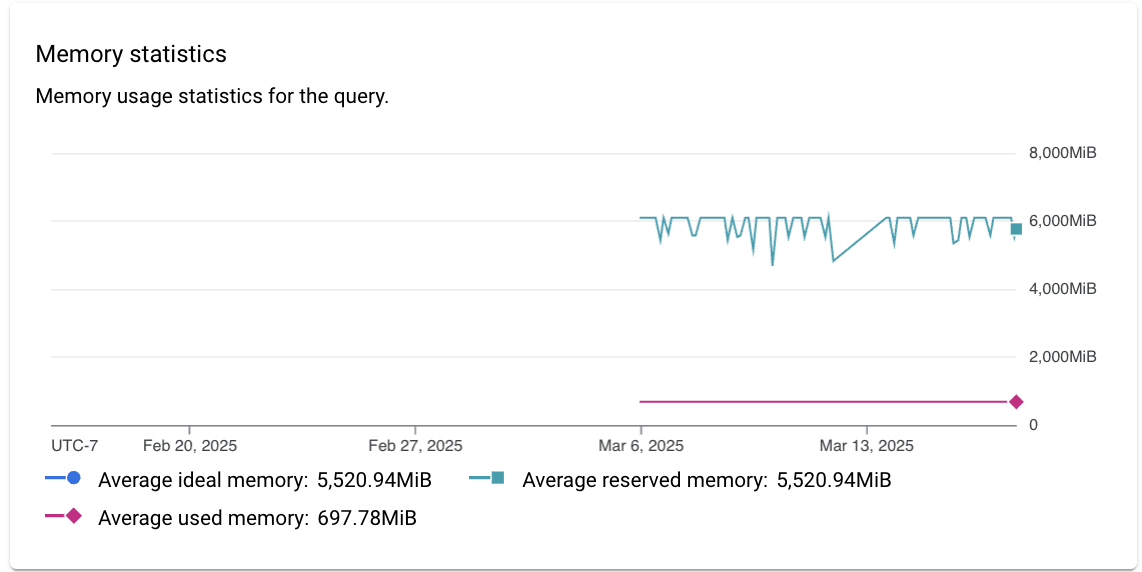
- Memory statistics: Shows the memory usage statistics for the query,
including the following filters:
- Average ideal memory
- Average reserved memory
- Average used memory
This metric can help you detect changes in memory consumption related to the query, including the following examples:
- Use this metric to detect when Cloud SQL mispredicted the amount of memory required for executing the query and might have reserved more memory than used by the query.
- Use this metric to detect when Cloud SQL couldn't
allocate enough memory and reserved a smaller memory grant. When this happens,
Cloud SQL uses the
tempdbdatabase, which is slower than using memory. - Use the metric together with the number of query executions to measure impact of the query on memory consumption of the instance.
- Use the metric when you see high memory usage or memory pressure.
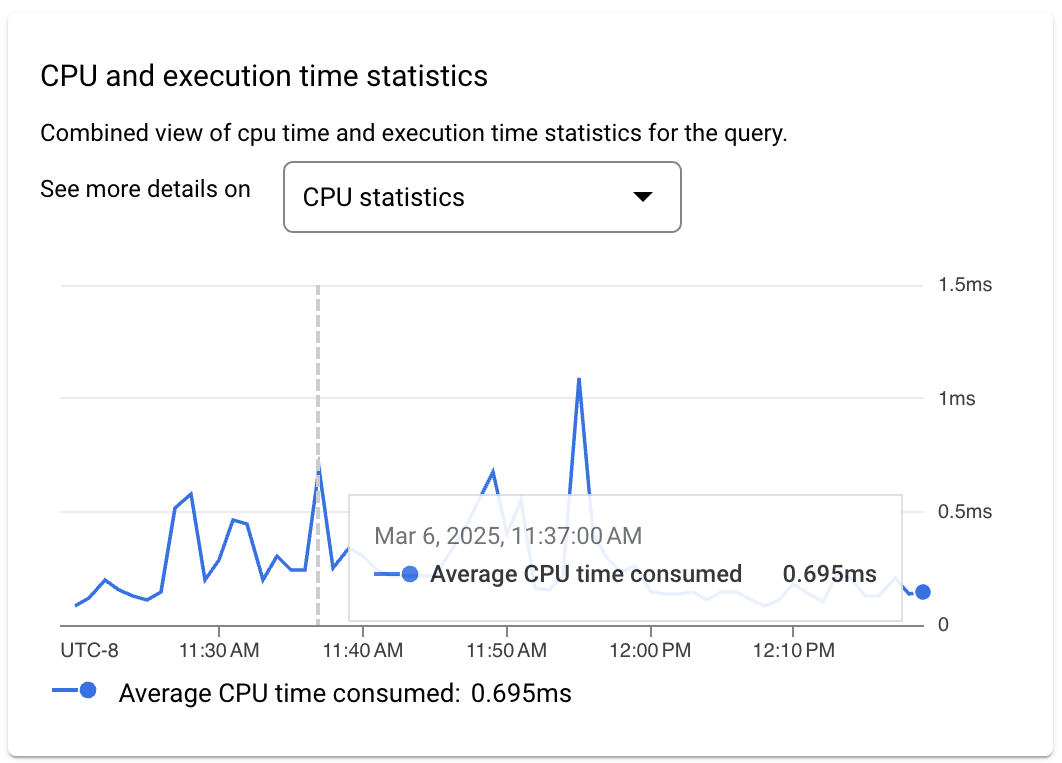
- CPU and execution time statistics: Shows a combined view of CPU
time and execution time statistics for the query. You can use the CPU time
metric to investigate high CPU usage on the instance, including the following
examples:
- You can use a combination of CPU time and execution count metrics to measure the impact of the query on total CPU consumption in the instance.
- You can use a combination of CPU time, execution time, and parallelism metrics to measure the percentage of time the query was waiting for resources.
- You can use the execution time metric to detect when a query took more time to execute than usual.
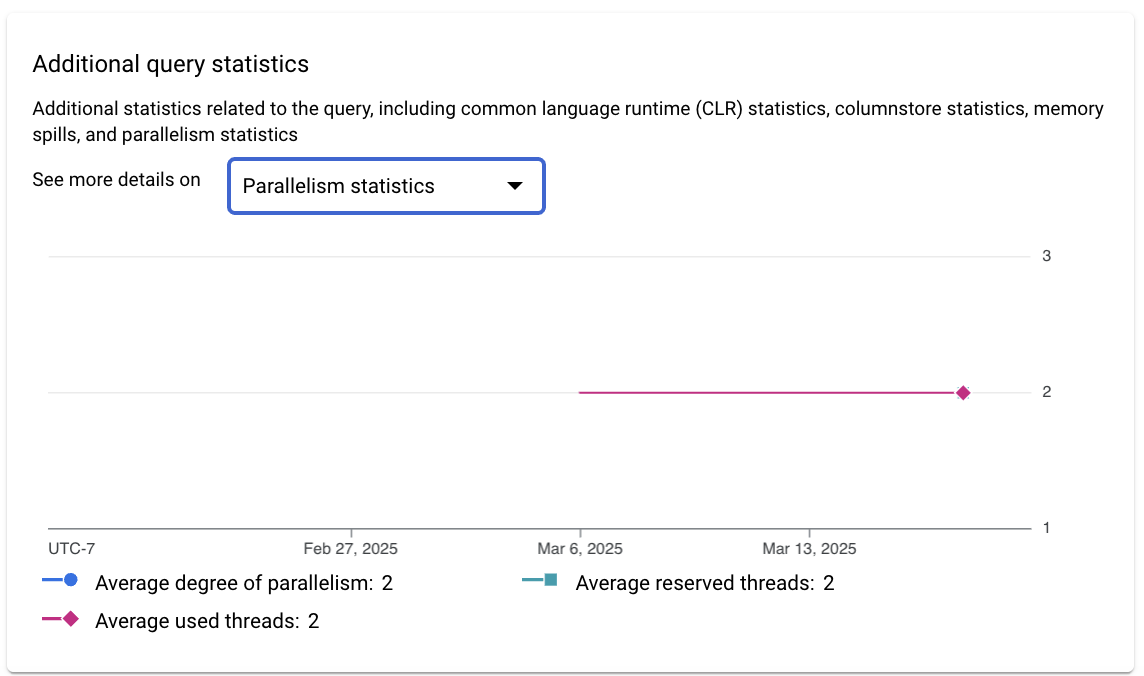
- Additional query statistics: Shows additional statistics related to
the query, including the following filters:
- Common language runtime (CLR) statistics
- Columnstore statistics
- Memory spills
- Parallelism statistics
Disable query insights
Console
To disable query insights for a Cloud SQL instance by using the Google Cloud console, follow these steps:
-
In the Google Cloud console, go to the Cloud SQL Instances page.
- To open the Overview page of an instance, click the instance name.
- On the Configuration tile, click Edit configuration.
- In the Configuration options section, expand Query insights.
- Clear the Enable Query insights checkbox.
- Click Save.
gcloud
To disable query insights for a Cloud SQL instance by using gcloud,
run gcloud sql instances patch
with the --no-insights-config-query-insights-enabled flag as
follows, after replacing INSTANCE_ID with the ID of the instance.
gcloud sql instances patch INSTANCE_ID \
  --no-insights-config-query-insights-enabled
REST
To disable query insights for a Cloud SQL instance by using the
REST API, call the instances.patch
method with queryInsightsEnabled set to false as follows.
Before using any of the request data, make the following replacements:
- project-id: The project ID.
- instance-id: The instance ID.
HTTP method and URL:
PATCH https://sqladmin.googleapis.com/sql/v1beta4/projects/project-id/instances/instance-id
Request JSON body:
{
  "settings" : { "insightsConfig" : { "queryInsightsEnabled" : false } }
}
To send your request, expand one of these options:
You should receive a JSON response similar to the following:
{
  "kind": "sql#operation",
  "targetLink": "https://sqladmin.googleapis.com/sql/v1beta4/projects/project-id/instances/instance-id",
  "status": "PENDING",
  "user": "user@example.com",
  "insertTime": "2021-01-28T22:43:40.009Z",
  "operationType": "UPDATE",
  "name": "operation-id",
  "targetId": "instance-id",
  "selfLink": "https://sqladmin.googleapis.com/sql/v1beta4/projects/project-id/operations/operation-id",
  "targetProject": "project-id"
}
Disable query insights for Cloud SQL Enterprise Plus edition
To disable query insights for Cloud SQL Enterprise Plus edition, do the following:
-
In the Google Cloud console, go to the Cloud SQL Instances page.
- To open the Overview page of an instance, click the instance name.
- Click Edit.
- In the Customize your instance section, expand Query insights.
- Clear the Enable Enterprise Plus features checkbox.
- Click Save.
What's next
- Launch blog: Solve database bottlenecks faster with the latest query insights for Cloud SQL Enterprise Plus edition
- Blog: Boost your query performance troubleshooting skills with Cloud SQL Insights
- Video: Introducing Cloud SQL Insights
- Podcast: Cloud SQL Insights
- Insights Codelab
- Optimize high CPU usage
- Optimize high memory usage