Mantenha tudo organizado com as coleções
Salve e categorize o conteúdo com base nas suas preferências.
Gráficos de chama
O Cloud Profiler exibe dados de criação de perfil usando Gráficos de chama. Ao contrário de árvores e gráficos, os gráficos de chama fazem uso eficiente do espaço da tela, representando uma grande quantidade de informações em um formato compacto e legível.
Para introduzir gráficos de chama, esta página ilustra como converter uma árvore em um gráfico de chama e resume os principais recursos dos gráficos de chama.
Como criar um gráfico de chama
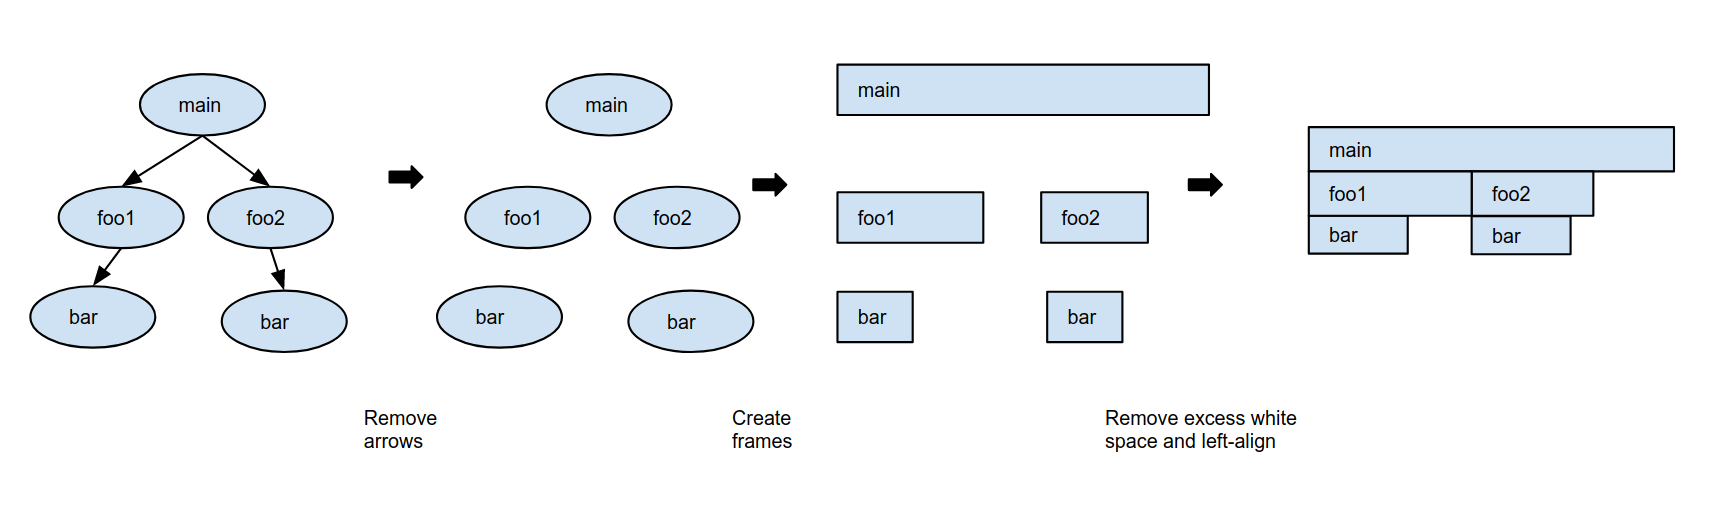
Para criar um gráfico de chama a partir de uma árvore, conclua as etapas ilustradas neste diagrama:
Remova da árvore as setas que indicam chamadas de função.
Substitua cada nó da árvore por um frame.
Os frames são retangulares e têm todos a mesma altura.
Para o exemplo desta página, o tempo de CPU total usado pela função nomeada no frame determina a largura do frame.
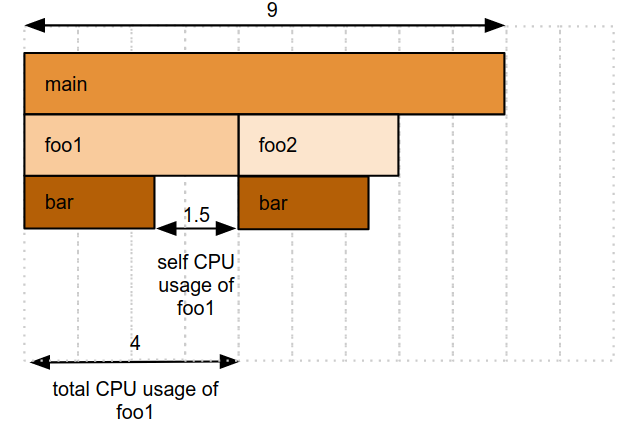
O pseudocódigo para cada uma das funções é descrito na tabela a seguir. O trabalho intensivo da CPU realizado durante a execução de uma função define o tempo de CPU próprio:
Pseudocódigo da função
Tempo de CPU próprio (segundos)
Tempo de CPU total (segundos)
func main():
     foo1()
     foo2()
     // CPU intensive work
     // for 2 seconds
2
4 + 3 + 2 = 9
func foo1():
     bar()
     // CPU intensive work
     // for 1.5 seconds
1,5
2,5 + 1,5 = 4
func foo2():
     bar()
     // CPU intensive work
     // for 0.5 seconds
0,5
2,5 + 0,5 = 3
func bar():
     // CPU intensive work
     // for 2.5 seconds
2,5
2,5
A próxima etapa é remover o espaço vertical entre os frames e alinhar os frames à esquerda, preservando as sequências de chamada.
Como opção, você pode estabelecer um esquema de cores e a cor dos frames de acordo com a definição. Por exemplo, é possível atribuir cores aos frames pelo pacote, pelo tempo de CPU total, pelo tempo de CPU próprio ou por uma medida diferente.
Depois de remover o excesso de espaços em branco e definir as cores dos frames conforme o tempo de CPU próprio, o gráfico de chama ficará assim:
Observe que as pilhas de chamadas para foo1 e foo2 foram preservadas, mesmo que a pilha de chamadas que começa com foo2 esteja agora ao lado do frame para foo1.
Resumo
Este exemplo simples ilustra o seguinte:
Os gráficos de chama são uma representação compacta de uma árvore, e você pode recriar uma pilha de chamadas traçando frames de cima para baixo.
Os frames nomeiam uma função, e a largura do frame é a medida relativa do tempo de CPU total dessa função.
Neste exemplo, como o tempo de CPU total de foo2 é um terço do tempo de CPU total de main, o frame para foo2 é um terço da largura do frame para main.
A largura do espaço vazio abaixo de um frame é a medida relativa do tempo de CPU próprio para a função nomeada no frame.
Por exemplo, abaixo do frame foo1, 1,5 unidades estão vazias, e 2,5 unidades são ocupadas por bar. Portanto, o tempo de CPU próprio de foo1 é 37,5% do tempo de CPU total, ou 1,5 s.
À medida que você segue uma pilha de chamadas, as larguras dos frames diminuem porque o tempo de CPU total de um recebedor da chamada não pode ser maior que o tempo de CPU total do autor da chamada. É esse comportamento que causa a forma de chama.
No exemplo, foo1 chama bar, e o tempo de CPU total de foo1 é definido como o tempo de CPU total de barmais o tempo de CPU próprio de foo1. Portanto, o tempo de CPU total de bar não pode ser maior que o tempo de CPU total de foo1.
[[["Fácil de entender","easyToUnderstand","thumb-up"],["Meu problema foi resolvido","solvedMyProblem","thumb-up"],["Outro","otherUp","thumb-up"]],[["Difícil de entender","hardToUnderstand","thumb-down"],["Informações incorretas ou exemplo de código","incorrectInformationOrSampleCode","thumb-down"],["Não contém as informações/amostras de que eu preciso","missingTheInformationSamplesINeed","thumb-down"],["Problema na tradução","translationIssue","thumb-down"],["Outro","otherDown","thumb-down"]],["Última atualização 2025-09-04 UTC."],[],[],null,["# Flame graphs\n============\n\nCloud Profiler displays profiling data by using\n[Flame Graphs](http://www.brendangregg.com/flamegraphs.html). Unlike trees and graphs,\nflame graphs make efficient use of screen space by representing a large amount\nof information in a compact and readable format.\n\nTo introduce flame graphs, this page illustrates how to convert a tree\ninto a flame graph and summarizes key features of flame graphs.\n\nCreating a flame graph\n----------------------\n\nTo create a flame graph from a tree, complete the steps illustrated in the\nfollowing diagram:\n\n1. Remove from the tree the arrows that indicate function calls.\n\n2. Replace each tree node with a *frame*.\n\n Frames are rectangular in shape and all frames have the same height.\n For the example on this page, the total CPU time used by the function named\n in the frame determines the frame width.\n | **Key Point:** In profiling, a functions' *total CPU time* is the CPU time used by the function including the CPU time used by all functions it calls. A function's *self CPU time* is the CPU time used by a function excluding the CPU time used by the functions it calls.\n\n The pseudo code for each of the functions is described in the following\n table. The CPU intensive work performed during a function's execution\n defines the self CPU time:\n\n \u003cbr /\u003e\n\n3. The next step is to remove the *vertical* space between the frames\n and left align frames while preserving call sequences.\n Optionally, you can define a color scheme and color the frames according\n to the definition. For example, you can color frames by their package,\n by total CPU time, by self CPU time, or by a different measure.\n\n After removing excess whitespace and coloring frames by the self\n CPU time, the flame graph now appears as follows:\n\n Notice that the call stacks for `foo1` and `foo2`\n have been preserved, even though the call stack starting with `foo2` is\n now next to the frame for `foo1`.\n\nSummary\n-------\n\nThis simple example illustrates the following:\n\n- Flame graphs are a compact representation of a tree and you can recreate a call stack by tracing frames from the top downwards.\n- Frames name a function and the frame width is the relative measure of that function's total CPU time. In this example, because the total CPU time of `foo2` is one third of the total CPU time of `main`, the frame for `foo2` is one third the width of the frame for `main`.\n- The width of the empty space below a frame is the relative measure of the self CPU time for the function named in the frame. For example, below the frame `foo1`, 1.5 units are empty and 2.5 units are occupied by `bar`. Therefore the self CPU time of `foo1` is 37.5% of its total CPU time, or 1.5 s.\n- As you follow a call stack, the widths of the frames decrease because the\n total CPU time of a callee can never be more than the total CPU time\n of the caller. This behavior is what causes the flame shape.\n\n In the example, `foo1` calls `bar` and the total CPU time of `foo1`\n is defined to be the total CPU time of `bar` *plus* the self CPU time of\n `foo1`. Therefore, the total CPU time of `bar` cannot be more than the\n total CPU time of `foo1`.\n\nWhat's next\n-----------\n\n- [Select the profiles to analyze](/profiler/docs/selecting-profiles)\n- [Interact with the flame graph](/profiler/docs/interacting-flame-graph)\n- [Filter the flame graph](/profiler/docs/filtering-profiles)\n- [Focus the flame graph](/profiler/docs/focusing-profiles)\n- [Compare profiles](/profiler/docs/comparing-profiles)"]]