在控制台中查看统计信息
使用集合让一切井井有条
根据您的偏好保存内容并对其进行分类。
本页面介绍了 Datastore 信息中心中显示的统计信息详情。
查看统计信息
在 Datastore 信息中心中查看应用数据的统计信息。
在 Google Cloud 控制台中,前往数据库页面。
前往“数据库”
从数据库列表中选择所需的数据库。
在导航菜单中,点击 Datastore Studio。
统计信息类型
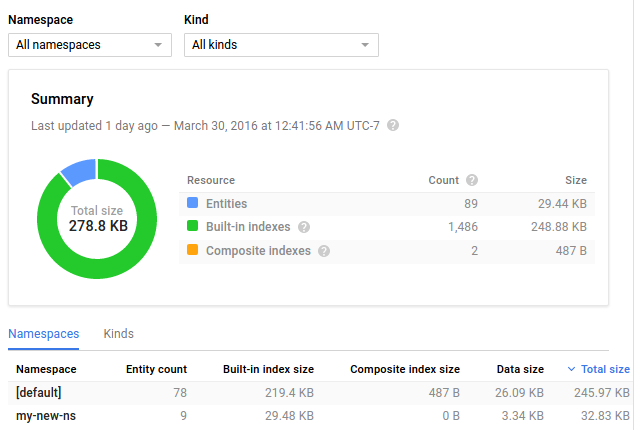
“信息中心”页面以各种方式显示数据:
以饼图显示每种属性类型(如字符串、双精度或 blob 类型)使用的空间。
以饼图显示实体种类使用的空间。
以表格显示每种属性类型使用的总空间。“元数据”属性类型表示在条目内存储属性所占用的空间(而非属性直接使用的空间)。“Datastore 统计信息”实体(如果存在)显示数据库中统计信息数据本身占用的空间。
以表格显示所有实体的总大小、平均大小、条目计数和大小,以及内置索引和复合索引。
默认情况下,所有实体的统计信息均以饼图显示。通过从下拉菜单中进行选择,您可以将饼图限制为特定的实体种类。
统计信息的存储限制
统计信息数据存储在应用的 Datastore 实例中。统计信息数据占用的空间根据应用使用的不同实体种类和属性类型的数量成比例增加。如果使用命名空间,那么每个命名空间都包含该命名空间的统计信息的完整副本。为了使存储和更新统计信息的开销保持在合理范围内,数据库会逐步删除统计信息实体。
如需详细了解统计信息数据以及 Datastore 如何逐步删除统计信息实体,请参阅 Datastore 模式统计信息。
如未另行说明,那么本页面中的内容已根据知识共享署名 4.0 许可获得了许可,并且代码示例已根据 Apache 2.0 许可获得了许可。有关详情,请参阅 Google 开发者网站政策。Java 是 Oracle 和/或其关联公司的注册商标。
最后更新时间 (UTC):2025-09-22。
[[["易于理解","easyToUnderstand","thumb-up"],["解决了我的问题","solvedMyProblem","thumb-up"],["其他","otherUp","thumb-up"]],[["很难理解","hardToUnderstand","thumb-down"],["信息或示例代码不正确","incorrectInformationOrSampleCode","thumb-down"],["没有我需要的信息/示例","missingTheInformationSamplesINeed","thumb-down"],["翻译问题","translationIssue","thumb-down"],["其他","otherDown","thumb-down"]],["最后更新时间 (UTC):2025-09-22。"],[],[]]