이 튜토리얼에서는 BigQuery ML의 기본 제공 TimesFM 단변량 모델과 함께 AI.FORECAST 함수를 사용하여 특정 열의 과거 값을 기반으로 해당 열의 미래 값을 예측하는 방법을 설명합니다.
이 튜토리얼에서는 공개 bigquery-public-data.san_francisco_bikeshare.bikeshare_trips 테이블의 데이터를 사용합니다.
단일 자전거 공유 여행 시계열 예측
AI.FORECAST 함수를 사용하여 미래 시계열 값을 예측합니다.
다음 쿼리는 지난 4개월의 과거 데이터를 기반으로 다음 달 (약 720시간)의 시간당 구독자 자전거 공유 여행 수를 예측합니다. confidence_level 인수는 쿼리가 95% 신뢰 수준의 예측 구간을 생성함을 나타냅니다.
TimesFM 모델로 데이터를 예측하려면 다음 단계를 따르세요.
Google Cloud 콘솔에서 BigQuery 페이지로 이동합니다.
쿼리 편집기에 다음 쿼리를 붙여넣고 실행을 클릭합니다.
SELECT *
FROM
  AI.FORECAST(
    (
      SELECT TIMESTAMP_TRUNC(start_date, HOUR) as trip_hour, COUNT(*) as num_trips
FROM `bigquery-public-data.san_francisco_bikeshare.bikeshare_trips`
WHERE subscriber_type = 'Subscriber' AND start_date >= TIMESTAMP('2018-01-01')
GROUP BY TIMESTAMP_TRUNC(start_date, HOUR)
    ),
    horizon => 720,
    confidence_level => 0.95,
    timestamp_col => 'trip_hour',
    data_col => 'num_trips');
결과는 다음과 유사합니다.
+-------------------------+-------------------+------------------+---------------------------------+---------------------------------+--------------------+
| forecast_timestamp      | forecast_value    | confidence_level | prediction_interval_lower_bound | prediction_interval_upper_bound | ai_forecast_status |
+-------------------------+-------------------+------------------+---------------------------------+---------------------------------+--------------------+
| 2018-05-01 00:00:00 UTC | 26.3045959...     |            0.95  | 21.7088378...                   | 30.9003540...                   |                    |
+-------------------------+-------------------+------------------+---------------------------------+---------------------------------+--------------------+
| 2018-05-01 01:00:00 UTC | 34.0890502...     |            0.95  | 2.47682913...                   | 65.7012714...                   |                    |
+-------------------------+-------------------+------------------+---------------------------------+---------------------------------+--------------------+
| 2018-05-01 02:00:00 UTC | 24.2154693...     |            0.95  | 2.87621605...                   | 45.5547226...                   |                    |
+-------------------------+-------------------+------------------+---------------------------------+---------------------------------+--------------------+
| ...                     | ...               |  ...             | ...                             |  ...                            |                    |
+-------------------------+-------------------+------------------+---------------------------------+---------------------------------+--------------------+
예측된 데이터를 입력 데이터와 비교
AI.FORECAST 함수 출력과 함수 입력 데이터의 하위 집합을 함께 차트로 표시하여 비교합니다.
다음 단계에 따라 함수 출력을 차트로 표시합니다.
Google Cloud 콘솔에서 BigQuery 페이지로 이동합니다.
쿼리 편집기에 다음 쿼리를 붙여넣고 실행을 클릭합니다.
WITH historical AS (
SELECT TIMESTAMP_TRUNC(start_date, HOUR) as trip_hour, COUNT(*) as num_trips
FROM `bigquery-public-data.san_francisco_bikeshare.bikeshare_trips`
WHERE subscriber_type = 'Subscriber' AND start_date >= TIMESTAMP('2018-01-01')
GROUP BY TIMESTAMP_TRUNC(start_date, HOUR)
ORDER BY TIMESTAMP_TRUNC(start_date, HOUR)
)
SELECT *
FROM
(
(SELECT
    trip_hour as date,
    num_trips AS historical_value,
    NULL as forecast_value,
    'historical' as type,
    NULL as prediction_interval_lower_bound,
    NULL as prediction_interval_upper_bound
FROM
    historical
ORDER BY historical.trip_hour DESC
LIMIT 400)
UNION ALL
(SELECT forecast_timestamp AS date,
        NULL as historical_value,
        forecast_value as forecast_value,
        'forecast' as type,
        prediction_interval_lower_bound,
        prediction_interval_upper_bound
FROM
    AI.FORECAST(
    (
    SELECT * FROM historical
    ),
    horizon => 720,
    confidence_level => 0.99,
    timestamp_col => 'trip_hour',
    data_col => 'num_trips')))
ORDER BY date asc;
쿼리 실행이 완료되면 쿼리 결과 창에서 시각화 탭을 클릭합니다. 결과 차트는 다음과 비슷합니다.
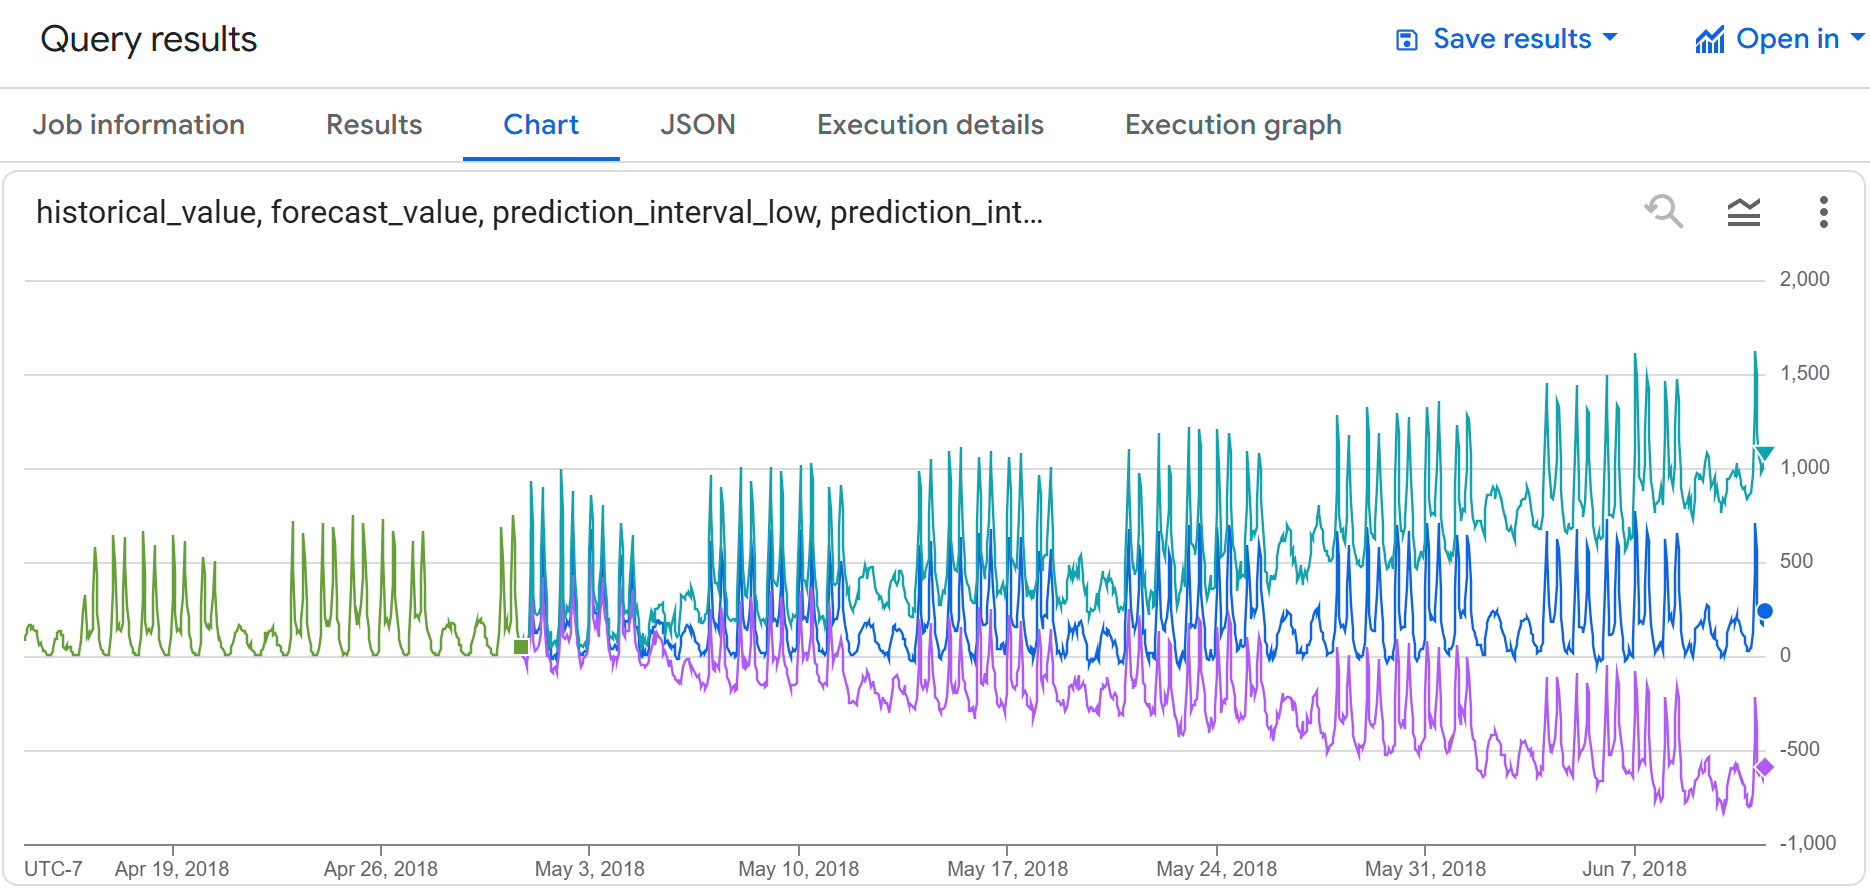
입력 데이터와 예측 데이터의 자전거 공유 사용량이 비슷한 것을 확인할 수 있습니다. 또한 예측된 시점이 미래로 갈수록 예측 구간 하한과 상한이 증가하는 것을 확인할 수 있습니다.
여러 자전거 공유 여행 시계열 예측
다음 쿼리는 지난 4개월의 과거 데이터를 기반으로 다음 달 (약 720시간)의 구독자 유형별, 시간별 자전거 공유 여행 수를 예측합니다. confidence_level 인수는 쿼리가 95% 신뢰 수준의 예측 구간을 생성함을 나타냅니다.
TimesFM 모델로 데이터를 예측하려면 다음 단계를 따르세요.
Google Cloud 콘솔에서 BigQuery 페이지로 이동합니다.
쿼리 편집기에 다음 쿼리를 붙여넣고 실행을 클릭합니다.
SELECT *
FROM
  AI.FORECAST(
    (
      SELECT TIMESTAMP_TRUNC(start_date, HOUR) as trip_hour, subscriber_type, COUNT(*) as num_trips
      FROM `bigquery-public-data.san_francisco_bikeshare.bikeshare_trips`
      WHERE start_date >= TIMESTAMP('2018-01-01')
      GROUP BY TIMESTAMP_TRUNC(start_date, HOUR), subscriber_type
    ),
    horizon => 720,
    confidence_level => 0.95,
    timestamp_col => 'trip_hour',
    data_col => 'num_trips',
    id_cols => ['subscriber_type']);
결과는 다음과 유사합니다.
+---------------------+--------------------------+------------------+------------------+---------------------------------+---------------------------------+--------------------+
| subscriber_type     | forecast_timestamp       | forecast_value   | confidence_level | prediction_interval_lower_bound | prediction_interval_upper_bound | ai_forecast_status |
+---------------------+--------------------------+------------------+------------------+---------------------------------+---------------------------------+--------------------+
| Subscriber          | 2018-05-01 00:00:00 UTC  | 26.3045959...    |            0.95  | 21.7088378...                   | 30.9003540...                   |                    |
+---------------------+--------------------------+------------------+------------------+---------------------------------+---------------------------------+--------------------+
| Subscriber          |  2018-05-01 01:00:00 UTC | 34.0890502...    |            0.95  | 2.47682913...                   | 65.7012714...                   |                    |
+---------------------+-------------------+------------------+-------------------------+---------------------------------+---------------------------------+--------------------+
| Subscriber          |  2018-05-01 02:00:00 UTC | 24.2154693...    |            0.95  | 2.87621605...                   | 45.5547226...                   |                    |
+---------------------+--------------------------+------------------+------------------+---------------------------------+---------------------------------+--------------------+
| ...                 | ...                      |  ...             | ...              | ...                             |  ...                            |                    |
+---------------------+--------------------------+------------------+------------------+---------------------------------+---------------------------------+--------------------+