本页面介绍了适用于 App Engine 应用的日志,以及如何写入、关联和查看日志条目。
App Engine 收集两种类型的日志:
请求日志:发送到应用的请求日志。默认情况下,App Engine 会自动为应用收到的每个 HTTP 请求发出日志条目。
应用日志:App Engine 应用根据您写入受支持的框架或文件的日志条目发出的日志条目。
App Engine 会自动将请求日志和应用日志发送到 Cloud Logging 代理。
写入应用日志
App Engine 会自动针对发送到应用的请求发出日志,因此无需写入请求日志。本部分介绍了如何写入应用日志。
从 App Engine 应用写入应用日志时,只要使用以下方法写入日志,Cloud Logging 便会自动获取这些日志:
与 Cloud Logging 集成
您可以将 App Engine 应用与 Cloud Logging 集成。此方法可让您使用 Cloud Logging 提供的所有功能,只需编写几行特定于 Google 的代码即可。
通过使用标准 Python 日志记录处理程序,或者直接使用 Python 版 Cloud Logging API 客户端库,您可以从 Python 应用向 Cloud Logging 写入日志。在您使用标准 Python 日志记录处理程序时,必须将 Cloud Logging 处理程序附加到 Python 根处理程序。如需了解详情,请参阅设置 Python 版 Cloud Logging。
将结构化日志写入 stdout 和 stderr
默认情况下,App Engine 使用 Cloud Logging 客户端库发送日志。但是,此方法不支持结构化日志记录。您只能使用 stdout/stderr 写入结构化日志。此外,您还可以将文本字符串发送到 stdout 和 stderr。默认情况下,日志载荷是存储在日志条目的 textPayload 字段中的文本字符串。这些字符串在 Logs Explorer、命令行和 Cloud Logging API 中显示为消息,并与发出它们的 App Engine 服务和版本相关联。
如需从日志中获得更多价值,您可以在 Logs Explorer 中按严重级别过滤这些字符串。如需过滤这些字符串,您需要将字符串格式设置为结构化数据。为此,以单行序列化 JSON 的形式写入日志。App Engine 会获取并解析此序列化 JSON 行,然后将其放入日志条目的 jsonPayload 字段(而不是 textPayload)。
以下代码段演示了如何写入此类结构化日志。
在 App Engine 标准环境中,将结构化日志写入 stdout 和 stderr 不计入 Cloud Logging API 的每分钟日志注入请求数配额。
消息中的特殊 JSON 字段
如果您以 JSON 字典形式提供结构化日志,则系统会从 jsonPayload 中删除某些特殊字段,并将这些字段写入所生成 LogEntry 中的相应字段(具体说明请参阅特殊字段文档)。
例如,如果您的 JSON 包含 severity 属性,则系统会将该属性从 jsonPayload 中移除,并将其显示为日志条目的 severity。message 属性用作日志条目的主显示文本(如果存在)。
将请求日志与应用日志相关联
默认情况下,日志在第二代运行时中未进行关联。这些运行时需要使用 Cloud 客户端库。这些库不支持嵌套,并且要求您关联日志。
使用 Python 日志记录模块
如需向 Python 日志记录模块记录的应用日志添加请求相关性,请设置 Cloud Logging 客户端库。
如果您在应用启动时运行 client.setup_logging() 方法,此方法会将 trace 字段和 HTTP 请求详细信息添加到 logging.info() 和logging.error() 等 Python logging 模块写入的应用日志。这些日志将路由到 logs/python。
App Engine 还会将此 trace 字段添加到关联的请求日志中,以便在 Logs Explorer 中查看相关日志条目。
使用 stdout 和 stderr
将条目格式设置为 JSON 对象并提供特定元数据后,您可以过滤和关联请求日志。如需将请求日志条目与应用日志条目相关联,您需要使用请求的跟踪记录标识符。按照说明关联日志消息:
- 从
X-Cloud-Trace-Context请求标头中提取跟踪标识符。 - 在结构化日志条目中,将 ID 写入名为
logging.googleapis.com/trace的字段。如需详细了解X-Cloud-Trace-Context标头,请参阅强制跟踪请求。
如需查看关联日志,请参阅在 Logs Explorer 中查看关联日志条目。
查看日志
您可以通过多种方式查看应用日志和请求日志:
- 在 Google Cloud 控制台中,通过 Cloud Logging 使用 Logs Explorer。
- 使用 Google Cloud CLI 通过 gcloud 查看日志
- 使用各种方法以编程方式读取日志。
使用 Logs Explorer
您可以使用 Logs Explorer 查看您的应用和请求日志:
在 Google Cloud 控制台中前往 Logs Explorer。
在页面顶部选择一个现有 Google Cloud 项目。
在资源类型中,选择 GAE 应用。
您可以按 App Engine 服务、版本和其他条件过滤日志浏览器。您还可以在日志中搜索特定条目。如需了解详情,请参阅使用日志浏览器。
如果您向标准输出发送简单文本条目,则无法使用日志查看器按严重程度过滤应用条目,也无法查看与特定请求对应的应用日志。您仍然可以在日志浏览器中使用其他类型的过滤,例如文本和时间戳。
在 Logs Explorer 中查看相关日志条目
在 Logs Explorer 中,如需查看与父级日志条目关联的子日志条目,请展开日志条目。
例如,要显示 App Engine 请求日志条目和应用日志条目,请执行以下操作:
在 Google Cloud 控制台的导航面板中,选择 Logging,然后选择 Logs Explorer:
在资源类型中,选择 GAE 应用。
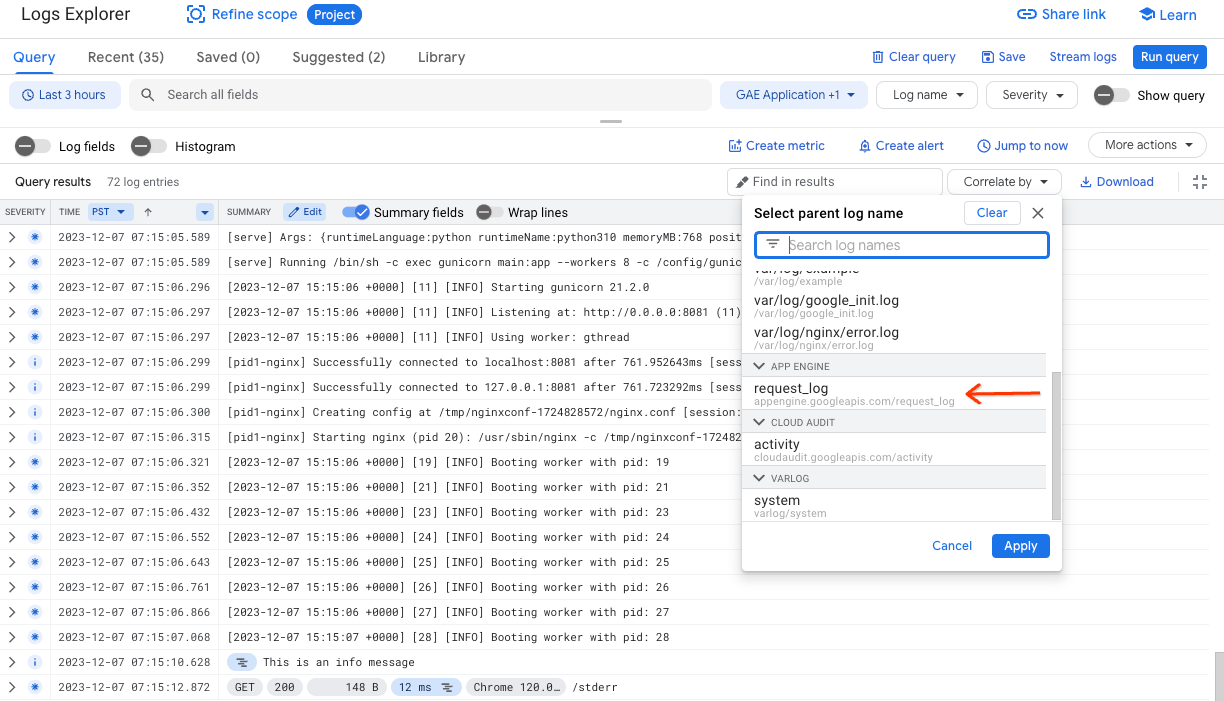
如需查看和关联请求日志,请在日志名称中选择 request_log。或者,如需按请求日志进行关联,请点击关联依据,然后选择 request_log。
在查询结果窗格中,如需展开日志条目,请点击展开。展开后,每个请求日志都会显示关联的应用日志。
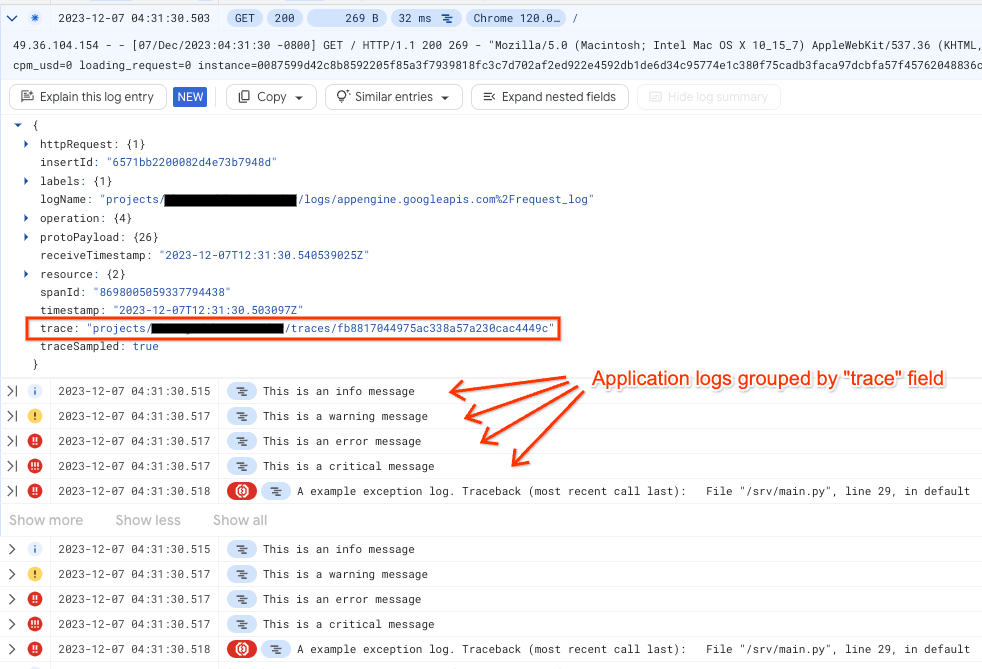
为日志创建过滤条件后,每个请求日志会将相应的应用日志显示为子日志。为实现此目的,Logs Explorer 会将应用日志中的 trace 字段与给定请求日志相关联(假设应用使用 google-cloud-logging 库)。
下图显示了按 trace 字段分组的应用日志:
使用 Google Cloud CLI
如需从命令行查看 App Engine 日志,请使用以下命令:
gcloud app logs tail
如需了解详情,请参阅 gcloud app logs tail。
以编程方式读取日志
如果要以编程方式读取日志,可以使用以下方法之一:
- 使用到 Pub/Sub 的日志接收器和脚本从 Pub/Sub 中拉取。
- 通过与您的编程语言对应的客户端库调用 Cloud Logging API。
- 直接调用 Cloud Logging API REST 端点。
价格、配额和日志保留政策
如需了解适用于请求日志和应用日志的价格,请参阅 Cloud Logging 的价格。
如需了解日志保留政策和日志条目大小上限,请参阅配额和限制。如果您需要将日志存储更长时间,可以将日志导出至 Cloud Storage。您还可以将日志导出到 BigQuery 和 Pub/Sub,以供进一步处理。
管理日志资源使用情况
您可以通过从应用的代码写入更多或更少的条目,控制应用日志记录活动的量。系统会自动创建请求日志,以便管理与应用关联的请求日志条目数。请使用 Cloud Logging 中的日志排除功能。
已知问题
以下是第二代运行时中的一些日志记录问题:
有时,应用日志条目与请求日志无关。当您的应用第一次收到请求时,以及 App Engine 在其他任何时间向应用的日志写入状态消息时,就会发生这种情况。如需了解详情,请访问 https://issuetracker.google.com/issues/138365527。
将日志从日志接收器路由到 Cloud Storage 时,Cloud Storage 目标位置仅包含请求日志。App Engine 将应用日志写入不同的文件夹。
由于请求日志中存在
@type字段,BigQuery 无法注入日志。这会中断自动架构检测,因为 BigQuery 不允许在字段名称中使用@type。如需解决此问题,您必须手动定义架构,并从请求日志中移除@type字段。如果您使用日志记录 REST API,则后台线程会将日志写入 Cloud Logging。如果主线程未处于活跃状态,则实例不会获取 CPU 时间,这会导致后台线程停止。日志处理时间会延迟。系统会在某个时候移除实例,并且所有未发送的日志都会丢失。为避免丢失日志,请使用以下选项之一:
- 将 Cloud Logging SDK 配置为使用 gRPC。使用 gRPC 时,日志会立即发送到 Cloud Logging。不过,这可能会提高所需 CPU 限制。
- 使用
stdout/stderr将日志消息发送到 Cloud Logging。此流水线位于 App Engine 实例外部,不会受到限制。
后续步骤
- 参阅监控和提醒延迟时间,了解如何使用 Cloud Logging 查看调试错误日志,以及如何使用 Cloud Trace 了解应用延迟时间。